Latest Bitcoin Top Is Different From 2021 Peak, Analyst Explains Why

An analyst has explained why the recent high in Bitcoin has experienced different market conditions than those observed during the 2021 bull run peak.

Bitcoin Liquidations Have Been Short-Dominated In Recent Market High

In a new post on X, on-chain analyst Checkmate pointed out how the latest 2024 high achieved following the spot exchange-traded fund (ETF) inflows has a major difference when compared to the 2021 peak.

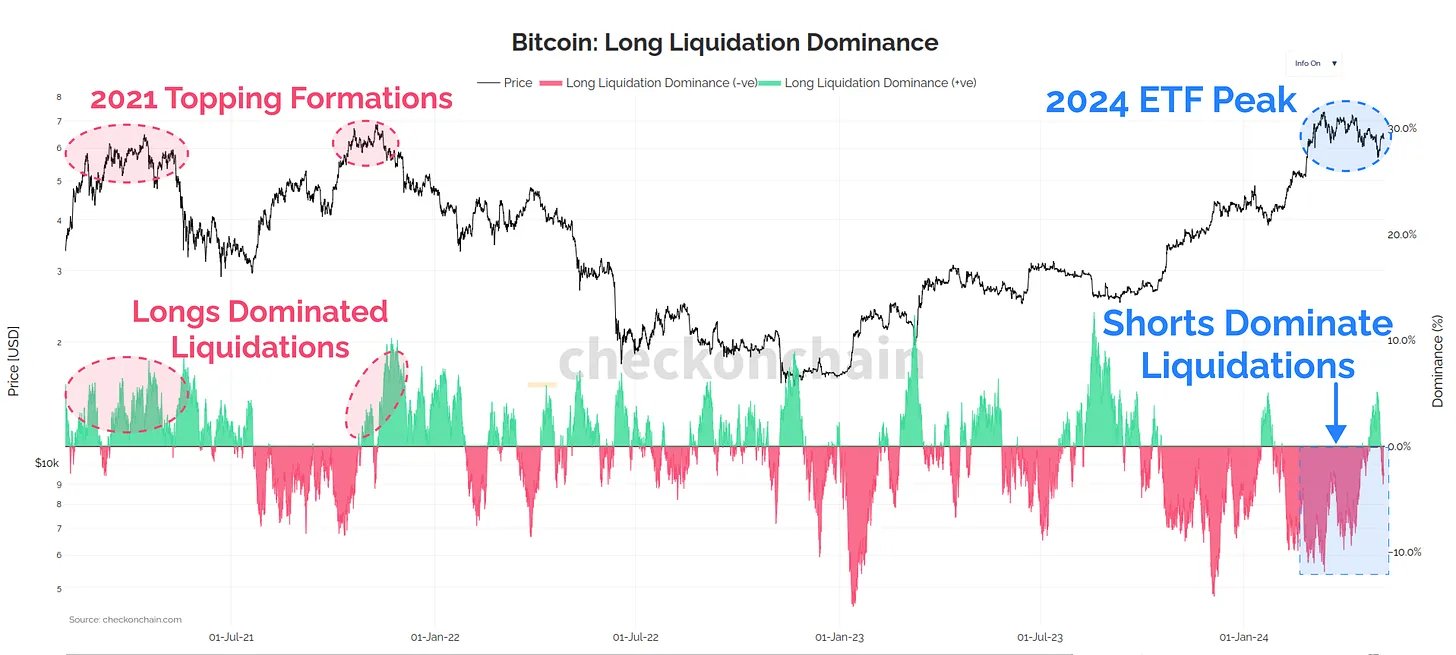
The difference lies in the trend registered on derivatives markets. Below is the chart shared by the analyst that shows the trend in the dominance of long liquidations in the sector over the last few years.

Bitcoin Long Liquidations

Liquidation” here naturally refers to the act of forceful closure that any derivatives market contract undergoes on an exchange when it accumulates losses of a certain degree.

The risk of a contract getting liquidated becomes higher, and the more volatile the asset price gets. During sharp rallies and crashes, huge amounts of liquidation can pile up in the market.

From the chart, it’s visible that as the rally in the cryptocurrency had occurred this year, the short holders had been taking a beating. This was only natural as surges pile up losses for these investors betting on a decline, so price growth as rapid as the one witnessed would have pushed many of these contracts toward liquidation.

Interestingly, the scale of the short dominance maintained throughout the run, implying that the investors didn’t quite believe the run would continue any further at every point of the rally, so they bet against it.

This has also remained true in the recent stagnation following the top, as short liquidations have outweighed the long ones even though the price has decreased.

As is apparent in the graph, the 2021 peaks saw a different trend. Longs were getting liquidated as Bitcoin topped out during both the first half of the 2021 peak and the second half.

In those periods, the investors had become too greedy and were only betting on the rise to continue even when the asset had slowed down. This greed appears to haven’t overtaken the market in the bull run.

While the current Bitcoin rally differs from the last one in this metric, analyst Maartunn has pointed out in an X post another indicator where the trend appears to be similar to that observed in previous peaks.

Image

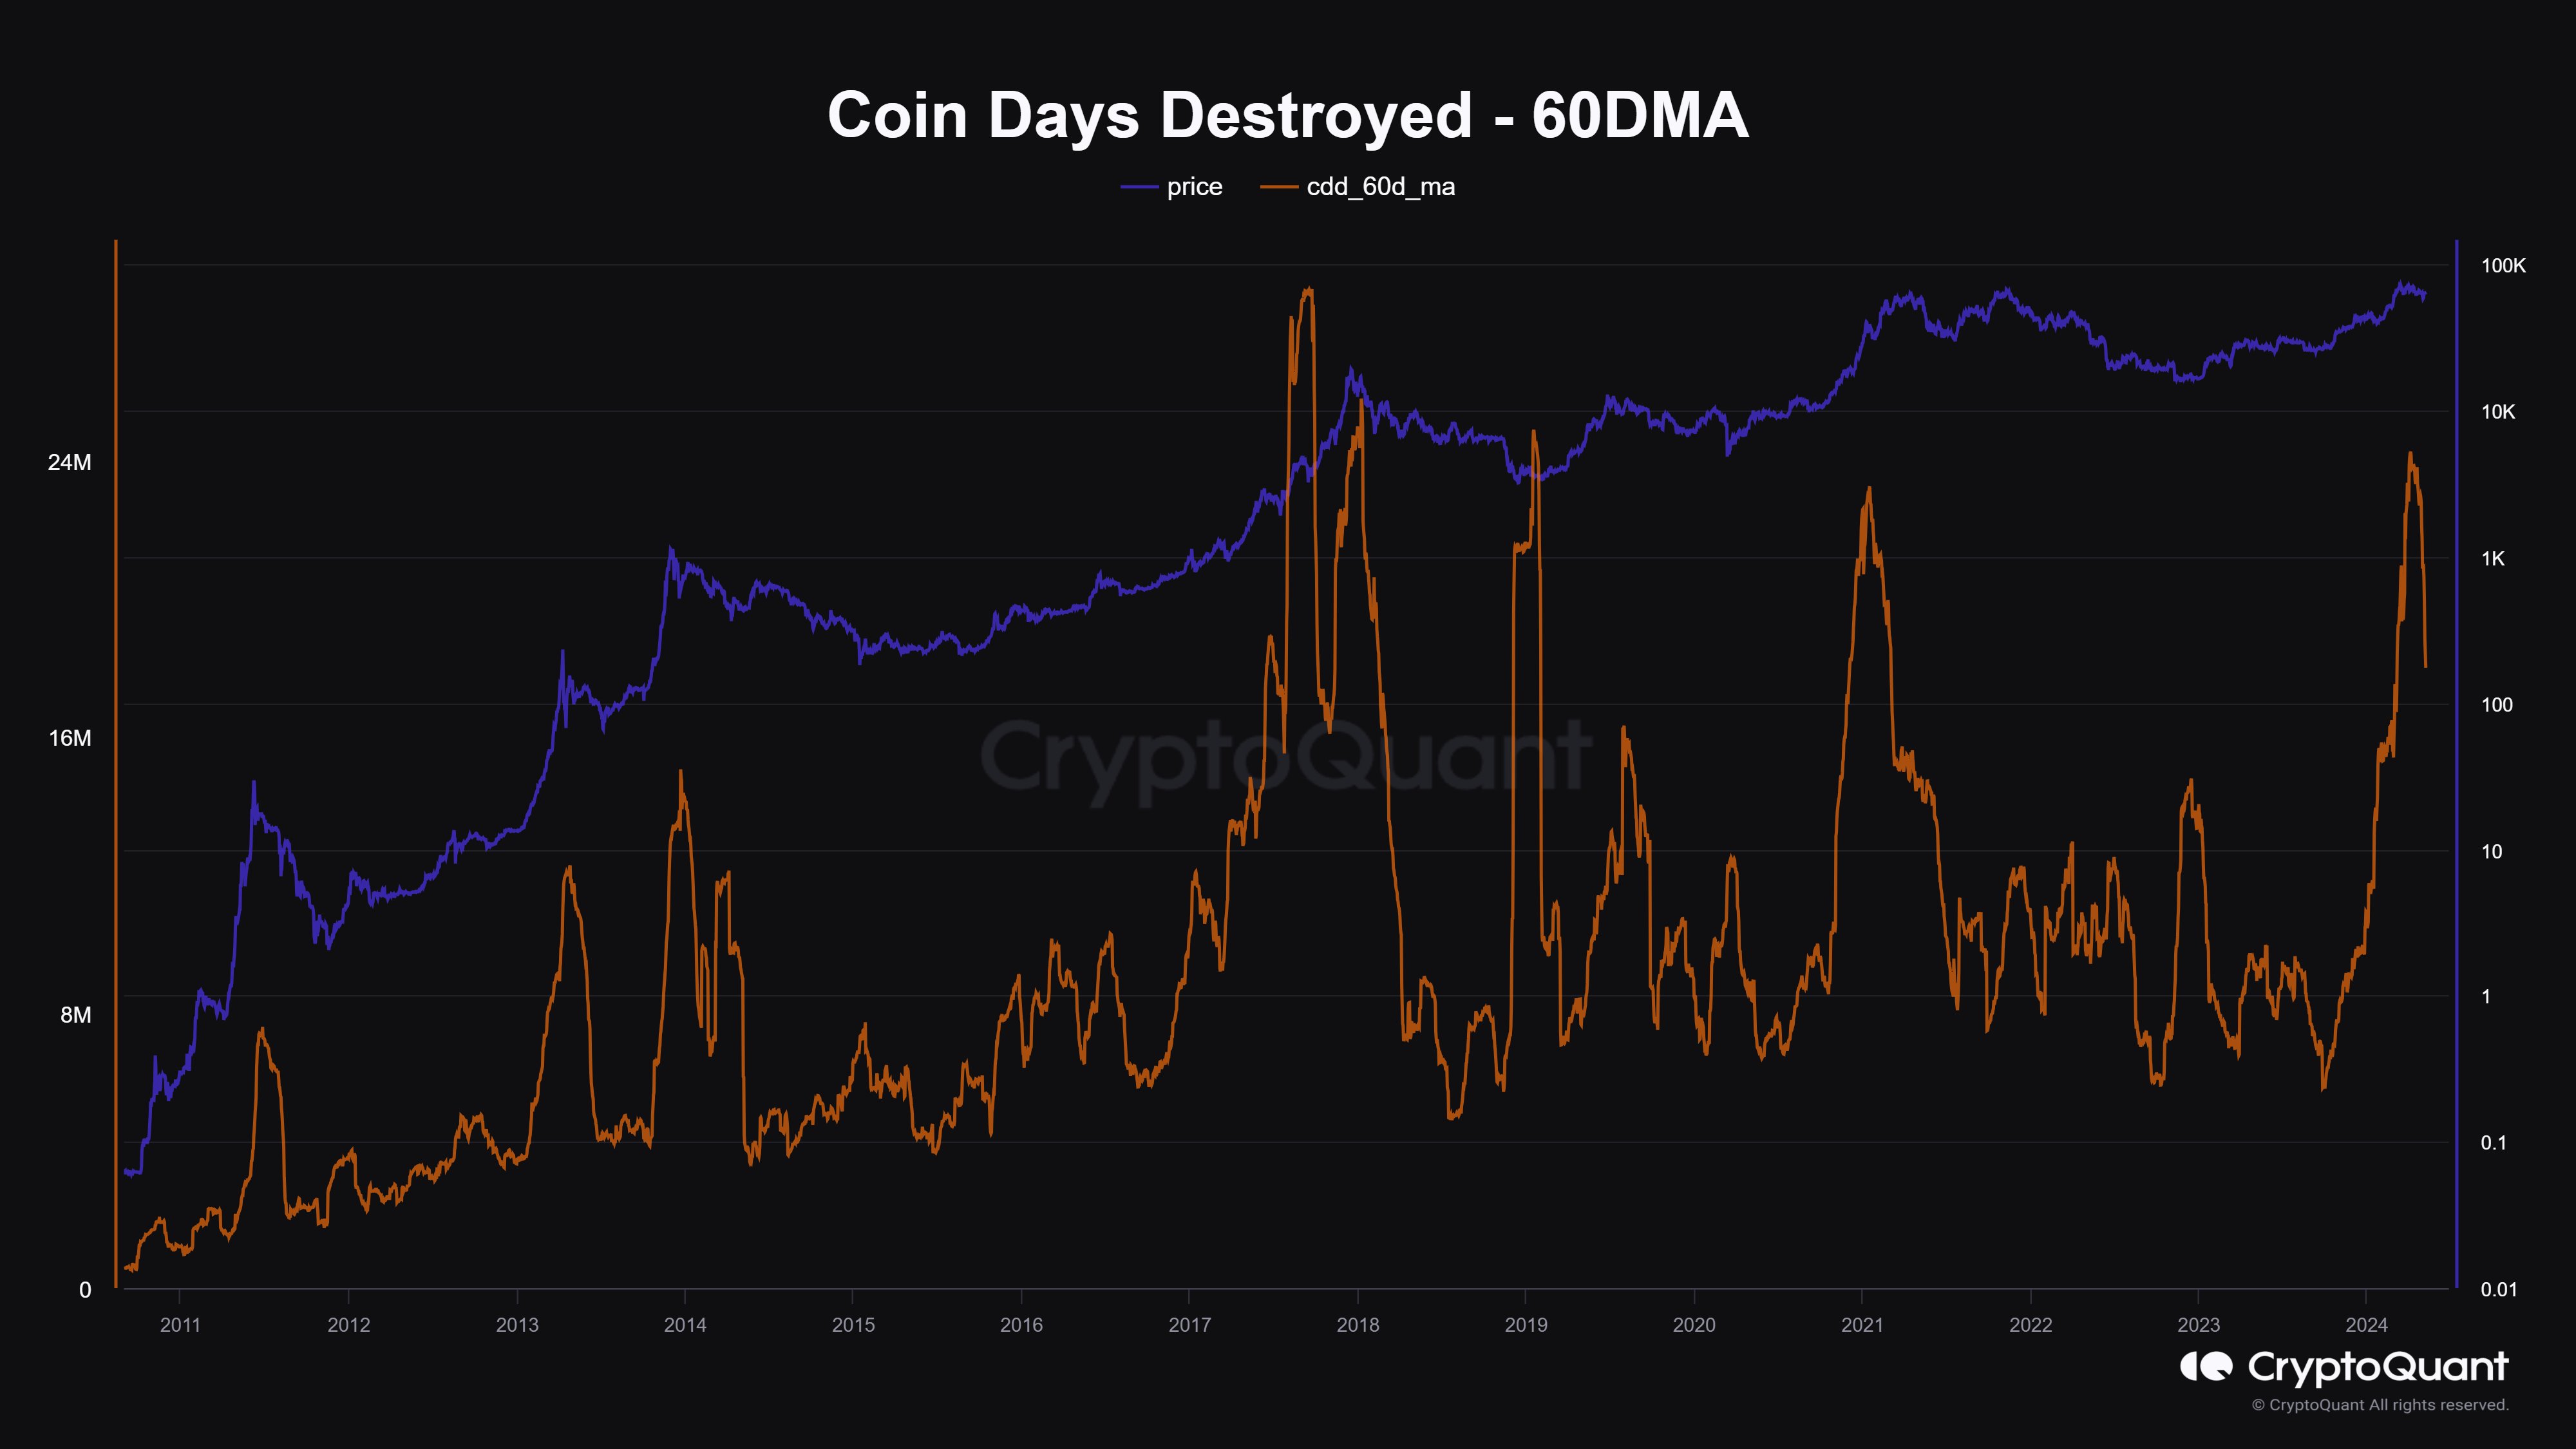
This indicator is the Coin Days Destroyed (CDD), which basically tells us about the scale of dormant coin movement that’s happening in the market right now. It would appear that this metric had attained very high levels recently.

“Coin Days Destroyed has probably peaked,” says Maartunn. “Bitcoin’s price typically reaches its peak around the same time.” It should be noted that although this has been true for some of the tops, the 2021 peak took months to form after the metric peaked.

BTC Price

At the time of writing, Bitcoin is floating around $62,200, up more than 5% over the past week.
Bitcoin Price Chart

Is The Bitcoin Top Already Here? This Historical Pattern Says So

A historical pattern currently forming in a Bitcoin on-chain indicator could suggest that a top may be near for the asset, if not already in.

Bitcoin SOPR Ratio Is Forming A Historical Top Pattern Right Now

In a CryptoQuant Quicktake post, an analyst has discussed about a pattern regarding the SOPR Ratio. The “Spent Output Profit Ratio” (SOPR) is an indicator that tells us whether the Bitcoin investors are selling their coins at a profit or loss right now.

When the value of this metric is greater than 1, it means that profit-selling is dominant in the market currently. On the other hand, the metric being under the threshold suggests the average holder is moving coins at some net loss.

In the context of the current topic, the SOPR itself isn’t of interest; rather, it is a different version called the SOPR Ratio. The name may be a bit confusing as SOPR already contains a “ratio,” but the latter ratio here corresponds to the fact that this indicator compares the SOPR of two Bitcoin cohorts: the long-term holders (LTHs) and short-term holders (STHs).

These investor groups make up for the two main divisions of the BTC market done based on holding time, with 155 days being the cutoff between the two. The STHs are those who bought within the past 155 days, while the LTHs include the HODLers carrying coins for longer than this timespan.

Now, here is a chart that shows the trend in the 7-day moving average (MA) of the Bitcoin SOPR Ratio over the history of the cryptocurrency:

Bitcoin SOPR Ratio

As displayed in the above graph, the 7-day MA Bitcoin SOPR Ratio had been heading up throughout 2023 and early parts of 2024, but recently, the metric has hit a top and reversed its direction. Whenever the SOPR Ratio is higher than 1, it means the LTHs, who are generally known to be resolute hands, are participating in a higher degree of profit-taking than the STHs.

It would appear that as BTC had observed its rally and approached a new all-time high (ATH), these diamond hands had started harvesting some of the gains they had earned over their long holding time. And once the price set a new ATH, these investors participated in peak profit-taking. Since then, their profit-selling has been dropping off, although they are still harvesting notably higher gains than the STHs.

In the chart, the analyst highlights how this pattern has been repeated at different points in the asset’s history. While the scale of the peak LTH profit-taking has been heading down over the cycles, it’s still true that the metric’s top has coincided with tops in the price during each of them.

As the line drawn by the quant suggests, it’s possible that the latest peak in the metric may have in fact been the top for this cycle. This is only, however, assuming that the pattern of diminishing returns in the indicator holds to the exact degree judged by the line.

It’s possible that the peak will still be higher than the current levels, while at the same time being lower than the previous cycle’s peak, thus still being in-line with the historical Bitcoin pattern.

Whatever the case be, though, the fact that the SOPR ratio has apparently hit a top could still be a bearish signal, if only in the short term.

BTC Price

Bitcoin has been making some steady recovery over the last few days as its price has now surged back above $66,100.

Bitcoin Price Chart

This Bitcoin Indicator May Have Signaled Latest Market Downturn In Advance

The Bitcoin Network Value to Transactions (NVT) Golden Cross indicator attained overheated values coinciding with the recent local top in the price.

Bitcoin NVT Golden Cross Surged To 3.17 During Recent Peak

An analyst in a CryptoQuant Quicktake post explained that the NVT Golden Cross may have served as an indicator of the recent top in cryptocurrency prices.

The “NVT” refers to an on-chain metric that tracks the ratio between Bitcoin’s market cap and transaction volume (both in USD). This ratio is generally used to determine whether the asset’s price is fair or not.

When the indicator has a high value, the asset’s price (the market cap) is high compared to its utility (the transaction volume). Such a trend may suggest that the coin could be overvalued currently.

On the other hand, the low metric could suggest the network isn’t valued fairly compared to its high ability to transact capital, and as such, its price may be due to an uplift.

In the context of the current discussion, the NVT itself isn’t interesting, but rather, a modified version called the NVT Golden Cross is. This metric compares the short-term trend of the NVT (10-day moving average) against its long-term trend (30-day MA).

Like the NVT, this variant is also used to estimate the fairness of the asset. Historically, values greater than 2.2 have been a signal that BTC is overheated, as the short-term trend is notably outpacing the long-term at these levels.

Similarly, values under the -1.6 level may indicate that the cryptocurrency is undervalued; hence, its price may likely form a bottom and find a rebound soon.

Now, here is a chart that shows the trend in the Bitcoin NVT Golden Cross over the last few years:

Bitcoin NVT Golden Cross

As displayed in the above graph, the Bitcoin NVT Golden Cross rose to relatively high levels earlier. This growth happened as the asset’s price rallied towards the $71,000 level.

The metric had touched the 3.17 mark in this surge, which suggests the coin may have become too overpriced. Indeed, the asset followed this by observing a sharp drawdown, which took it back under the $65,000 level.

As the quant has marked in the chart, a similar pattern of the NVT Golden Cross hitting these high levels and resulting in a price correction was observed at different points over the last few years.

Since the latest overheated signal, the indicator has cooled off alongside the Bitcoin price, although it hasn’t gone towards the negative side yet.

BTC Price

Bitcoin has recovered over the past day as its price has now climbed back to $67,800.

Bitcoin Price Chart

Bitcoin Top In Yet? What The Legendary MVRV Ratio Says

Here’s what the latest trend in the Bitcoin Market Value to Realized Value (MVRV) ratio suggests about where the market is currently in terms of a top.

Bitcoin MVRV Ratio Has Seen A Decline To The 2.34 Level

According to data from the market intelligence platform IntoTheBlock, the BTC MVRV ratio surged high earlier this year as the cryptocurrency rally took place.

The “MVRV ratio” is a popular indicator that tracks the ratio between the Bitcoin market cap and the realized cap. The former is simply the total valuation of the asset’s supply at the current spot price, while the latter is an on-chain capitalization model.

The realized cap measures the total sum of the value of the cryptocurrency’s supply, assuming that each coin in circulation has its true value at the price at which it was last transferred on the blockchain rather than the current spot value.

One way to interpret the realized cap is that since it takes into account the buying price of every token in circulation (assuming that the last transaction of every token was indeed the point at which it last changed hands), it essentially sums up the total capital the investors have invested in the asset.

As such, the MVRV ratio tells us how the total value that Bitcoin investors are carrying right now (that is, the market cap) compares against the value they put in (the realized cap).

Now, here is a chart that shows the trend in the Bitcoin MVRV ratio over the past few years:

Bitcoin MVRV ratio

As is visible in the graph, the Bitcoin MVRV ratio has had a value greater than 1 for a while now. When the indicator has such values, the market cap is greater than the realized cap, and hence, the investors carry net profits.

With the latest rally in the asset, this indicator has surged to relatively high levels, a natural consequence of the holders’ profits ballooning up with the price surge.

After the recent drawdown in the price, though, the MVRV ratio has also turned itself around, as it’s now heading down. At present, the ratio has a value of around 2.34.

“Traditionally, an MVRV ratio above 3 has been a reliable marker for predicting price peaks,” notes IntoTheBlock. So far, in the current rally, the metric hasn’t crossed this mark. It did come close recently, but the latest decline has meant it has gained a bit more distance to the level.

Why have tops historically occurred at high values of the Bitcoin MVRV ratio? The answer is that investors in profits are more likely to participate in selling, and this temptation to take profits only increases as their gains grow larger.

Because of this, selloffs are most probable when the market is holding extreme levels of profits, which is exactly what high MVRV ratio values reflect.

BTC Price

At the time of writing, Bitcoin is trading at around $67,200, up 3% over the past 24 hours.

Bitcoin Price Chart

Bitcoin Long-Term Holders & Price Top: Glassnode Reveals Pattern

The on-chain analytics firm Glassnode has explained that Bitcoin tends to reach a potential top when the long-term holders show this pattern.

Bitcoin Long-Term Holders Have Been Ramping Up Distribution

In a new report, Glassnode discussed the influence that the BTC long-term holders have on the cryptocurrency’s supply dynamics. The “long-term holders” (LTHs) here refer to the Bitcoin investors who have been holding onto their coins for more than 155 days.

The LTHs comprise one of the two main divisions of the BTC user base based on holding time, with the other cohort known as the “short-term holders” (STHs).

Historically, the LTHs have proven themselves to be the persistent hands of the market. They don’t quickly sell their coins regardless of what is happening in the broader sector. The STHs, on the other hand, often react to FUD and FOMO events.

As such, it’s not unusual to see the STHs participating in selling. However, the LTHs showing sustained distribution can be something to note, as selling from these HODLers, who usually sit tight, may have implications for the market.

There are many different ways of tracking the behavior of the LTHs, but in the context of the current discussion, Glassnode has used the “LTH Market Inflation Rate” metric.

As the report explains:

It shows the annualized rate of Bitcoin accumulation or distribution by LTHs relative to daily miner issuance. This rate helps identify periods of net accumulation, where LTHs are effectively removing Bitcoin from the market, and periods of net distribution, where LTHs add to the market’s sell-side pressure.

Now, here is a chart that shows the trend in the BTC LTH Market Inflation Rate over the past several years:

Bitcoin LTH Market Inflation Rate

In the chart, the analytics firm has also attached the data for the asset’s Inflation Rate, which is basically the amount that the miners are introducing into the circulating supply by solving blocks and receiving rewards for them.

When the LTH Market Inflation Rate equals 0%, these HODLers are accumulating amounts exactly equal to what the miners are issuing.

This implies that the indicator below the 0% mark suggests the LTHs are pulling coins out of the supply, while it being above is a sign that they are either distributing or just not buying enough to absorb what the miners are producing.

The graph shows that historically, the cryptocurrency’s price has tended to reach a state of equilibrium and potentially even a top when the LTH distribution has peaked.

The LTH Market Inflation Rate has been increasing recently, but it’s yet to reach any significant levels. As for what this could mean for the market, Glassnode says:

Currently, the trend in the LTH market inflation rate indicates we are in an early phase of a distribution cycle, with about 30% completed. This suggests significant activity ahead within the current cycle until we achieve a market equilibrium point from the supply and demand perspective and potential price tops.

BTC Price

Bitcoin has retraced most of its recovery from the past few days, as its price has now declined to $63,800.

Bitcoin Price Chart

Bitcoin Extreme Greed At Levels Higher Than Nov. 2021 Peak, Top Signal?

Data shows the Bitcoin sentiment has now reached extreme greed levels higher than even those at the price all-time high (ATH) in November 2021.

Bitcoin Fear & Greed Index Is Deep Inside Extreme Greed Territory Now

The “Fear & Greed Index” is an indicator created by Alternative that keeps track of the general sentiment present among the investors in the Bitcoin and wider cryptocurrency market right now.

The metric represents this average sentiment in the form of a score lying in the zero to hundred range. To calculate this score, the index takes into account the following five factors: volatility, trading volume, social media sentiment, market cap dominance, and Google Trends.

When the indicator shows a value less than 47, it means that the sentiment around the sector is that of fear. On the other hand, the index being above the 53 mark implies the presence of greed among the investors. Naturally, the region between these two territories belongs to the neutral mentality.

Besides these three main sentiments, there are two “extreme” sentiments called extreme fear and extreme greed. The former of these occurs at and below 25, while the latter is 75 and above.

Now, here is what the Bitcoin Fear & Greed Index currently looks like:

Bitcoin Fear & Greed Index

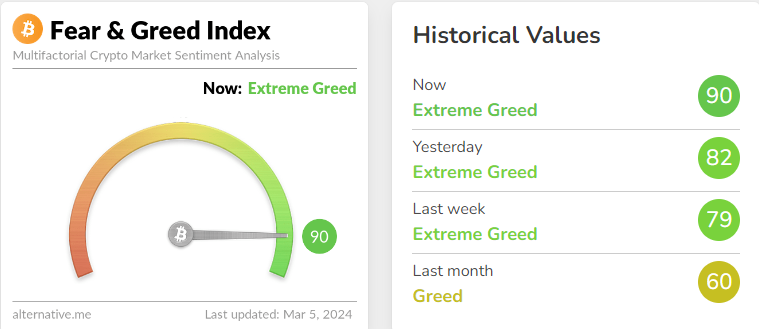
As is visible above, the Bitcoin Fear & Greed Index’s current value is 90, which means that the investors are holding a strong sentiment of extreme greed. This latest value is quite the jump from the sentiment from yesterday, when the index was around 82.

The reason behind this sharp increase in the indicator is obviously because of the fact that the cryptocurrency’s price has been pushing towards a new all-time high during its latest rally.

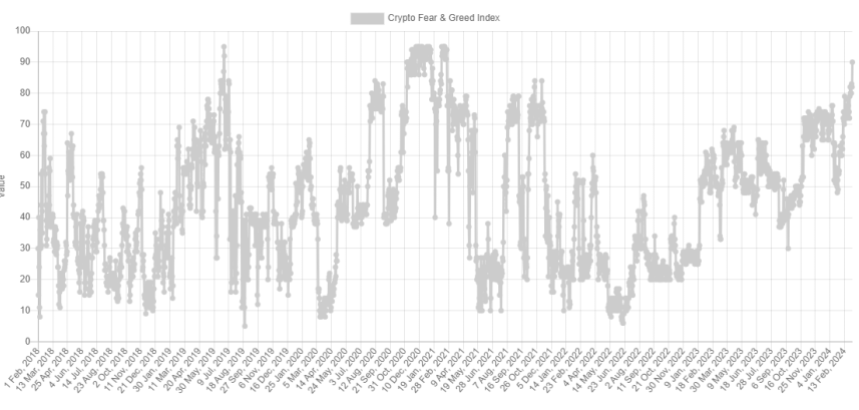
The current level of the Fear & Greed Index isn’t only high compared to the recent trend, but also when considering the historical data. The below chart shows how the metric’s value has fluctuated since its inception back in 2018:

Bitcoin Extreme Greed

As displayed in the graph, the Bitcoin Fear & Greed Index has now surpassed the level that it assumed during the November 2021 price all-time high, as it stands at values just below those observed between late 2020 and early 2021.

Besides this period, there has only been one other instance in the history of the metric where it has achieved levels higher than now: the rally peak during mid-2019.

Historically, Bitcoin has tended to move against the expectations of the majority, and as this expectation has leaned more towards one side, the probability of such a contrary move taking place has only gone up.

The top in the 2019 rally and November 2021 are just two such examples of this pattern in action. As such, it’s possible that the current extreme levels of the indicator mean that the price is at risk of forming a top right now.

It should be noted, however, that a top doesn’t necessarily have to immediately follow, as during the first half 2021 bull run, the metric was able to maintain at even higher levels for a while, without the rally being compromised.

BTC Price

Bitcoin was on the brink of setting a new all-time high just earlier, but its price has since cooled off towards the $66,700 level.

Bitcoin Price Chart

CryptoQuant’s Bitcoin “Bull-Bear” Indicator Flags Price As Overheated

The Bitcoin “bull-bear” indicator from the on-chain analytics firm CryptoQuant has recently flagged the cryptocurrency’s price to be “overheated.”

Bitcoin May Be Overheated According To This Indicator

As pointed out by CryptoQuant Head of Research Julio Moreno in a post on X, the BTC price has increased so fast that some on-chain indicators have started to signal a potential phase of overheating.

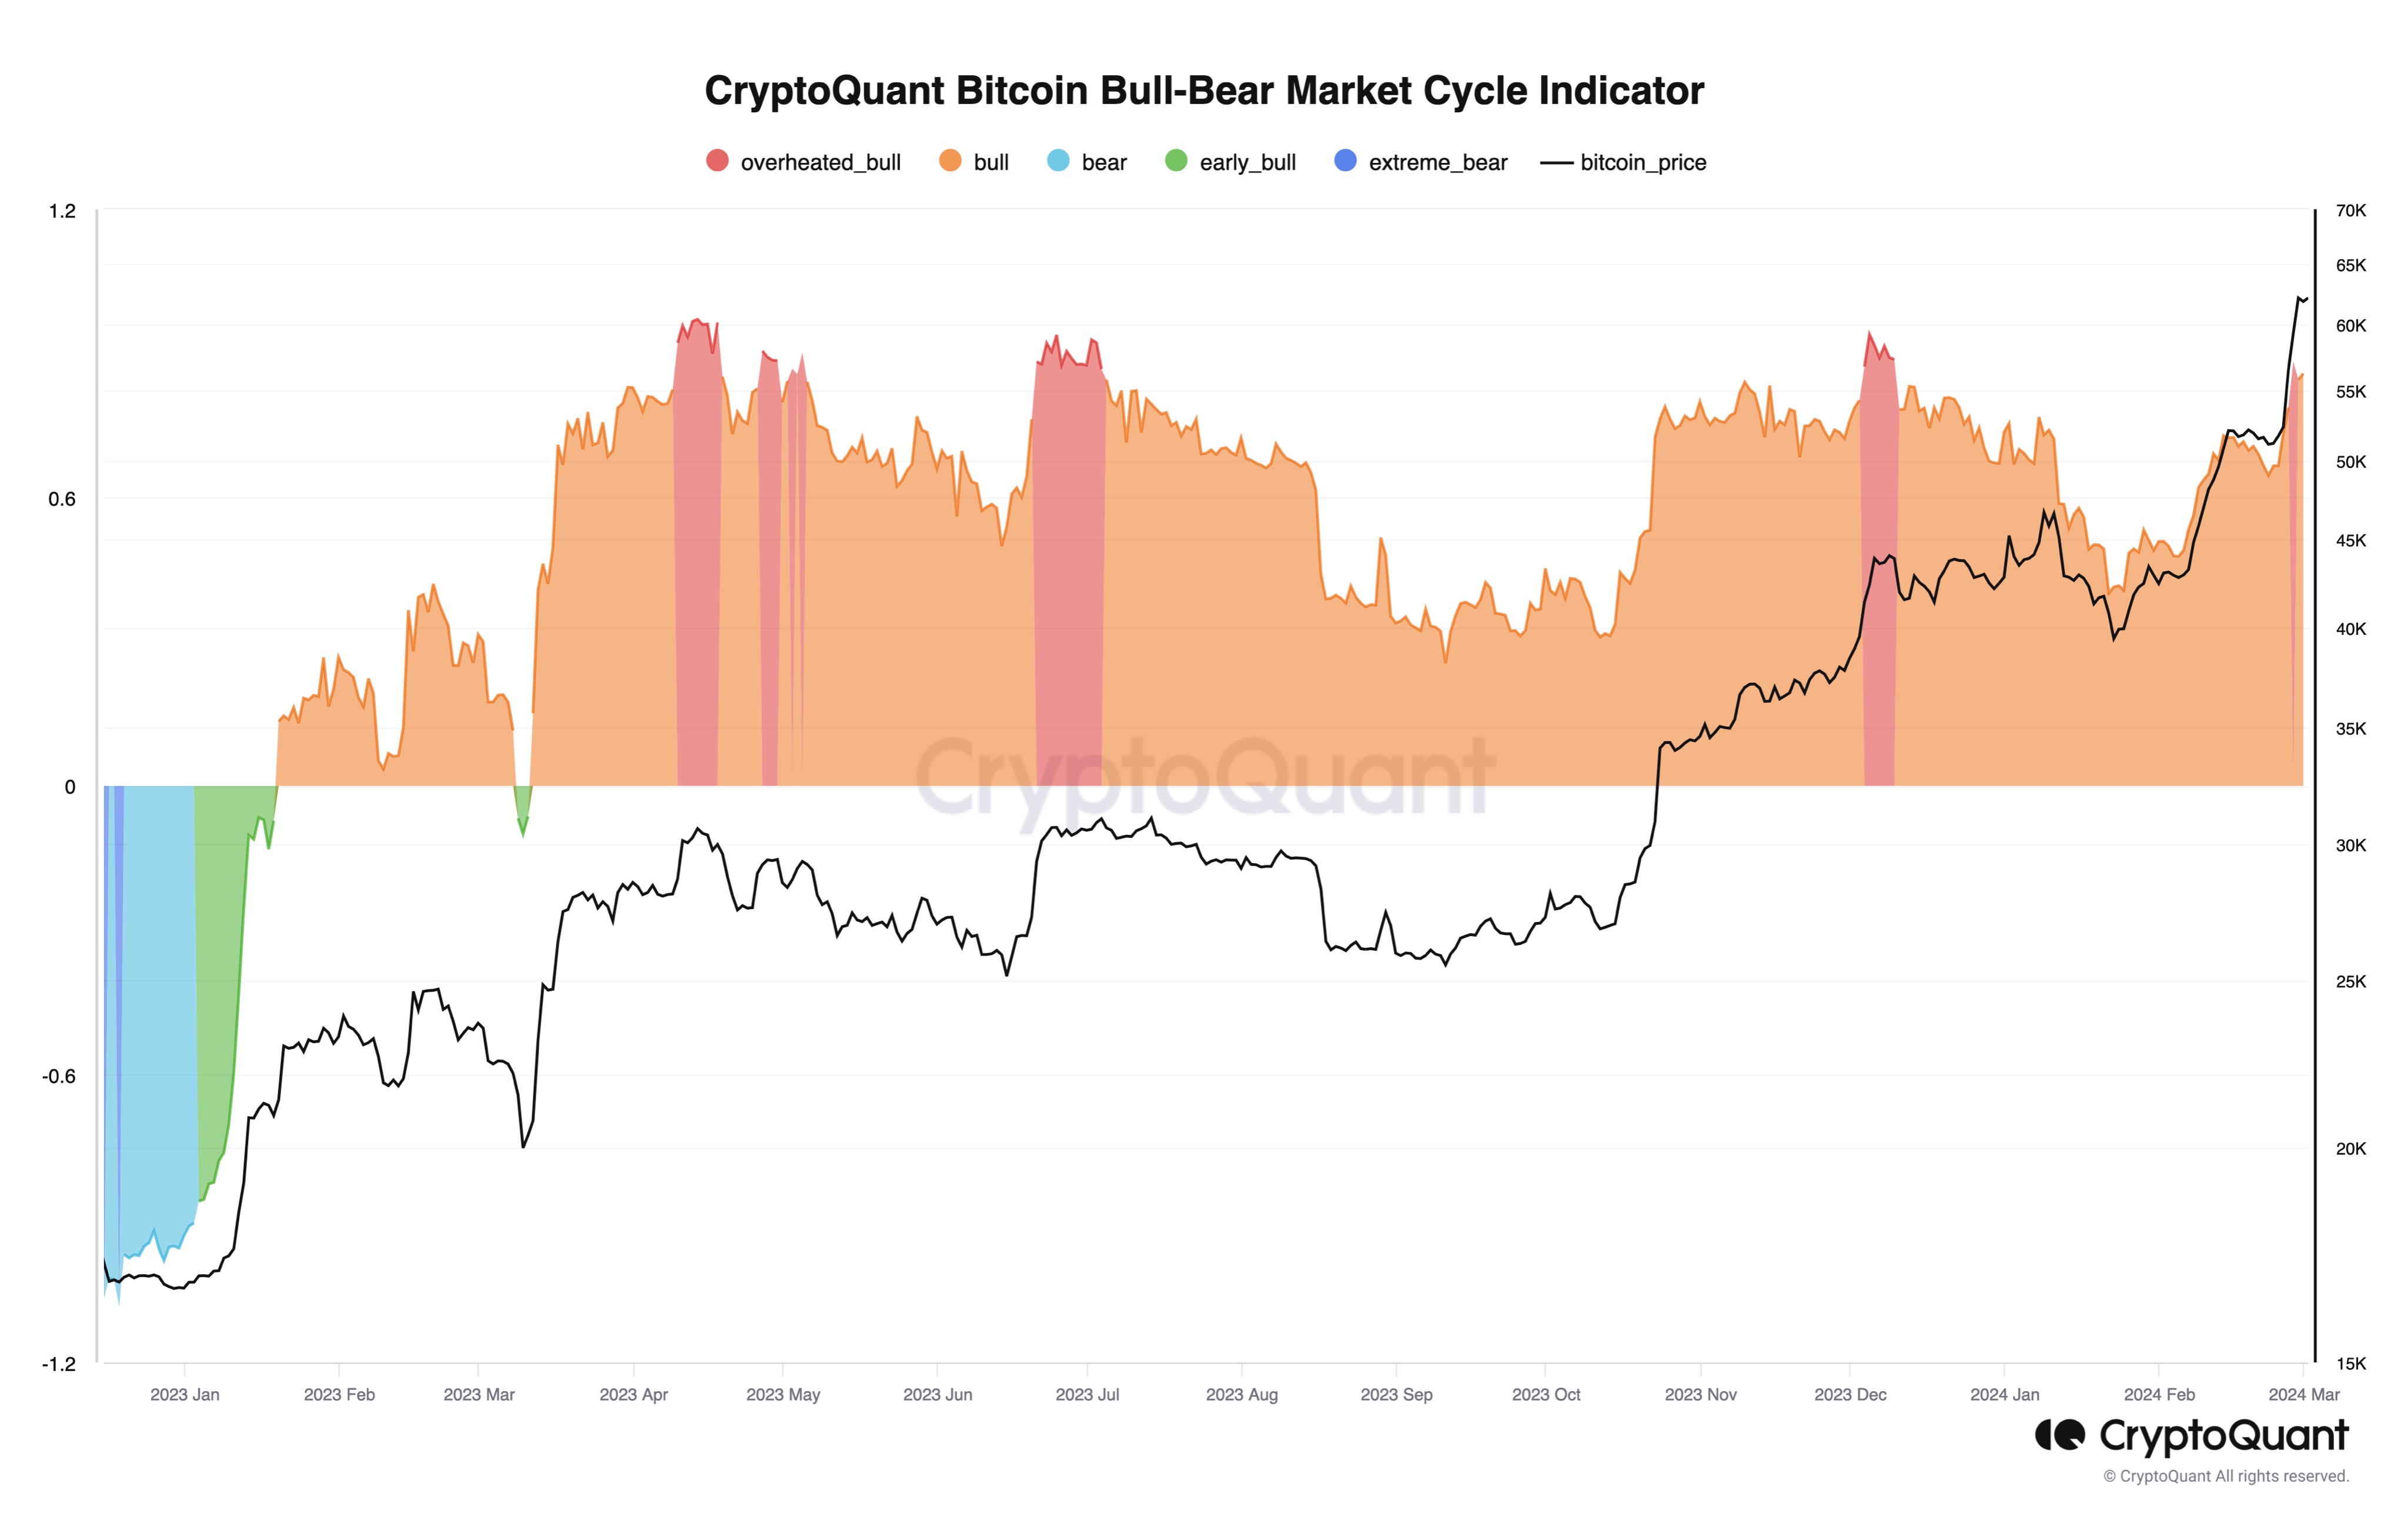
The first metric of interest here is the Bitcoin Bull-Bear Market Cycle Indicator made by the analytics firm that tracks the various phases of bull and bear markets.

Here is how the indicator has looked like over the past year:

Bitcoin Bull-Bear Indicator

As displayed in the above graph, Bitcoin has been inside the “bull” territory since the early part of 2023 and over the course of this run, the metric has hit “overheated bull” levels during a few different instances.

From the chart, it’s visible that such values of the indicator have previously coincided with some kind of top in the cryptocurrency’s price. With the latest rally in the asset, it would appear that the market has once again entered into this territory of overheating.

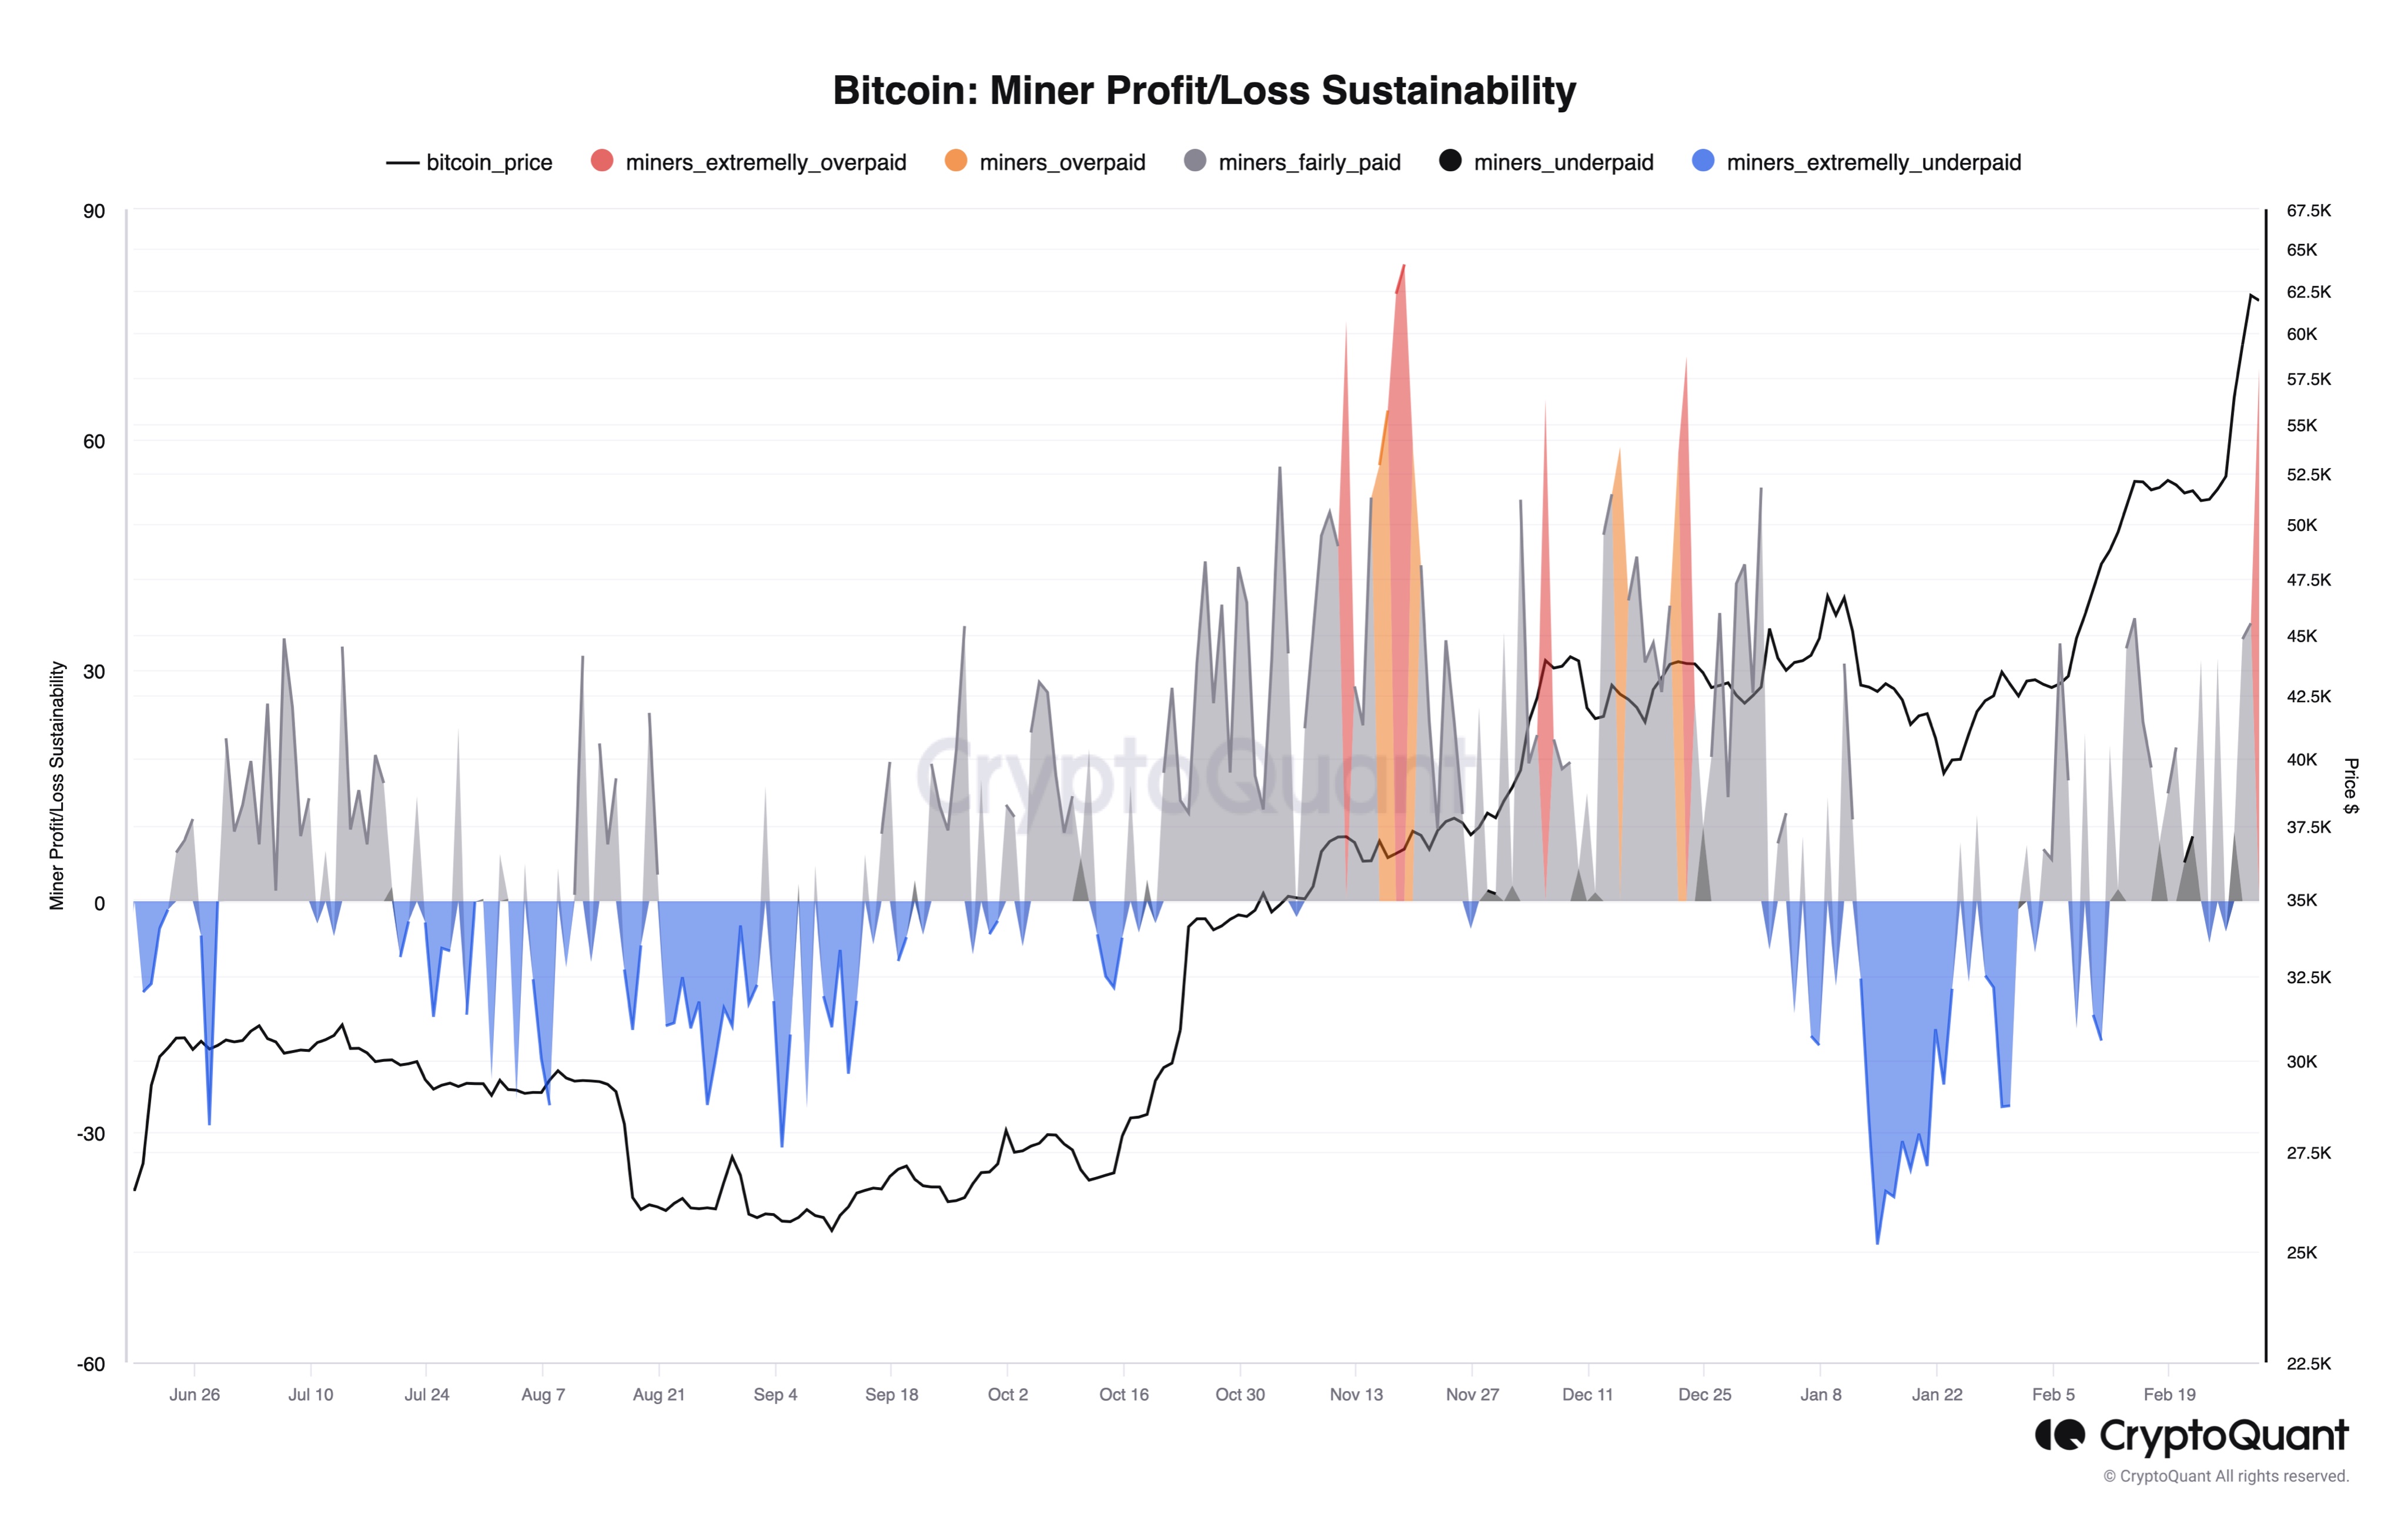
Another metric, the BTC “Miner Profit/Loss Sustainability,” is also suggesting an overheated market, according to Moreno. This indicator basically keeps track of whether the miners are being overpaid or underpaid compared to the fair value baseline.

Bitcoin Miners

As displayed in the chart, the Bitcoin Miner Profit/Loss Sustainability has entered into the “extremely overpaid” zone after the price surge, implying that a cool off might perhaps be due.

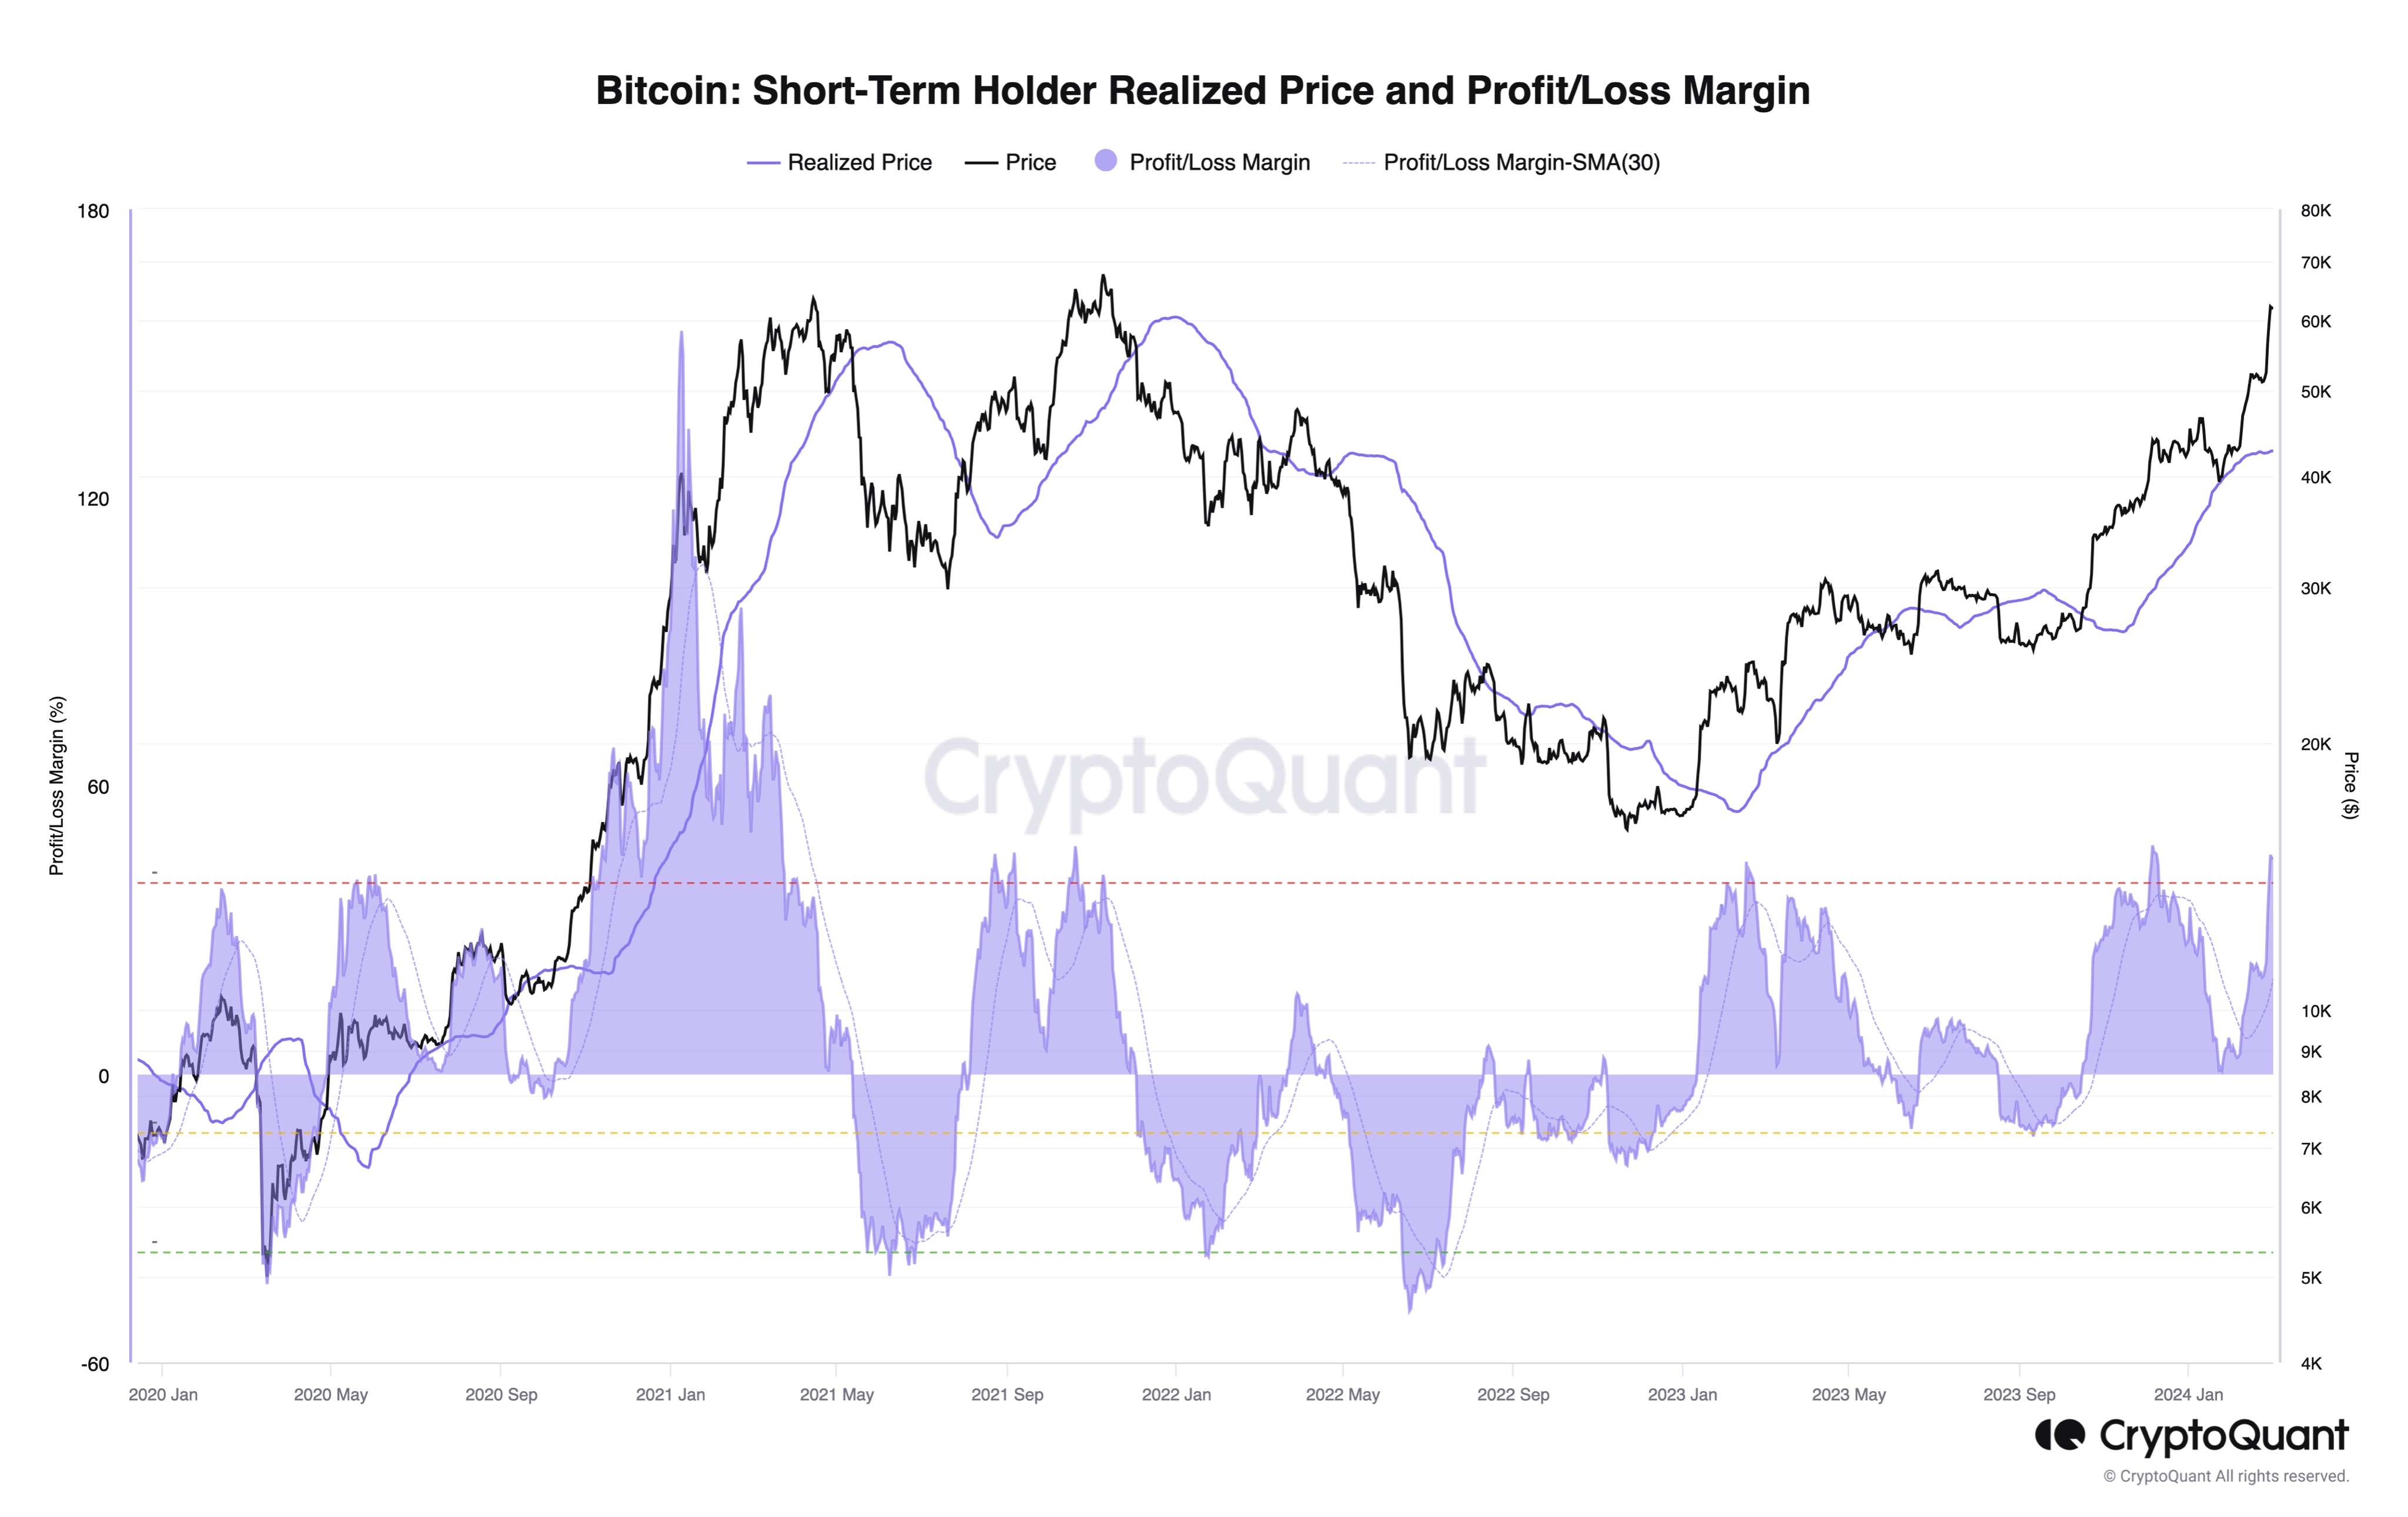
Finally, the Bitcoin short-term holders (STHs) are also sitting on large profits at the moment, which can be another sign that things have started to heat up.

Bitcoin Short-Term Holders

The STHs refer to the Bitcoin investors who bought their coins within the past 155 days. These holders are considered the weak hands of the sector, who may easily sell at the sight of FUD or FOMO.

As the above chart shows, this cohort’s unrealized profits have swelled up as the Bitcoin price has enjoyed its rally. Recently, they have achieved profit margins upward of 45%.

At any point, holders in profits are more likely to sell their coins. As these profits rise, the probability of the investor buckling into the allure of profit-taking also increases.

As such, a large amount of these fickle-minded Bitcoin investors holding significant profits means that there is a high risk of a potential selloff taking place in the market.

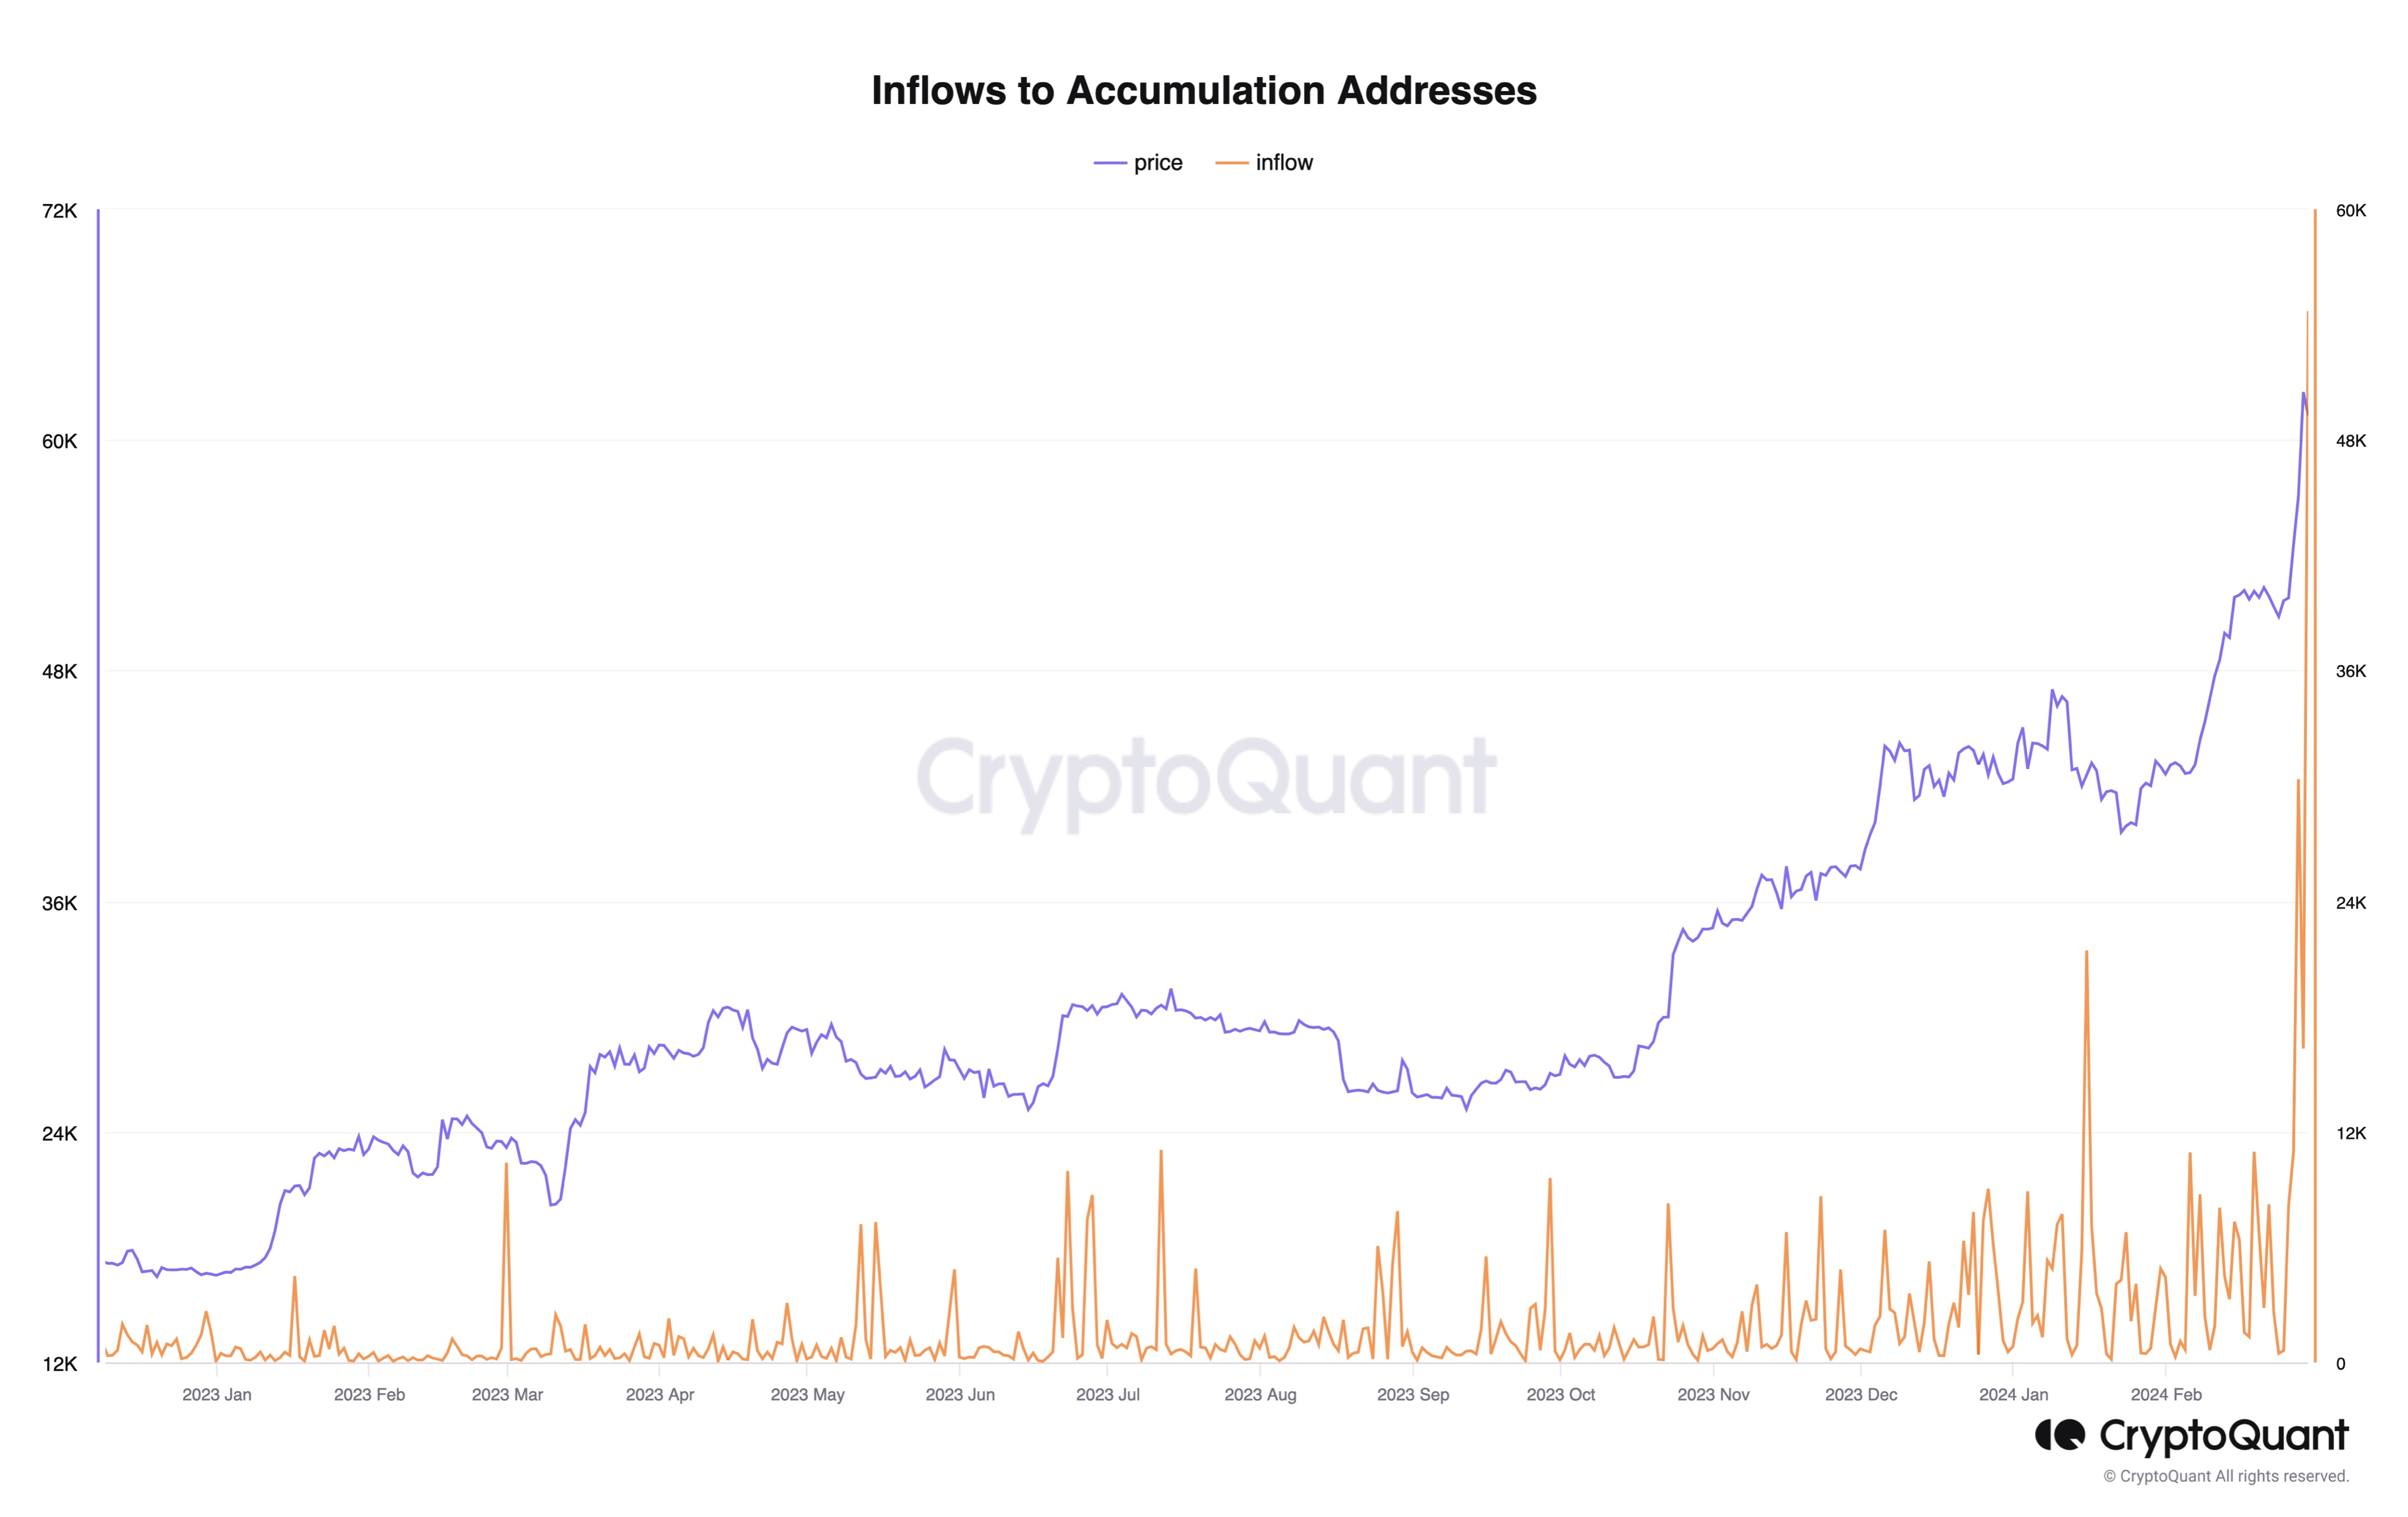
While all these indicators are pointing to the cryptocurrency perhaps being overvalued, there has still been a positive development in an indicator. This metric is the “Inflows to Accumulation Addresses.”

Bitcoin Accumulation

Accumulation addresses are defined as those that have a history of only buying Bitcoin and never of selling. At present, these HODLers are observing an all-time high amount of inflows, which can definitely be a bullish sign.

BTC Price

Bitcoin has seen the latest continuation to its run in the past 24 hours as its price has now broken past the $65,100 barrier.

Bitcoin Price Chart

95% Of Bitcoin Now In Profit: Why This Could Be A Signal To Sell

On-chain data shows the Bitcoin supply in profit has reached levels that led to some tops in the past, like the peak of the April 2019 rally.

Bitcoin Supply In Profit Has Shot Up Following BTC’s Latest Run

As pointed out by an analyst in a CryptoQuant Quicktake post, Bitcoin supply in profit has hit very high levels after the asset’s latest rally. The “supply in profit” here refers to a metric that measures the percentage of the total circulating BTC supply that’s currently carrying some amount of unrealized gain.

This indicator works by going through the transaction history of each coin (more precisely, each UTXO) on the blockchain to see what price it was last moved at. Assuming that the previous transfer of the coin was the last time it changed hands, the price at that instance would act as its current cost basis.

As such, if the previous transfer price for any coin was less than the spot value of the cryptocurrency right now, then that particular coin would be holding a profit currently. The supply in profit sums up all such coins and calculates what percentage of the total supply they make up for.

A counterpart indicator called the “supply in loss” does the same for coins of the opposite type (that is, those with a cost basis lower than the current price). This metric’s value can also simply be found by subtracting the supply in profit from 100 (since the total supply must add up to 100%).

Now, here is a chart that shows the trend in the Bitcoin supply in profit over the past few years:

Bitcoin Supply In Profit

As displayed in the above graph, the Bitcoin supply in profit has naturally shot up recently as the asset’s price has gone through its rally. After the latest continuation of the run towards the $57,000 level, the metric has hit the 95% mark.

This means that 95% of all UTXOs in existence is carrying a profit at the moment. This may not entirely be a positive thing, however, if history is anything to go by.

As the quant has highlighted in the chart, the BTC rally that started in April 2019 topped out just as the supply in profit hit the same high levels as right now. Similarly, the local top in 2020 at the beginning of the last bull market also coincided with these levels.

The reason behind this pattern is likely to be the fact that investors in profit are more likely to sell their coins at any point. Thus, when a large percentage of holders are carrying gains, the probability of a mass selloff can spike up.

That said, in the 2017 and 2021 bull runs, as well as during the November 2021 peak, the indicator did manage to surpass these levels for a while before the top was encountered.

As such, it remains to be seen if the current rally is similar to the likes of the April 2019 run, in which case a top might be hit here, or if it’s a proper bull run, meaning that there might still be a while to go before the peak.

BTC Price

At the time of writing, Bitcoin is trading around the $56,500 level, up 8% over the past week.

Bitcoin Price Chart

Bitcoin Signal That Has Held Since December Says It’s Time To Sell

An analyst has explained that an indicator that has been holding for Bitcoin since December is now giving a sell signal for the cryptocurrency.

TD Sequential Is Providing A Sell Signal On Daily Bitcoin Chart Currently

In a new post on X, analyst Ali discussed a TD Sequential sell signal forming in the Bitcoin daily price chart. The “Tom Demark (TD) Sequential” is an indicator in technical analysis used for pinpointing locations of probable tops and bottoms in any asset’s price.

The TD Sequential has two phases. The first is called the “setup” and lasts nine candles. Once nine candles (of the same polarity) are in, the setup completes, and the indicator signals a likely reversal for the price.

The direction of such a reversal naturally depends on the type of candles that formed the setup. If these candles were green, the indicator would imply a top for the asset, while red candles would suggest a bottom.

When the setup finishes, the “countdown” phase begins. In this phase, candles of the same type are counted again, except for thirteen. Once the countdown also completes, another potential reversal could be assumed to have occurred for the price.

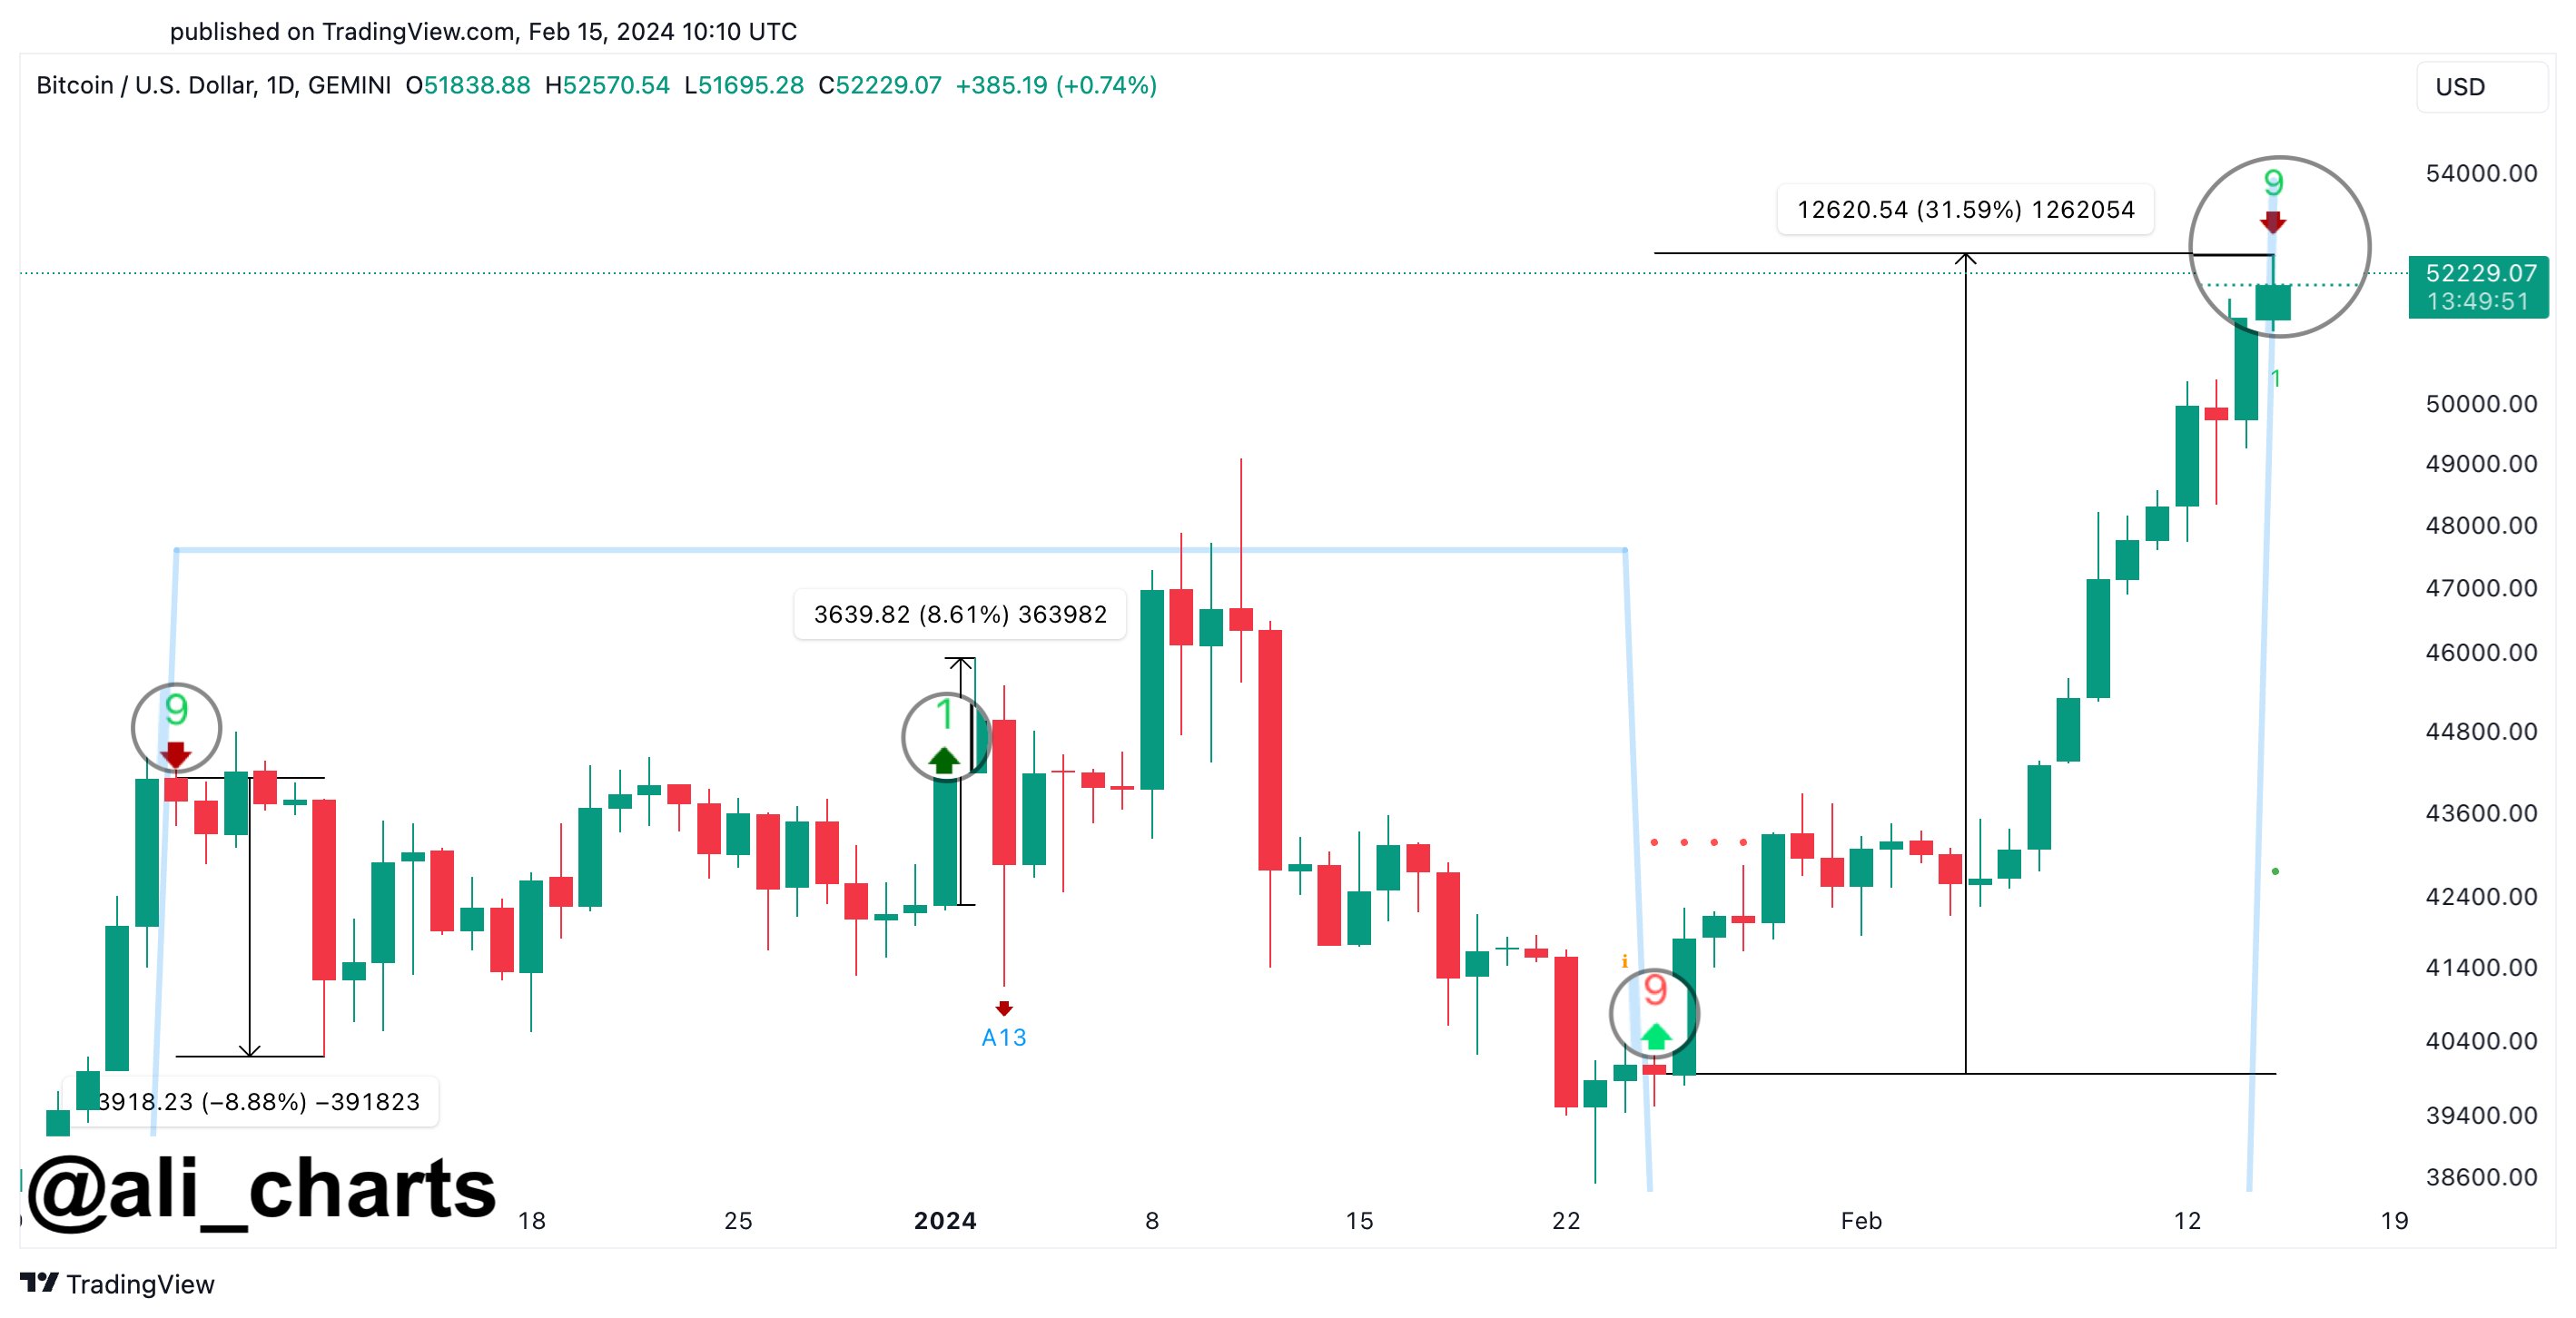
Recently, Bitcoin has finished a TD Sequential phase of the former type. Here is the chart shared by the analyst that shows this pattern forming in the daily price of the cryptocurrency:

Bitcoin Sell Signal

As is visible in the graph, the TD Sequential setup has recently finished with green candles for Bitcoin. These green candles have come for the coin as it has enjoyed some sharp bullish momentum, which has taken its price beyond the $52,000 mark.

The fact that the TD Sequential setup has formed with green candles suggests the indicator may now be providing a sell signal for the cryptocurrency’s price.

In the same chart, Ali highlighted the previous instances since December of last year where a setup was completed for the asset. It would appear that both TD Sequential buy and sell signals have held for the coin in this window.

Going by this pattern, the latest TD Sequential reversal signal might also hold for the asset. And as it’s a bearish one this time, the analyst expects a correction lasting for one to four daily candlesticks.

BTC Price

Bitcoin’s recent momentum has meant that the asset has been among the best performers in the sector, registering growth of around 16% during the past week.

Currently, the coin is hovering around the $52,500 level. The chart below shows the asset’s trajectory over the last month.

Bitcoin Price Chart

Bitcoin Top: This Is When Bull Run Will Peak According To Past Pattern

An analyst has explained when the next Bitcoin bull run peak might appear, if the same pattern as in previous cycles repeats this time as well.

This Is What Previous Bitcoin Cycles Suggest Regarding Bull Run Top

In a new post on X, analyst Ali has discussed about how the last two Bitcoin bull runs line up against each other and what it could mean for the current cycle of the cryptocurrency.

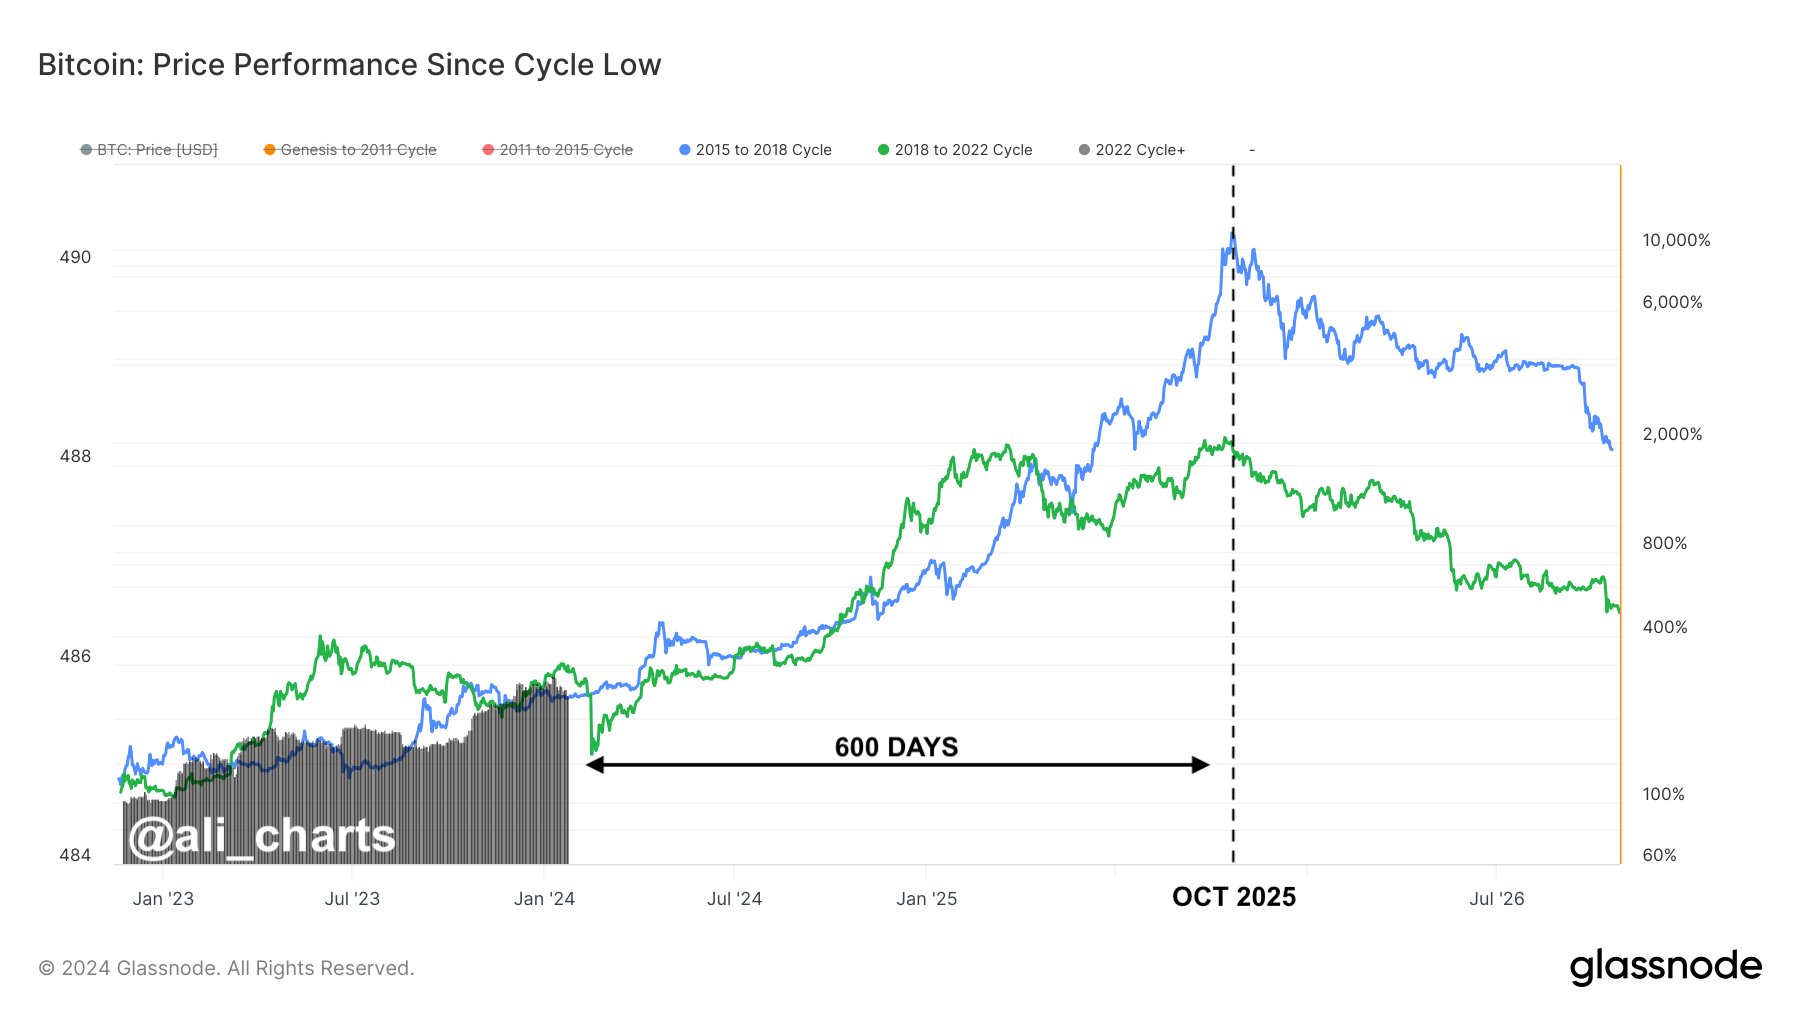
To make the comparison, the analyst has cited a chart that shows the price trend in each of the cycles with the cyclical bottoms being the common start-point for all of them.

Bitcoin Bull Run

From the graph, it’s visible that the peaks of the last two Bitcoin bull runs took shape at roughly the same amount of time since the bottoms of the respective cycles.

For the current cycle, the low that followed the FTX collapse in 2022 has been chosen as the bottom. If the current cycle is lined up against these other two starting from this bottom, then it would still have roughly 600 days before it reaches the same point as when the last couple of bull runs hit their tops.

“If Bitcoin mirrors past bull runs (2015-2018 & 2018-2022) from their respective market bottoms, projections suggest the next market peak could land around October 2025,” says Ali. “This implies BTC still has 600 days of bullish momentum ahead!”

BTC Has Been At Risk Of Slipping Below A Historical Line Recently

While BTC may have a bullish outlook for the long term, its short-term price trend has been painful for investors, as the cryptocurrency has seen a notable drawdown since the spot ETFs found approval from the US SEC.

The cryptocurrency had earlier even slipped down towards the $38,500 mark before making some recovery back around the $40,000 level that it’s still trading around.

Bitcoin Price Chart

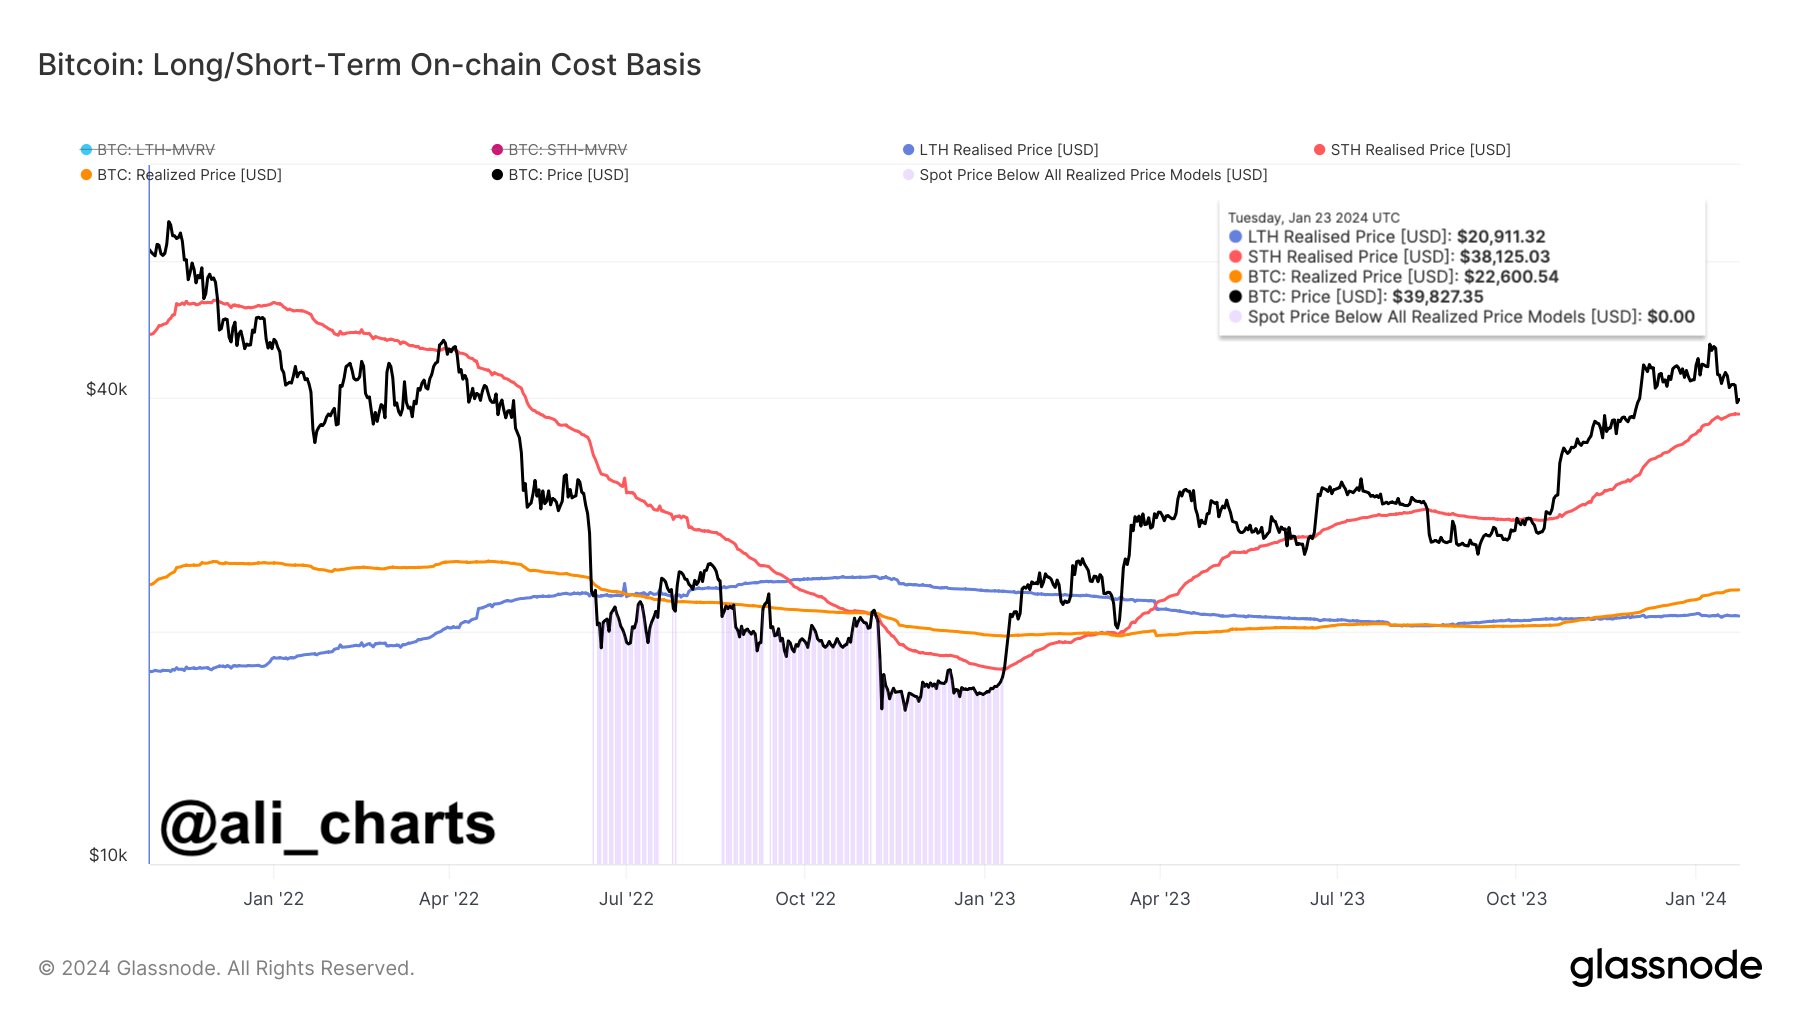
In this latest plunge, Bitcoin came dangerously close to retesting the “short-term holder realized price,” a level that has been significant for the asset throughout history.

The “realized price” is a metric that keeps track of the price at which the average investor in the Bitcoin market acquired their coins. The spot price being above this value naturally implies the average holder in the sector is carrying profits, while it being under the line implies the dominance of losses.

As Ali has pointed out in another X post, the “short-term holder” group will find themselves underwater if the cryptocurrency’s price slips under the $38,130 level.

Bitcoin Short-Term Holder Realized Price

Short-term holders (STHs) refer to the Bitcoin investors who purchased their coins within the last 155 days. At the moment, their realized price stands at the $38,125 level. Historically, a sustained break below this line has often meant an extended stay for the coin below it.

So far, BTC has avoided a retest of this line, but if the current correction continues, it might even slip under it. “This potential BTC dip might trigger a new wave of panic selling as these holders will seek to minimize losses,” explains the analyst.

Is Bitcoin Near Top Yet? What Glassnode’s Price Multiplier Model Says

Glassnode’s model for tracking the “price multiplier” effect for Bitcoin could provide some hints about whether the asset is near the top or not so far.

Bitcoin Is Observing A Multiplier Effect Of 4-5x Right Now

In a new post on X, the lead on-chain analyst at Glassnode, Checkmate, has discussed the “price multiplier” effect of Bitcoin. This effect refers to the fact that the capital that flows into the cryptocurrency is not always (in fact, most of the time) the same as the change reflected in the market cap.

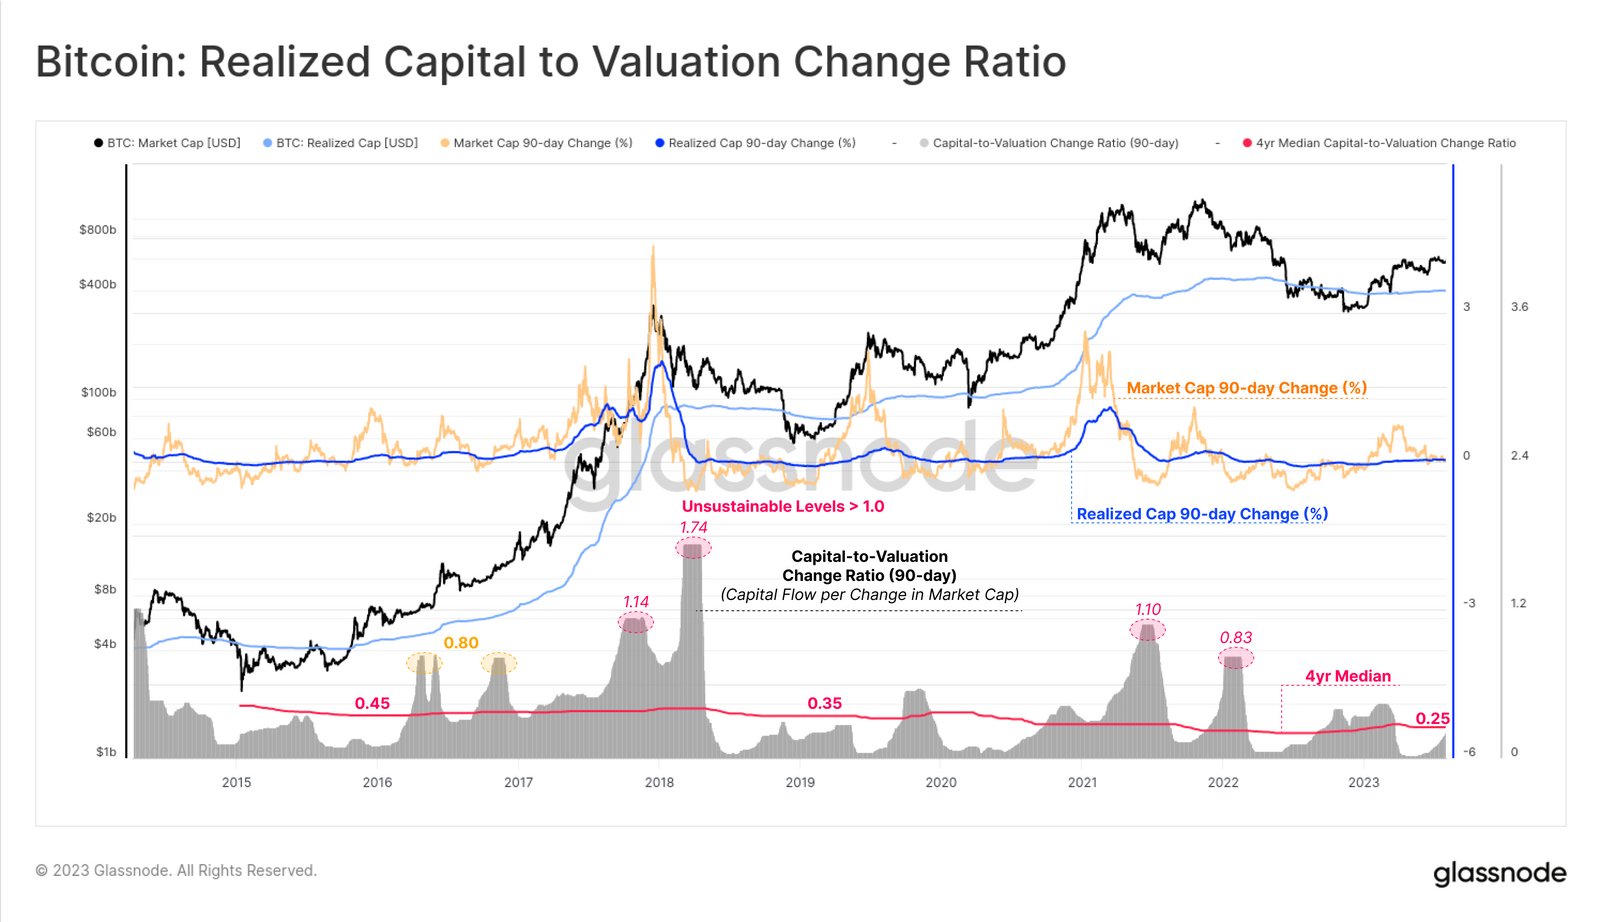
To track the exact ratio between the two, Glassnode has defined the “Realized Capital to Valuation Change Ratio.” This indicator measures how much capital flows into the “Realized Cap” for every unit change in the market cap.

The Realized Cap refers to a capitalization model for Bitcoin that assumes that the real value of each coin in circulation is not the current spot price but the price at the time it was last transferred on the blockchain.

This last transfer could be considered the previous moment the coin changed hands, so the Realized Cap adds up the cost basis or acquisition value of all coins in circulation. Put another way, the Realized Cap is a model that measures the total amount of capital the investors have used to buy Bitcoin.

Now, here is a chart that shows the trend in the BTC Realized Capital to Valuation Change Ratio over the past several years:

Bitcoin Realized Capital To Valuation Change Ratio

The above graph shows that the Bitcoin Realized Capital to Valuation Change Ratio (90-day) has recently been below the 4-year median of 0.25. As Checkmate notes, this model suggests the current multiplier effect of BTC is around 4 to 5 times.

This means that for every $0.20 to $0.25 going into the realized cap, the market cap is moving by $1. From the chart, it’s apparent that the multiplier has generally shot up during bull markets.

“Bull market tops often correspond with $0.80 to over $1.0 in capital inflows needed to achieve a $1 change in the market cap (unsustainable < 1x Multipler),” explains the Glassnode lead.

On the other hand, bear markets “often see heightened volatility with $0.2 in capital flows having a $1.0 impact on MCap (5x Multipler),” according to the analyst.

Suppose this historical pattern is anything to go by. In that case, the current Bitcoin multiplier is still at relatively low values, which would imply the cryptocurrency still has a lot of room to go before a potential top is encountered.

Another curious pattern in the ratio is also visible in the same chart. It appears that the 4-year median has been going down as the years have passed. This would mean that BTC’s market cap has, on average, been becoming easier to shift with time.

BTC Price

In the past day, the Bitcoin spot ETFs were finally cleared by the US SEC, and it would appear that the market has reacted by buying this news, as the price has now breached the $48,000 level.

Bitcoin Price Chart

Bitcoin Whales Driving The Rally Are Now Taking Profits, Data Suggests

Data shows that the Bitcoin whales that may have been helping drive the latest rally have switched to profit-taking instead.

Bitcoin Whales On BitMEX Have Changed Their Tune Recently

An analyst in a CryptoQuant Quicktake post explained that the BitMEX whales were likely the ones helping fuel the latest rally. The relevant indicator here is the “Open Interest,” which keeps track of the total amount of Bitcoin derivative positions open on a centralized exchange.

When this metric’s value increases, investors are opening up new contracts on the platform. On the other hand, a decline suggests the holders are either getting liquidated or closing up their positions of their own volition.

Now, here is a chart that shows the trend in the Bitcoin Open Interest for two exchanges, BitMEX and Binance, over the past few weeks:

Bitcoin BitMEX Whales

The graph shows that the Bitcoin Open Interest on BitMEX had observed a sharp rise at the start of the month when the cryptocurrency’s price was still trading around the $38,000 level.

This open interest increase followed a sharp rally for BTC towards the $44,000 mark. As is visible in the chart, the indicator’s value for Binance also registered an increase as the rally occurred, but BitMEX’s rise stands out as it was huge and pretty much happened in one go before the rally.

Since BTC has hit its local top above the $44,000 level, though, the BitMEX Open Interest has plummeted, implying a large-scale closure of positions on the platform has taken place. On the other hand, the metric’s value for Binance has continued to stay high.

The quant has also attached charts of another metric for the two exchanges: the “Funding Rates.” The funding rates keep track of the periodic fee the derivative traders on an exchange currently pay each other.

When this indicator has a positive value, the longs are paying a premium to the shorts to hold onto their positions right now. This suggests that the traders on the platform share a majority of bullish sentiment.

The BitMEX Funding Rates had been favorable for the duration that the Open Interest had been at high levels, implying that most positions had been extended. However, with the plunge in the indicator, the Funding Rates have returned to neutral values.

Based on this pattern, the analyst thinks the BitMEX whales, potentially driving the rally earlier, have already taken their profits, as they closed up a large chunk of their positions near the top.

The Open Interest hasn’t completely retraced itself yet, but the fact that most of these whales have decided to pull out may be a troubling sign for the rally’s continuation.

BTC Price

Bitcoin has seen some retrace during the past day as the coin’s price is now floating around $43,600.

Bitcoin Price Chart

Is Bitcoin Top Here? This Metric Would Say Otherwise

The Bitcoin MVRV ratio, an on-chain indicator, could suggest the asset may not have hit its top for the current rally just yet.

Bitcoin MVRV Ratio Says Market Isn’t Overheated Right Now

According to data from the market intelligence platform IntoTheBlock, past bull markets hit their peaks when the MVRV ratio crossed the 300% mark. The “Market Value to Realized Value (MVRV) ratio” refers to an indicator that keeps track of the ratio between the Bitcoin market cap and realized cap.

The “realized cap” here is a capitalization model for BTC that calculates the total value of the cryptocurrency by assuming that each coin in circulation is worth the same as the price at which it was last moved, rather than the current spot price.

As the price at which a coin was last moved on the blockchain was likely the price at which it changed hands, the realized cap can be interpreted as the total amount of capital that the investors as a whole have put into the asset.

The MVRV ratio compares the price of the coin (the market cap) with the realized cap, so it can tell us whether the investors are holding more or less than they put in.

Now, here is a chart that shows the trend in the Bitcoin MVRV ratio over the last few years:

Bitcoin MVRV Ratio

In the above graph, the Bitcoin MVRV ratio is shown as a percentage. At the 100% mark, the two capitalization models approach a equal value, suggesting that the market as a whole is just breaking-even.

Above this threshold, the investors are holding a net amount of profit, while below they are carrying loss. From the chart, it’s visible that the BTC MVRV ratio has remained above the break-even in recent months as the asset’s price has observed a rally.

At present, the metric is floating about the 150% level, suggesting that the market cap is 50% more than the realized cap. Historically, the larger the investors’ profits have gotten, the more likely they have become to take part in a selloff.

Because of this reason, tops have generally formed when the MVRV ratio has hit high levels. IntoTheBlock notes, however, that the bull markets in the past have usually only hit their peaks when the indicator has crossed the 300% mark.

Clearly, the indicator is still a significant distance away from this mark at the moment. This could be a potential sign that the Bitcoin rally hasn’t reached a state of overheat yet and thus, there might be more to come for the cryptocurrency’s price in terms of bullish momentum.

BTC Price

The Bitcoin rally has hit the pause button in the past week as the asset’s price has taken to sideways movement. Currently, the coin is trading around the $34,500 mark.

Bitcoin Price Chart

Has Bitcoin Rally Already Hit Top? Here’s What Puell Multiple Says

On-chain data shows the Bitcoin Puell Multiple has hit pretty high levels recently. Here’s what this may mean for the current rally.

Bitcoin Puell Multiple Has Risen To High Levels In Recent Days

As pointed out by an analyst in a CryptoQuant post, the Puell Multiple is currently at even higher levels than those seen during the 2021 bull run top. The “Puell Multiple” is an indicator that measures the ratio between the daily revenue of the Bitcoin miners and the 365-day average value of the same.

The mining revenue here is calculated by multiplying the spot price by the total number of coins that the miners are issuing (that is, receiving their block rewards) every day.

This metric tries to judge whether the current price of the cryptocurrency is fair or not by comparing the current revenue of the miners against the yearly average.

When this metric has a value above 1, it means the miners are making higher revenues than the average for the past year right now. The asset’s value may be said to be overpriced during such times as the miners gain more motive to sell the more profits they are making.

On the other hand, values of the indicator below 1 imply these chain validators are making less than the norm currently. The lower the indicator’s value goes, the more trouble the miners may have in supporting their operations. Thus, the coin could be assumed to be undervalued during such conditions.

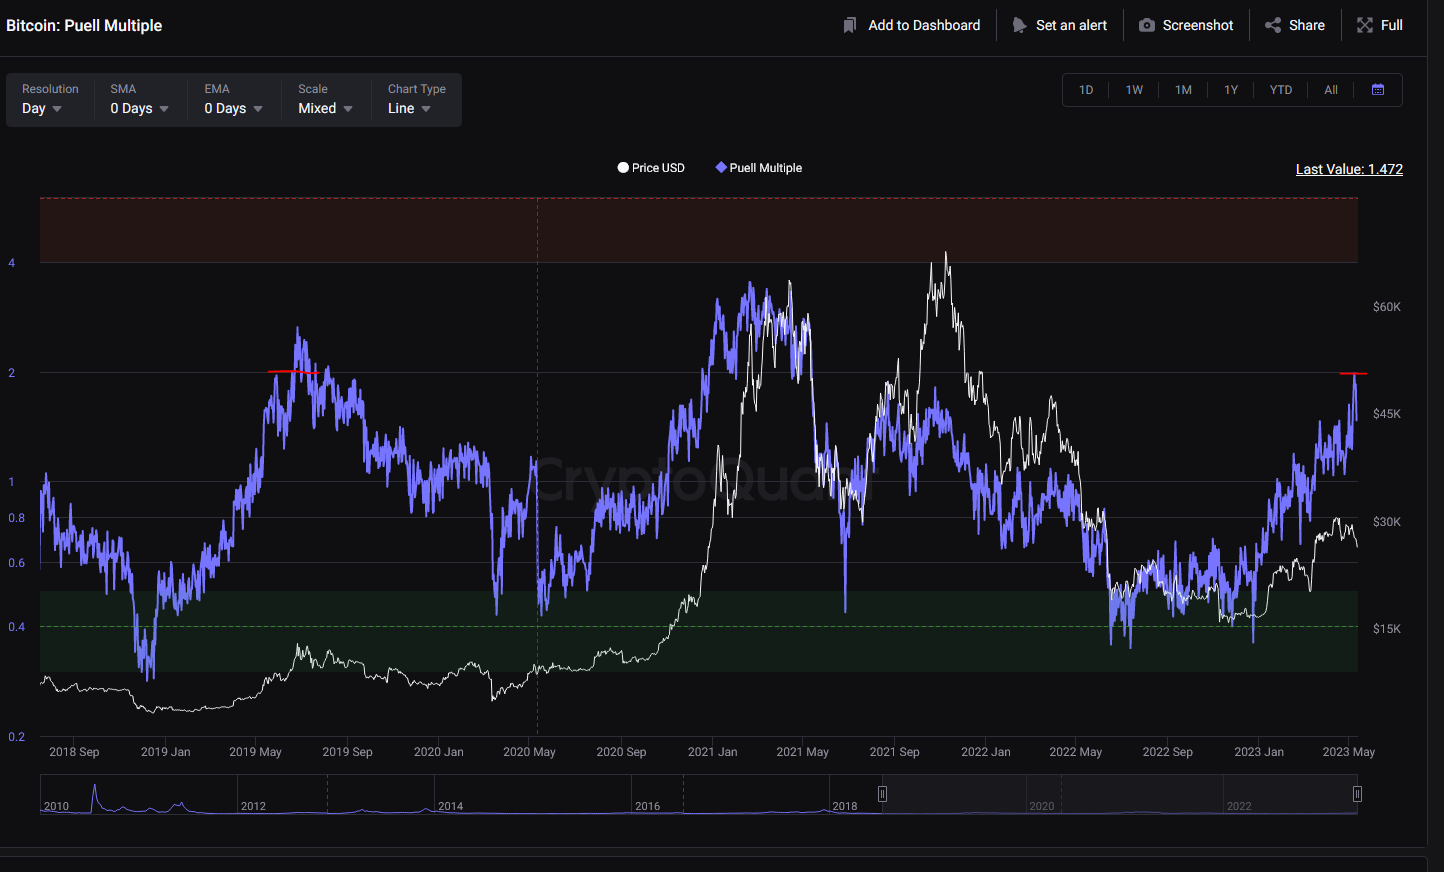
Now, here is a chart that shows the trend in the Bitcoin Puell Multiple over the last few years:

Bitcoin Puell Multiple

Historically, major bottoms in the cryptocurrency’s price have formed whenever the Puell Multiple has dipped below the 0.5 mark. Below this value, miners’ daily revenues are less than 50% of the yearly average, meaning that this cohort comes under some intense pressure inside this zone.

Tops, however, haven’t been so simple; the value at which they occur seems to have been decreasing with each Bitcoin bull run. But in general, they have naturally occurred at values significantly above the 1 mark (that is, during periods when the miners are raking in large amounts of revenues).

During the last couple of months, the Puell Multiple has once again been above the 1 level, and recently, it has observed a further surge towards a value of 2. This value is interestingly even higher than what was observed during the November 2021 all-time high price, but not near the levels of the first half of 2021 top.

The current levels of the metric are also only slightly lesser than what the April 2019 rally, a rally that bears many similarities with the current one, saw during its top.

Obviously, it’s hard to say anything about the top based on these observations alone, as tops have historically not followed any set pattern of the indicator, unlike the bottoms. However, the current values still likely imply that the price has become quite overheated recently, which may mean that even if a top isn’t in yet, it may be close nonetheless.

BTC Price

At the time of writing, Bitcoin is trading around $27,300, down 2% in the last week.

Bitcoin Price Chart

Bitcoin Rally May Not Have Hit Top Yet, Here’s Why

The historical pattern in this Bitcoin on-chain indicator may suggest that the ongoing rally hasn’t reached its top yet.

Bitcoin 1-Year Inactive Supply Has Continued To Go Up Recently

According to a post from the on-chain analytics firm CryptoQuant, the 1-year inactive supply hit a high back in March of this year. The “1-year inactive supply” is an indicator that measures the total percentage of the Bitcoin supply that hasn’t moved on the blockchain since at least one year ago.

This supply belongs to one of the two major cohorts in the BTC market: the “long-term holders” (LTHs). This group includes all investors who bought their coins more than six months ago, so the 1-year inactive supply metric doesn’t measure their entire supply, only a segment of it (although a rather large one).

The LTHs hold a special place in the Bitcoin economy as they comprise the most resolute investors in the market. The selling and buying behavior of this cohort can, therefore, have long-term implications for the sector.

Here is a chart that shows how the 1-year inactive BTC supply has changed over the lifetime of the cryptocurrency and how it has seemingly taken its place in the different price cycles:

Bitcoin 1-Year Inactive Supply

As the above graph shows, the Bitcoin 1-year inactive supply has historically trended up during the bear markets. This means these investors generally participate in accumulation in the leadup to and during the bear markets.

The LTHs then continue to hold onto their filled-up bags and expand as they transition toward a bullish period. These investors show this behavior throughout the bull market buildup phase; when the rally starts reaching its last stages, these holders start selling to take their profits.

This pattern has repeated throughout the different cycles, showing that the LTHs’ behavior hasn’t changed too much. However, one thing that differs between the cycles is that their supply has been going up overall. This would partly be attributed to all the Bitcoin that has been getting lost due to wallet keys becoming inaccessible.

The percentage of the circulating supply held by this Bitcoin investor segment hit an all-time high just back in March of this year, reaching a value north of 67%. These investors have shed some coins since then, but the difference in their supplies between then and now is negligible (13.1 million BTC vs. 13 million BTC).

The April 2019 rally, which resembles the current one, also saw the LTHs holding tight until midway through the rally, when they started selling, and the cryptocurrency reached the top just a while later.

Suppose the Bitcoin price and the 1-year inactive supply will follow the same pattern in this current rally as during all these past bullish periods. In that case, it seems likely that the top hasn’t been hit since the LTHs haven’t started participating in any significant distribution yet.

BTC Price

At the time of writing, Bitcoin is trading around $28,300, down 4% in the last week.

Bitcoin Price Chart

Twin Peaks: Comparing The Two 2021 Bitcoin Tops

Speculation has been going on in the crypto community as to whether the $69k Bitcoin top was the peak of this bull run. Here’s a comparison between some indicators to see how this top compares with the $65k April peak.

Comparing the Metrics Between The Nov 10th And April 14th Peaks

As per the latest weekly report from Arcane Research, most of the sentiment measuring metrics highlight the differences between the two tops.

The first relevant metric is the futures open interest indicator, which shows the total amount of Bitcoin involved in futures contracts at the end of a trading day.

Here is how its chart compares between the April and November peaks:

Looks like April 14th top had decently more open interest

As you can see above, the April peak had almost 50k BTC more in open interest. This means that there was much more excess leverage in the market back then.

Related Reading | Brace For More Downtrend: 15% Of Bitcoin Supply Is Now In Loss

Below is another chart that compares the unregulated futures basis between the two tops. “Basis” is basically the difference between Bitcoin’s price and the futures price.

Average 3-month annualized basis in the unregulated futures market

The unregulated futures market basis reached almost 50% on April 14th while it was only 17% during November 10th.

The basis gap between the unregulated market and CME was also higher for the former top, and so was the Korean premium. The funding rates, as well, showed substantially higher values for the period.

Nov 10th recorded relatively less overheated indicators

What these metrics show is that the futures froth was clearly more pronounced during the April top, and that the market was more overextended.

Two other indicators, however, had higher values for Nov 10th. The first of these was the fear and greed index, a metric that measures how fearful or greedy the market is.

Related Reading | TA: Ethereum Show Positive Signs, Why ETH Could Outperform Bitcoin

The other was the global open interest share of Bybit and Binance. Here are how these indicators looked like for the two periods:

The metrics where Nov 10th lead April 14th

In conclusion the $69k Nov top has some clear differences from the $65k April peak. So it’s possible this might not be the bull run peak just yet. Some other on-chain indicators also back the idea.

Bitcoin Price

At the time of writing, Bitcoin’s price floats around $56.5k, down 6% in the last seven days. Over the past month, the coin has lost 10% in value.

Here is a chart that shows the trend in the price of the coin over the past five days:

BTC’s price continues to tumble down | Source: BTCUSD on TradingView
Featured image from Unsplash.com, charts from TradingView.com, Arcane Research

Shakeout Or Top? Here’s What Bitcoin SOPR Says About It

Bitcoin price has now declined to $56k; does that mean a top is in? Or is this just a shakeout? Here’s what the SOPR indicator says about it.

The Bitcoin SOPR Indicator

The BTC Spent Output Profit Ratio (or SOPR in short) is an on-chain indicator that estimates whether investors are selling at a profit or a loss.

When the metric’s value is above one, it means coins that were moved during the period were sold, on an average, at a profit.

While SOPR values less than one imply the overall market has been selling at a loss during the particular timescale.

If the indicator starts trending up, it could mean holders are now realizing their profits and a correction could soon be coming.

On the other hand, a downwards trend implies sellers are moving their coins at a loss, and holders with profitable coins may be sitting on to them in hopes of further price appreciation.

Related Reading | Bitcoin MVRV Shows Top Isn’t In Yet, BTC Still Has Room To Grow

What Does The Indicator Tell Us About Tops And Shakeouts?

An analyst has created a chart in a CryptoQuant post that highlights the trend in the value of the indictor over the past year and a half.

The trend of the SOPR during the early 2021 run versus now | Source: CryptoQuant

As you can see, above are the graphs for a few different versions of the indicator. The STH SOPR and LTH SOPR metrics show whether short-term and long-term holders, respectively, are taking profits or not.

The separation between the two types of holders is done on the basis of coin age. Coins that haven’t been moved since 155 days fall into the LTH category. Anything below that is in the STH territory.

Now, looking at the above chart, it seems like all the Bitcoin SOPR metrics had high values when the early 2021 top formed.

Related Reading | Inflation fears sparks Bitcoin rally before Taproot – Crypto Roundup, Nov 15, 2021

But before the run started, there was a period where the STH SOPR shot up and the other indicators also increased in value. However, there was no top formation here as it was only a pre-bull run shakeout.

A trend similar to that seems to be visible in the current time period. The STH SOPR is high right now, but long-term holders don’t seem to be realizing that much profits.

This fact makes the analyst believe that the latest decline in Bitcoin’s price was possibly just a shakeout, and not a top formation.

Here is a chart that shows the current trend in BTC’s price:

BTC’s price continues to plunge down | Source: BTCUSD on TradingView
Featured image from Unsplash.com, charts from TradingView.com, CryptoQuant.com