
Runes continues to make up the vast majority of Bitcoin transactions, however the fees earned by Bitcoin miners from Runes has slightly tailed off since the record-setting halving day.
Cryptocurrency Financial News
Runes continues to make up the vast majority of Bitcoin transactions, however the fees earned by Bitcoin miners from Runes has slightly tailed off since the record-setting halving day.
Higher fees are also boosting bottom lines for the industry’s beleaguered miners, 21Shares noted.

The founder of Digital Bitcoin Art and Assets (DIBA) believes smart contracts on Bitcoin could solve the myriad problems created by Ordinals.
Data shows that Bitcoin active addresses have sharply dropped despite the high transaction demand; here’s why this may be happening.
According to the latest weekly report from Glassnode, the active addresses are around cyclical lows of 566,000. The “active addresses” metric measures the daily number of unique Bitcoin addresses participating in some transaction activity on the blockchain.
By “unique,” what’s meant here is that the indicator only checks whether an address has been involved in a transfer at least once. This implies that regardless of how many transactions an address might make, its contribution to the active addresses metric will remain just one unit.
This restriction exists because the number of unique addresses can serve as an analog to the number of unique users visiting the blockchain, thus providing an estimate for the daily users on the network.
Another indicator that’s made for tracking activity on the Bitcoin blockchain is the “transaction count,” which, as its name already suggests, tells us about the daily total number of transfers taking place on the network.
When this metric has a high value, it naturally means that many transactions occur on the blockchain. Such indicator values imply a high demand for using the network currently, but the metric can’t say anything about how the activity is distributed; that’s where the active addresses indicator comes in.
Now, here is a chart that shows the trend in the Bitcoin transaction count (as well as its 30-day and 365-day simple moving averages) over the entire history of the asset:
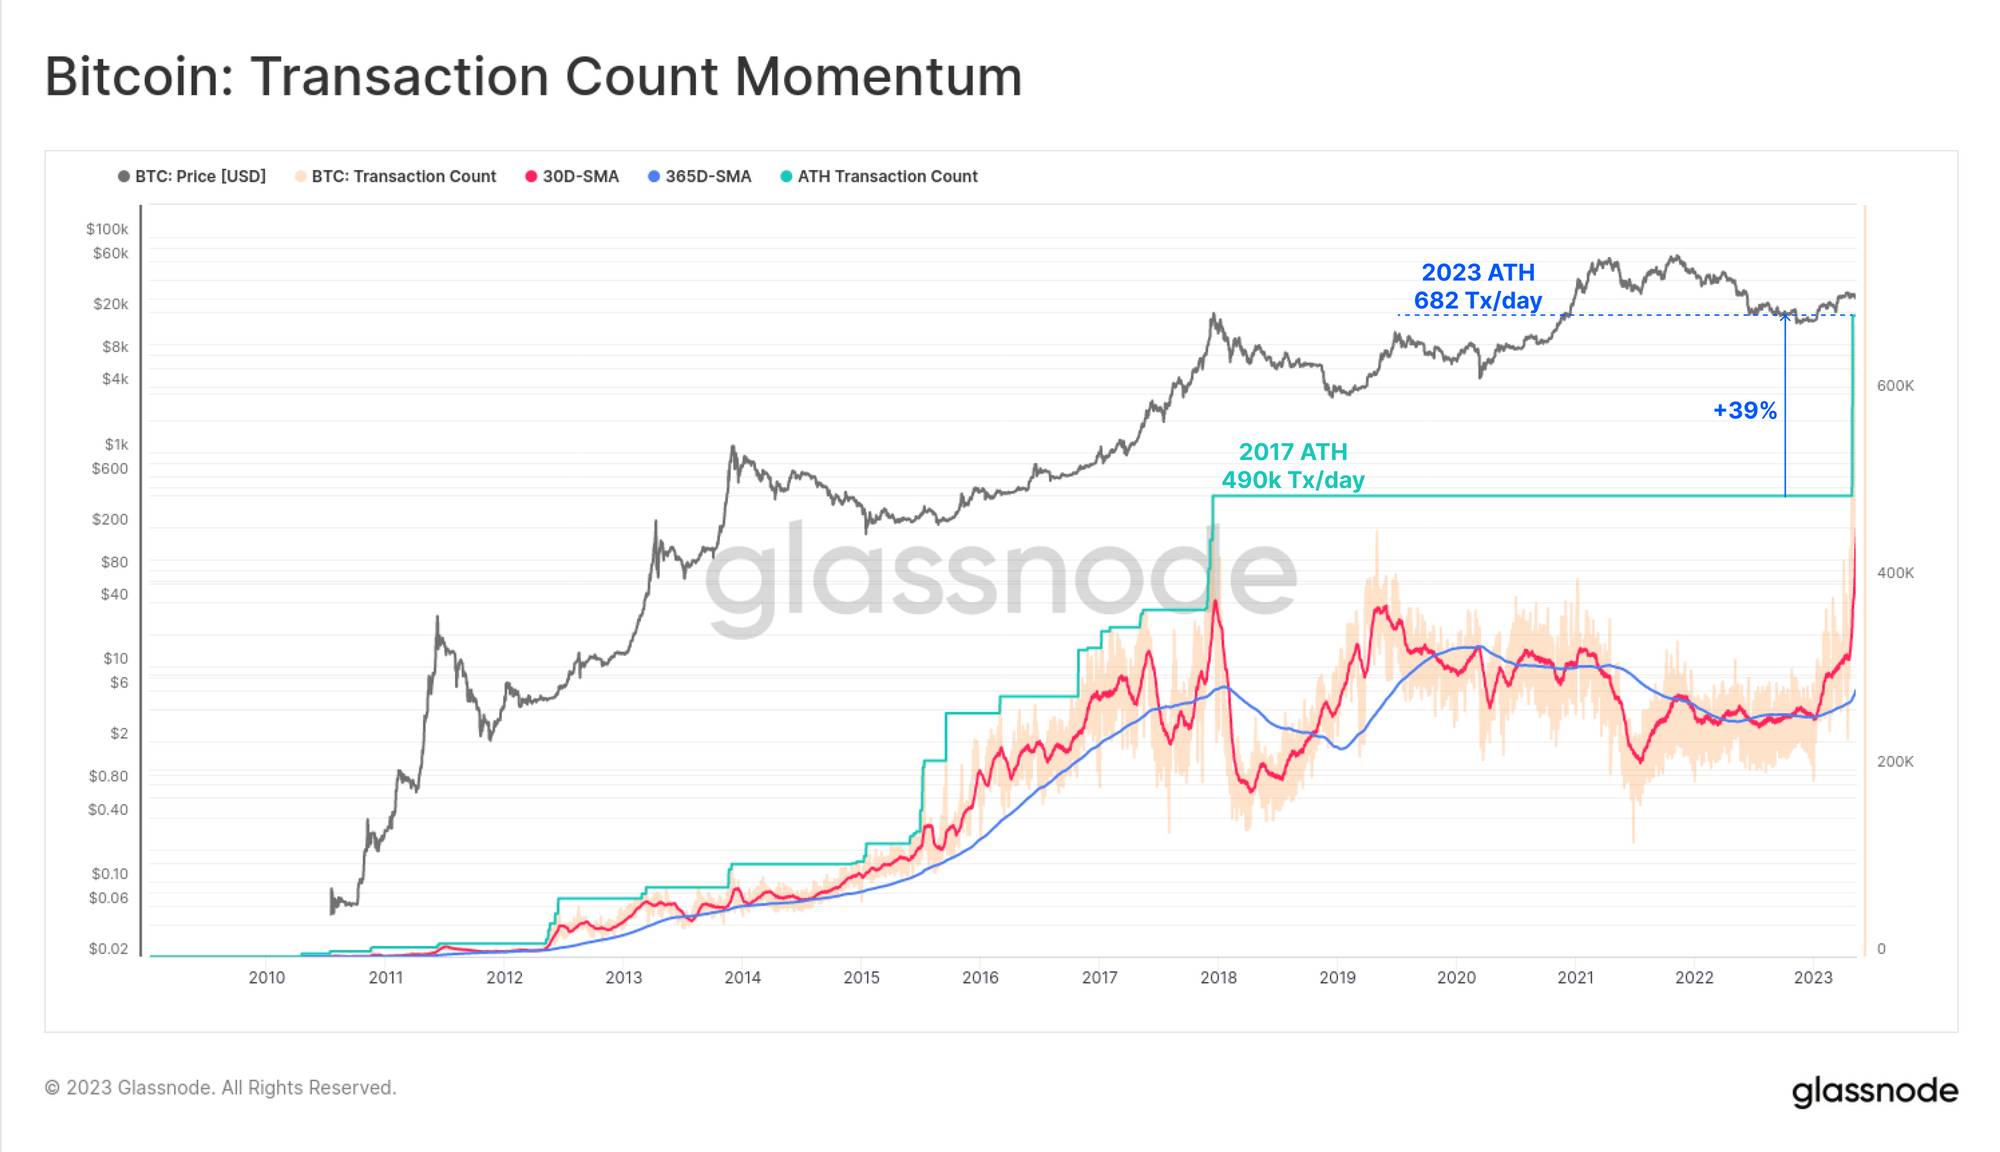
As displayed in the above graph, the Bitcoin transaction count has recently seen a rapid rise and has hit a new all-time high of about 682,000 daily transfers.
The reason behind this explosion in the transaction count is the emergence of the BRC-20 tokens, fungible tokens created on the BTC blockchain using the Ordinals protocol (a way to inscribe data like text and images directly into the chain).
These BRC-20 tokens have started a new memecoin mania, with PEPE being the largest example of such a coin. The insanely fast popularity of these tokens has meant that the demand for transacting on the network is more than ever before.
What about the active addresses, though? Is this indicator also seeing a rise?
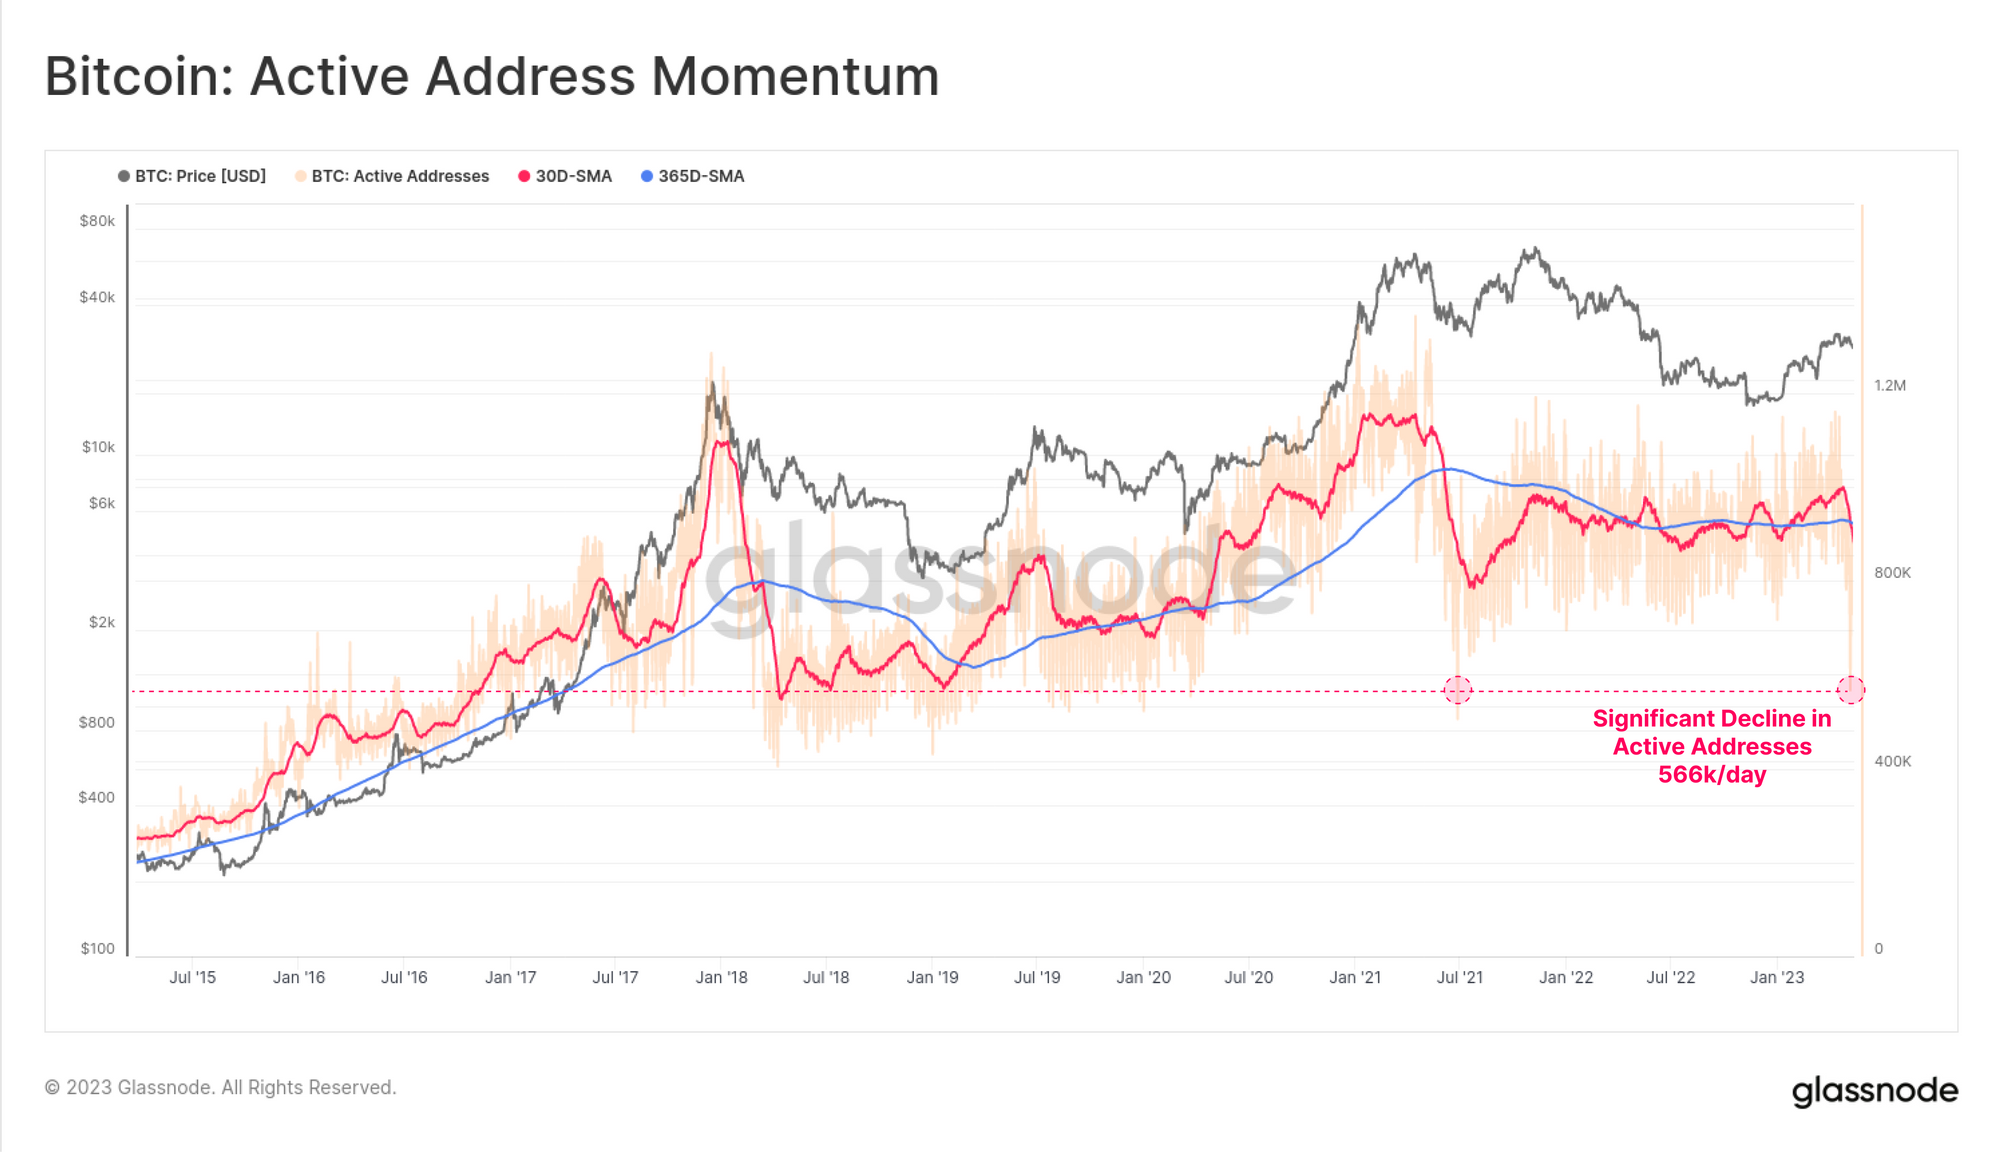
From the chart, it’s apparent that the active addresses observed a rise at first, but then it plunged to a value of 566,000 addresses per day, around the current cyclical low.
This would mean that while the demand for making transactions is super high right now, the demand isn’t actually coming from a large number of users but a rather small number of them who are constantly making repeat transfers.
“This is a curious scenario, whereby many BRC-20 users appear to have re-used their Bitcoin addresses,” explains Glassnode. “Perhaps due to having more familiarity with how account-based chains like Ethereum or Solana operate, and less so with the Bitcoin UTXO system.”
At the time of writing, Bitcoin is trading around $27,400, down 1% in the last week.
In a day when Bitcoin prices are crashing, posting worrying drops from April 2023 peaks, the underlying network is processing record transactions.
Dune Analytics data on May 1 shows that the platform is processing record transactions which, if going by historical performance, would typically point to demand. In a normal scenario, this demand could translate to buying pressure.
However, as seen in the chart below, the spike in the activity on the Bitcoin network is attributed to the non-fungible token (NFT) collection “Ordinals.” The demand for these assets has interfered with the normal on-chain dynamics.
We can see a shift in preference as it relates to inscription types.
Image Inscriptions
dominated until very recently, but have been surpassed by text based
.
Over 2.39M Inscriptions have been added to the #Bitcoin ledger, adding 9.3GB in data, and paying 212 $BTC in fees. pic.twitter.com/KZPy074WoP
— glassnode (@glassnode) April 30, 2023
In that sense, despite the high block demand, BTC prices are down 4% in the past 24 hours, crashing 10% from April 2023 peaks, and are likely to clear critical support levels immediately. Notably, sellers have quickly reversed the gains of April 27.
While Bitcoin prices remain under pressure when writing, the coin is within a broader trade range. Key reaction points remain at $31,000 on the upper hand, a level flashing with April 2023 peaks, and $26.5k on the lower end, a support level marking the 38.2% Fibonacci retracement level of the March to April trade range.
Moreover, from mid-March 2023, BTC rallied approximately 60%, floating higher as the financial markets feared another meltdown in the United States banking sector. Silicon Valley Bank (SVB) experienced a bank run in March while two more crypto-centric banks, including Signature Bank, closed shop.
Bitcoin prices are now cooling off, looking at the performance in the daily chart. This is despite positive news based on blockchain activity.
According to Dune Analytics, the Bitcoin network has processed more transactions than any other day since launching 14 years ago.
On May 1, on-chain data showed that the platform processed 568,300 transactions, 78,000 more than it processed at the peaks of the 2017 Bull Run.
Even though activity has exploded, an analysis of the chunk of transactions processed revealed that over 50%, or 307,000, were inscriptions from Bitcoin Ordinals.
Dune data shows that the number of inscriptions is up 16% from April 29 and maintains an upward trend pointing to increasing user demand. The Bitcoin Ordinals allow users to attach or “inscribe” files on the Bitcoin network, including apps, videos, audio, images, texts, and more.
These files are unique, “inscribed” at the Satoshi level, and permanently stored on Bitcoin blocks. The more files inscribed, the more transactions there are, explaining the “spike” in the number of on-chain transactions processed in recent days.
As of May 1, over 2.9 million files were attached to the Bitcoin network, with the number of average inscriptions rising from less than 10,000 in early February to over 300,000 in early May 2023.
As mentioned above, the rapid rise of “inscriptions” doesn’t necessarily translate to demand for BTC. The underlying network is a transactional layer, enabling the transfer of funds. It is not meant for storing files, a development that could dent the appeal of the most valuable blockchain and slow down BTC demand leading to a permanent spike in its transaction levels.

Democratic Representative Bill Foster has called for legal power to identify wallet holders and reverse crypto transactions in instances of criminal behavior such as ransomware attacks.
Recording bitcoin transactions on a blockchain is fundamentally “more accurate” than using a blockchain for, say, birth certificates.
The cost of doing transactions on bitcoin is surging at a time the network is suffering its worst congestion in nearly three years.
LND now supports Lightning Network wumbo channels. These channels have the capacity to hold more funds, and users can send larger bitcoin transactions.
When dust settles in your home, you sweep it up. But what happens when dust makes its way into your Bitcoin wallet? Cleaning it up may not be so simple.
When dust settles in your home, you sweep it up. But what happens when dust makes its way into your Bitcoin wallet? Cleaning it up may not be so simple.

Crypto exchange Coinbase has deployed a system aimed to automatically reduce delays in bitcoin payments arising from transaction fee volatility.


