Will Bitcoin Price Crash Similarly To 2019 And 2020?

Bitcoin price has mostly maintained the $29,000 level for the better part of the week. This points to low activity and momentum in the market, as well as a reluctance to engage in the digital asset at this point. One reason for this reluctance is the expectation that the Bitcoin price will see another crash before the bull market resumes. However, this crypto analyst explains why expectations may be dashed this time around.

Bitcoin Price May Not See A Repeat Of 2019-2020

Before the 2020-2021 bull market kicked in, the Bitcoin price had seen a rollercoaster year. Mostly, the bear market had ravaged the digital asset causing it to fall more than 80% below its all-time high price at the time, and the crashes would continue well into 2020.

Given the tendency of the Bitcoin price to follow previous trends, investors are understandably expecting a repeat of this trend. But pseudonymous crypto analyst “Tony The Bull” took to X (formerly Twitter) to use the ‘recency bias’ to explain why this may not happen.

In the post, the crypto analyst used an analogy of a town that had not had a flood before, suddenly experiencing a flash storm rainstorm. Given that it had not happened before, businesses were caught unaware without flood insurance. However, going forward, the businesses begin to expect another flood and as such, they get flood insurance.

The analyst explained that even though measures would be put in place to decrease the chances of such as flood happening again, people continued to operate with the knowledge of the impact of the flood. “It is the brain’s way to going with the most easily accessible information, which is the one that has most recently impacted you in a significant way,” the analyst said. “This is what’s called recency bias.”

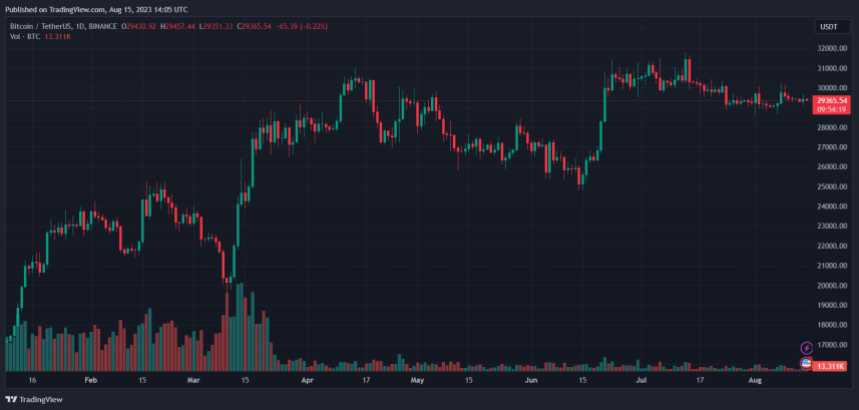
Bitcoin (BTC) price chart from Tradingview.com

This recency bias, when applied to Bitcoin, shows investors are expecting a repeat of 2019-2020 because it is the most recent bear market. Hence, investors are operating with the knowledge of the most recent impactful event.

“But much like the flood never happened before, we had a once in a lifetime pandemic. The probability is rather low we’ll see the same price action as 2019 and 2020,” Tony The Bull explains.

BTC Price Sticking To Previous Trends?

The analyst’s position is backed up by the fact that the Bitcoin price has continuously deviated from historical trends during this cycle. One example is that while the digital asset’s price did fall to around 70% below its $69,000 all-time high, it recovered to almost 50% below its ATH.

However, a similar trend was recorded in 2019 when BTC’s price recovered above $11,000 toward the middle of the year. But by the end of the year, had lost about half of those gains. With the rest of the gains being wiped out in early 2020.

If BTC does end up following the previously established trend though, then the digital asset’s price could fall as low as $12,000 before the next bull run begins. However, it is now a waiting game to see what ends up happening.
Renowned Finance Author Says Bitcoin Price Will Reach $1 Million If This Happens

Bitcoin’s creator, Satoshi Nakamoto, created Bitcoin in response to the 2008 financial crisis as an alternative to government-controlled money. Since then, Bitcoin has gone to spearhead the crypto industry, with many investors calling it digital gold. Now, renowned finance author Robert Kiyosaki has argued that Bitcoin price could reach $100,000 soon and go as high as $1 million.

Bold Prediction On Bitcoin

Robert Kiyosaki, best known for his bestselling book ‘Rich Dad Poor Dad,’ is known to make very bullish predictions on the price of Bitcoin. In a recent post on social media platform X, formerly known as Twitter, Kiyosaki tweeted of Bitcoin reaching 100,000 soon, calling it the “people’s gold.” However, a stock and bond market crash could see Bitcoin reach $1 million.

Kiyosaki also shared his predictions on gold and silver, calling them “GOD’S money.” According to the finance educator, gold and silver can reach $75,000 and $60,000 respectively if the world economy crashes. 

He explained that if the economy collapsed, the value of government-issued currencies would drop drastically. As people lose faith in fiat money, many would turn to Bitcoin and precious metals as an alternative store of value. The increased demand, coupled with the limited supply of Bitcoin, would cause the price to skyrocket.

Earlier this year, Kiyosaki made a similar claim regarding Bitcoin, touting a price of $500,000 for each Bitcoin by 2025. Michael Saylor, another big name in the finance sector, predicted a similar price of $1 million for BTC in the next few years.

What Is The Basis For The $1 Million Bitcoin Price Prediction?

Kiyosaki’s recent predictions about the US dollar, in particular, have come on the heels of the BRICS alliance, which is now gaining traction. BRICS, which is an alliance between the emerging economies of Brazil, Russia, India, China, and South Africa, has gained ground in its campaign to support the reduction of transactions in the US dollar and the promotion of trading and settlement in local currencies. 

As a result, many names in finance have seen this as a plan to de-dollarize trades in the BRICS countries, with reports of Saudi Arabia and possibly Mexico and Japan joining them. Reports are also that the BRICS alliance is working on creating a new currency backed by gold to settle global trades. 

According to Kiyosaki, the only saving grace for everyday investors is to get into real gold, silver, and Bitcoin as stores of value. “SAVERS of FAKE US $ F’d,” Kiyosaki tweeted.

Bitcoin price chart from Tradingview.com

This Event Causes Bitcoin Traders’ Sentiment To Rise, Will BTC Surpass $30,000?

The Bitcoin price continues to compress around its current levels, but during today’s trading session, there was an uptick in volatility. The rise in this metric could hint at a shift in the narratives influencing BTC’s price action.

As of this writing, Bitcoin trades at $29,300 with sideways movement in the last 24 hours. In the previous seven days, the cryptocurrency saw similar action pushing other assets in a similar direction or no direction as the sector flatlines in the short term.

Bitcoin price BTC BTCUSDT

Bitcoin ETF Becomes Dominant Narrative In Crypto Market?

In a recent market update, crypto analysis firm Blofin pointed to an uptick in market sentiment. Coupled with a rise in volatility, market participants are reacting to the potential announcement from the US Securities Exchange Commission (SEC) around a spot Bitcoin ETF.

The Commission is set to rule on asset manager Grayscale’s petition to transform their Grayscale Bitcoin Trust (GBTC) into an ETF. The decision was supposed to come out today, Blofin stated, but it could drag on until this Friday, August 18th.

If the SEC postpones the decision for any reason, as it did with Ark’s petition, the market will likely keep moving sideways. In that sense, development around the ETF decision is gaining strength over macroeconomic dynamics.

This change in dynamics is more evident in the derivatives sector, with options traders becoming more bullish for the coming months. Blofin noted the following on this dynamic:

(…) The news above (on the Bitcoin ETF approval) has promoted the rapid rise of short-term bullish sentiment and uncertainty in the market (…). It appears that investors are waiting for good news related to the spot Bitcoin ETF.

And “smart” traders are positioning accordingly. The report notes that the open interest for options contracts is skewed to the call (buy) side.

As data from the derivatives platform Deribit shows, traders are betting that the price of Bitcoin will rise above $30,000 by the end of August or September. As seen on the chart below, 57,000 contracts will expire by the end of this month and 90,700 next month.

Bitcoin price BTC BTCUSDT Chart OI

Coupled with the rise in Open Interest skewed to the call side, the chart above shows that traders are betting on a Bitcoin rally above $30,000 to $40,000. The spot BTC ETF decision will move the market, particularly at the end of August and September.

Cover image from Unsplash, chart from Tradingview

The Subtle Signs A Bullish Bitcoin Trend Is Brewing

Bitcoin price remains stagnant for going on months now, with no clear trend developing and volatility in a downward spiral. However, some subtle signs are popping up that could suggest that a bullish Bitcoin trend is beginning to take shape.

Make Friends With Strong Trends

“The trend is your friend” is one of the most famous trading quotes, highlighting how capturing as much of the prevailing trend as possible can lead to the most profitable results.

For this reason, in technical analysis, trend-following tools are among the most successful. But what is an investor or trader to do when there is a clear absence of any discernible trend?

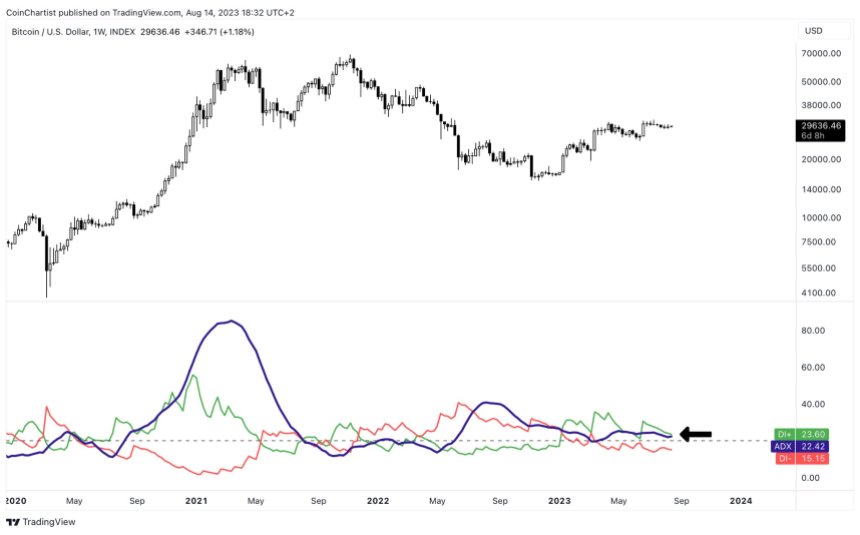
The answer is “to wait for the trend to appear” but that’s easier said than done. This is why specific tools have been created to tell when assets like Bitcoin or even stocks are trending or not. One such tool is starting to rise after several weeks of sideways price action, and it suggest that the underlying trend is strengthening.

bitcoin adx

Bullish Bitcoin Is Building Muscle

The Average Directional Index (ADX) is a trend strength measuring tool, created by the father of technical indicators, J. Welles, Wilder, Jr. Other tools Wilder built include the Parabolic SAR, Average True Range, and the Relative Strength Index.

A reading above 20 on the ADX means a trend is developing. The more it turns up, the stronger the trend. After weeks of sideways, the trend is starting to strengthen again.

The tool also includes two Directional Movement indicators, the DI+ and DI-. The DI+ is currently above the DI-, showing that bulls in control of the underlying price action. All that’s left is for the ADX to strengthen further and Bitcoin could finally break out of this range and begin trending.

What Bitcoin bulls ultimately want to see next is for the ADX to grow even steeper, similar to what we can see in late 2020 and into early 2022. The lack of another strong trend at the second 2021 peak was a warning that something was off. Will the bullish trend continue to strengthen, or will bears regain control?

Low Bitcoin Volatility Mirrors 2016: A Bullish Breakout On The Horizon?

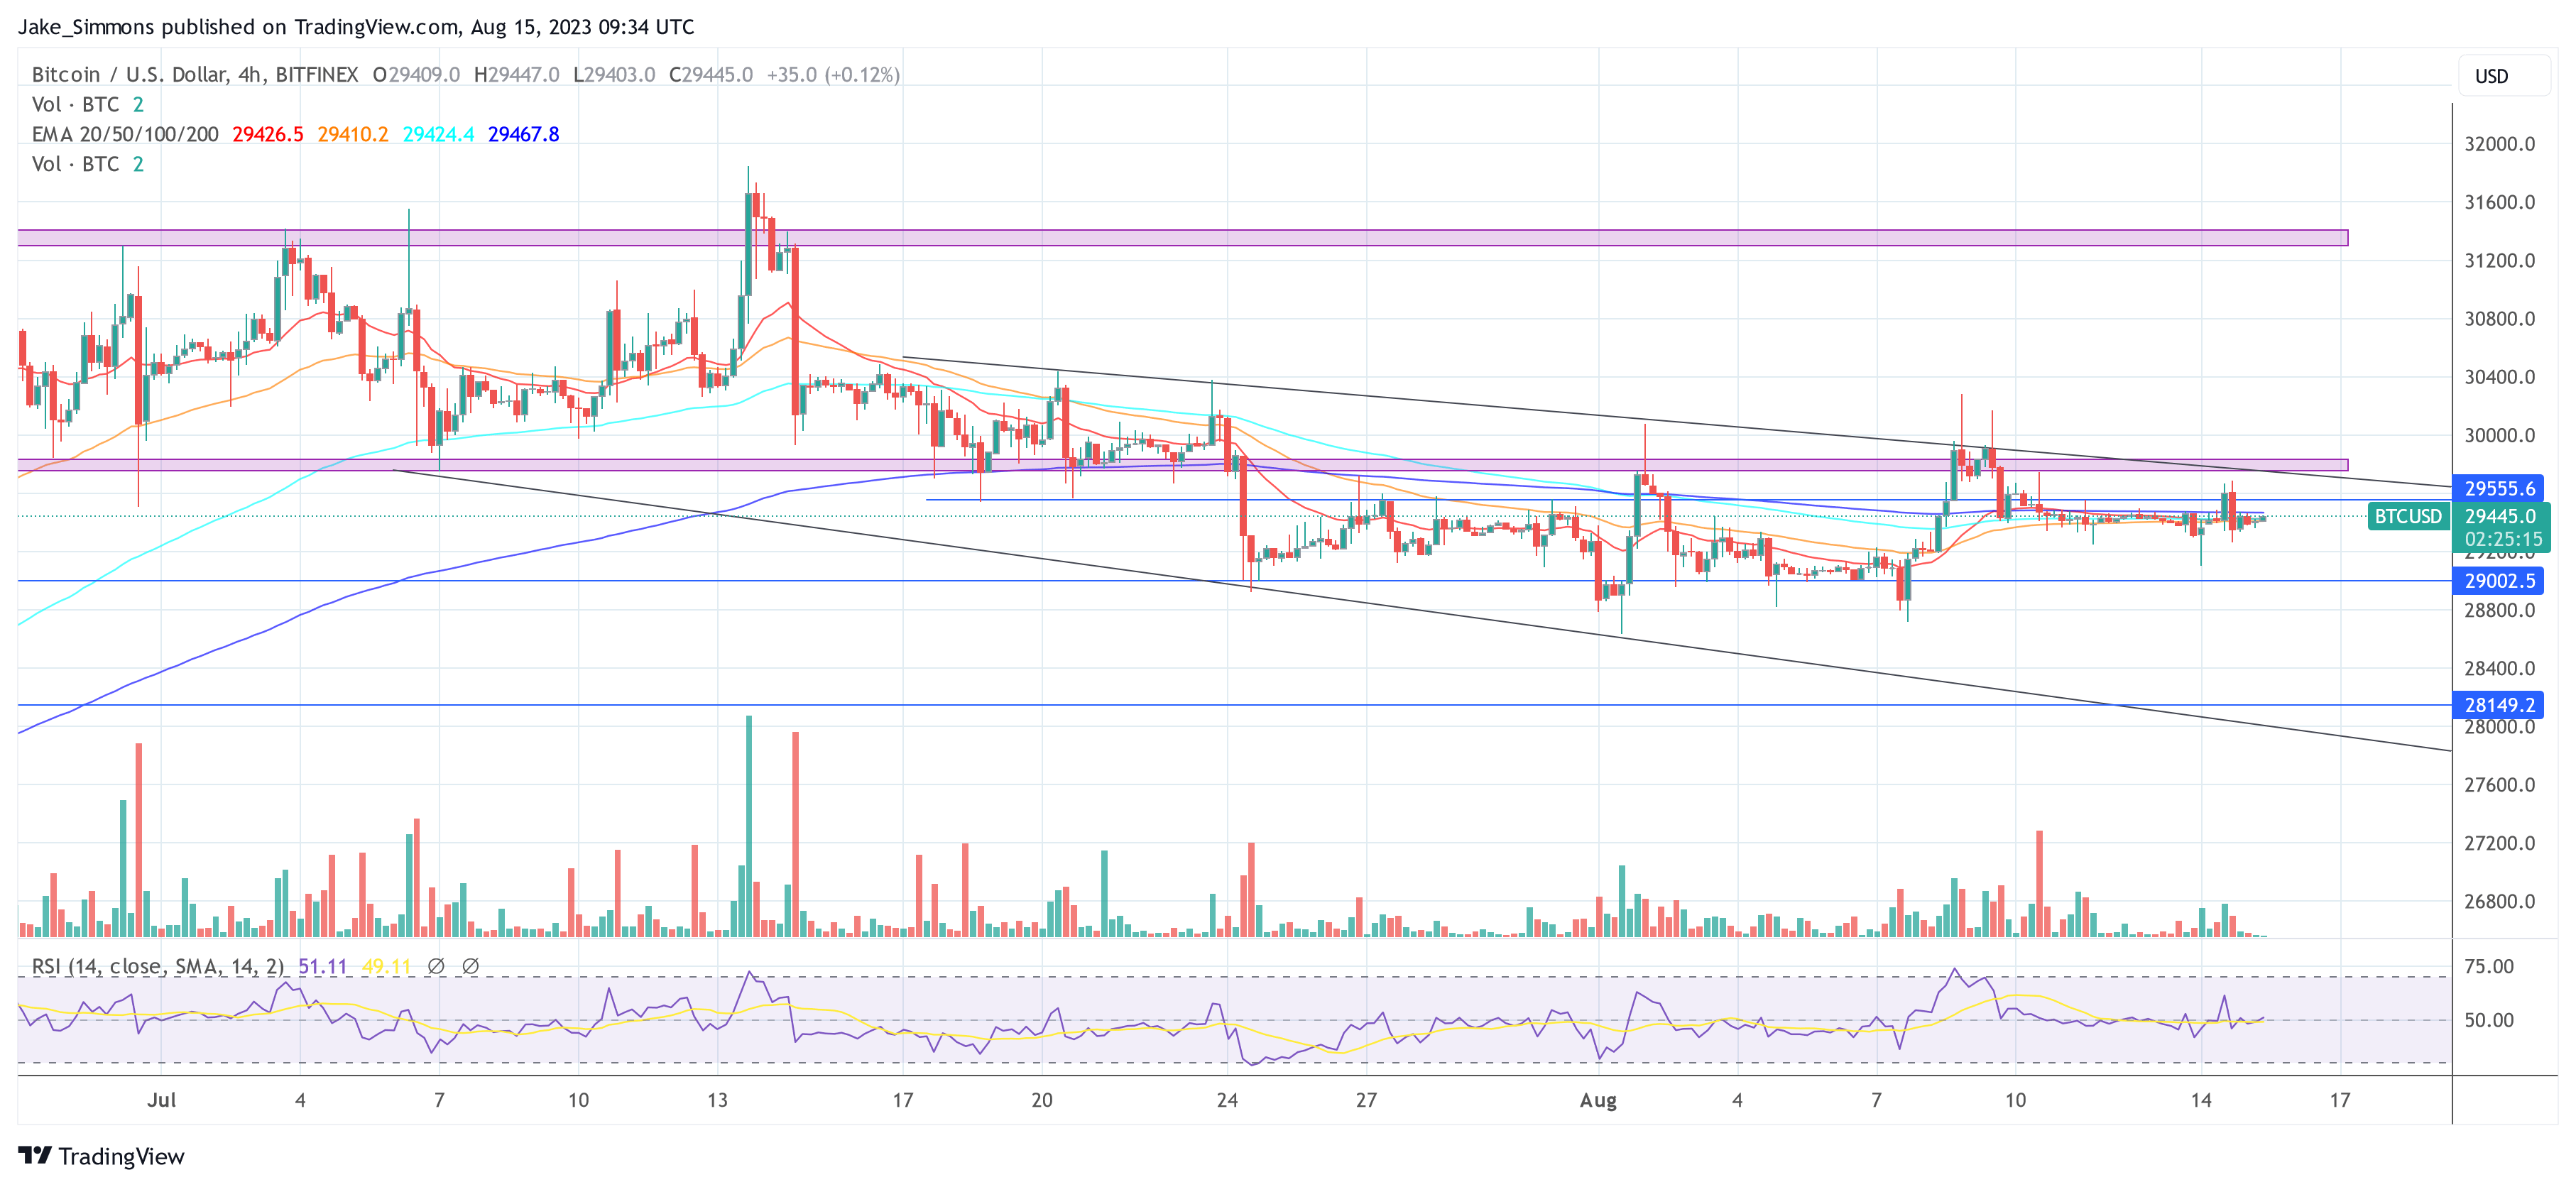
In today’s micro update from Capriole, founder Charles Edwards presented a compelling analysis that draws parallels between the current low volatility of Bitcoin and its historical behavior in 2016. With Bitcoin’s price stagnating around the $29,000 mark, experts are closely watching for signs of a potential bullish breakout.

“Bitcoin’s price remains at $29K, in a sideways consolidation that has created one of the absolute lowest volatility periods in Bitcoin’s 14 year history,” Edwards states. This prolonged period of low volatility is reminiscent of 2016, suggesting that a significant price movement could be imminent.

Bitcoin Breakout Imminent?

While the technicals indicate a bearish breakdown from the $30,000 mark, the absence of a downward momentum offers a glimmer of hope for bullish investors. “If price was going to collapse, we would usually have seen that follow through by now,” the report notes. However, for a more concrete bullish sentiment, “a close back above $30K on the daily timeframe is required at the minimum as a technical confirmation of a failed breakdown.”

On the fundamental front, Bitcoin’s on-chain data continues to contract, albeit at a decelerating rate. The imminent decisions on several Bitcoin ETF approvals could potentially disrupt the current low volatility phase. “An approval could cause a break from the current low volatility range. Best not to pre-empt this though, as these decisions often get pushed. Confirmations are key to mitigate risk,” Edwards cautions.

Diving deeper into the technicals, the report highlighted two key observations:

Since 2010, Bitcoin’s historic volatility has only been lower than today in 2016. Suggesting a big price move is on the horizon when volatility expansion (reversion to the mean) occurs.

Bitcoin’s $30K breakdown has (so far) failed to follow through… A close back into the Wyckoff structure at $30K would signify a failed breakdown and therefore be a very positive technical signal.

BTC On-Chain Indicators Are Neutral

Capriole’s Bitcoin Macro Index, a comprehensive tool that amalgamates over 40 Bitcoin on-chain, macro market, and equities metrics into a machine learning model, currently scores at -0.36, indicating “Contraction”. This suggests that while the short-term outlook remains neutral, the long-term perspective appears bullish. Remarkably, this strategy takes long-only positions in Bitcoin. In slowdowns and contractions, cash is held.

“The Macro Index today remains in a period of relative value (below zero), suggesting decent long-term value for multi-year horizon investors,” the report elucidated.

A noteworthy addition to Capriole’s analysis toolkit is the “Bitcoin Production Cost” model, which evaluates the cost of mining a Bitcoin based on global average electrical consumption. Currently, this model indicates that Bitcoin is trading within a long-term value region, with the report speculating, “I would be surprised if this holds into 2024.”

In conclusion, the analysis from Capriole paints a picture of potential long-term value amidst the current bearish technicals. Drawing parallels with 2016, the report suggests that Bitcoin’s current low volatility phase could be a precursor to a bullish breakout.

“All else equal, Bitcoin is like a beach ball submerged underwater. Nonetheless, we remain in a technical breakdown. We don’t know how long that hand will hold the ball underwater for. Prudent risk-management will await a technical confirmation before acting.”

With the cyclical nature of Bitcoin’s expansion and contraction cycles, only time will tell if history will indeed repeat itself; especially with the backdrop of a totally different macro environment. At press time, the BTC price remained stagnant, trading at $29,445.

Bitcoin price

Bitcoin Prediction: Crypto Analyst Forecasts New ATH by 2024 – Can It Happen?

On August 14, Kevin Kelly, Co-founder of prominent crypto research firm Delphi Digital provided some interesting insights on Bitcoin and the crypto market in general. According to Kelly, the crypto market moves in consistent cycles, and we are currently in the initial stages of a new cycle based on market evidence.

Using the premier cryptocurrency as a benchmark, Kelly states a crypto cycle usually begins with Bitcoin attaining a new all-time high (ATH) value, followed by an 80% loss in the next year. Thereafter, BTC would experience a market recovery over two years before embarking on a bullish run to attain a new ATH. 

The Interplay Between The Crypto Cycle And Macroeconomic Signals

Based on Kelly’s analysis, a typical crypto cycle occurs within four years, and its events are triggered by some factors in the bigger macro business cycle. 

Related Reading: Bitcoin Price Relatively Muted – What Could Trigger A Sharp Decline?

The analyst noted that, for example, Bitcoin usually attains new price peaks at the same period as the Institute of Supply Management (ISM) Index –  an economic indicator that tracks the manufacturing sector’s health in the United States.

He said:

BTC price peaks occur around the same time the ISM shows signs of topping out. Active addresses, total transaction volumes, total fees – they all peaked alongside tops in the ISM too. As the business cycle shows signs of recovery, so too does network activity levels…

Due to this similarity in market movement, Kevin notes that turning moments in a typical business cycle have proven to be a favorable period to increase one’s exposure to risk assets such as Bitcoin. 

Bitcoin Poised To Attain New ATH By Q4 2024, Kelly Says

Interestingly, Kevin Kelly stated in his analysis that the ISM is currently heading toward the end of a two-year downtrend, indicating that BTC’s prices may soon start surging in the coming months.

To back his long-term bullish price prediction, Kelly highlights several other factors, including the Bitcoin Halving event coming up in April 2024. 

The Delphi Digital Co-founder stated that the last two Bitcoin halvings had occurred 18 months after BTC’s price tanked and 7 months before rallying to a new ATH.

Related Reading: Bernstein Predicts Spot ETFs Could Claim 10% Of Bitcoin’s Market If Greenlit

Based on this historical data, BTC could well attain a new ATH by Q4 2024. However, as with all predictions, Kelly stated that are certain risk factors involved. 

Firstly, he predicted that the BTC market is likely to soon witness a modest selling pressure or price consolidation, especially following the market’s strong recovery in the last 9 months.

In addition, he also highlighted the possibility of the business cycle presenting a false bearish end – as seen in March 2020 –  or not reaching its bearish end as soon as predicted. 

According to data from CoinMarketCap, Bitcoin is trading around $29,333.89, with a 0.12% decline on the last day. However, the token’s daily trading volume is up by 26.38% and is valued at $12.2 billion

Bitcoin

Bitcoin Price Relatively Muted – What Could Trigger A Sharp Decline?

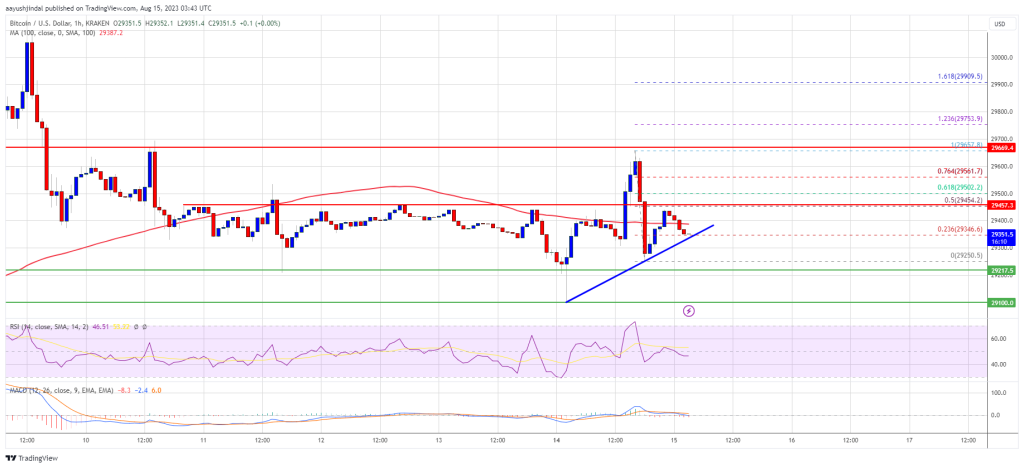
Bitcoin price is still struggling below the $29,650 zone. BTC could gain bearish momentum if there is a close below the $29,100 support.

  • Bitcoin is showing a few bearish signs below the $29,650 zone.
  • The price is trading below $29,400 and the 100 hourly Simple moving average.
  • There is a short-term bullish trend line forming with support near $29,320 on the hourly chart of the BTC/USD pair (data feed from Kraken).
  • The pair could continue to move down if it breaks the $29,250 and $29,100 support levels.

Bitcoin Price Stuck Below $30K

Bitcoin price remained well below the $30,000 resistance zone. BTC attempted a short-term upward move but the bears were active near the $29,650 resistance zone.

A high was formed near $29,657 before there was a fresh decline to $29,250. The price is now consolidating and trading above the 23.6% Fib retracement level of the recent decline from the $29,657 swing high to the $29,250 low.

Bitcoin is now trading below $29,400 and the 100 hourly Simple moving average. There is also a short-term bullish trend line forming with support near $29,320 on the hourly chart of the BTC/USD pair.

Immediate resistance is near the $29,450 level. It is close to the 50% Fib retracement level of the recent decline from the $29,657 swing high to the $29,250 low. The next major resistance is near $29,500. The main resistance is now forming near the $29,650 level.

Bitcoin Price

Source: BTCUSD on TradingView.com

A close above the $29,650 resistance could send the price toward the $30,000 resistance zone. Any more gains might change the trend and the price might rise toward $30,500. In the stated case, the price could even rise toward $31,200 or even $32,200 in the coming days.

More Losses In BTC?

If Bitcoin fails to clear the $29,650 resistance, it could continue to move down. Immediate support on the downside is near the trend line.

The next major support is near the $29,250 level. The first key support is near $29,100. A downside break below the $29,100 level might start another steady decline. In the stated case, the price could drop toward $28,400.

Technical indicators:

Hourly MACD – The MACD is now gaining pace in the bearish zone.

Hourly RSI (Relative Strength Index) – The RSI for BTC/USD is now below the 50 level.

Major Support Levels – $29,250, followed by $29,100.

Major Resistance Levels – $29,450, $29,650, and $30,000.

Bernstein Predicts Spot ETFs Could Claim 10% Of Bitcoin’s Market If Greenlit

According to Bloomberg, a recent research report from Sanford C. Bernstein has shed light on the potential impact of Exchange Traded Funds (ETFs) on the Bitcoin market dynamics.

Potential Surge In Bitcoin Market Value

Sanford C. Bernstein’s research indicates that should the US green-light a fund investing directly in spot Bitcoin, ETFs could constitute roughly 10% of Bitcoin’s market value within the next three years.

Such a shift could amplify Bitcoin’s presence in traditional financial portfolios and potentially foster more significant institutional adoption.

According to Bloomberg, Gautam Chhugani, an analyst at Bernstein, highlighted the rising probability of a spot Bitcoin ETF in the report.

In a separate report, this same analyst had recently disclosed that the SEC believes that a Bitcoin Spot ETF may be “unreliable” since crypto exchanges (such as Coinbase) aren’t under their oversight, leading to concerns about potential price manipulation and unreliability.

While the speculation on the SEC approval of a Spot Bitcoin ETF continues, with the Grayscale Bitcoin Trust currently holding about 4% of all Bitcoin, according to Bloomberg, a direct investment, ETF could more than double this figure, potentially aiding the growth of the crypto investment landscape.

The “Growth Flywheel” Effect

Once regulatory approval is in place, Bernstein anticipates a “growth flywheel” effect propelled by retail and other institutional inflows. Such a cascade effect would be reminiscent of other financial markets where introducing new financial products spurred fresh investments and liquidity waves.

Notably, to understand the significance of this, one only needs to consider the broader ETF market’s growth trajectory. Since their inception, ETFs have grown exponentially, with assets under management surging across various sectors and asset classes.

Introducing a Spot Bitcoin ETF would mean integrating a highly liquid, decentralized, and increasingly accepted asset into this mix, further validating Bitcoin’s place in the financial ecosystem.

Meanwhile, Bitcoin’s price is struggling to break above the $30,000 mark after slipping below that price range last week. As of this writing, the asset trades at $29,623, recording a slight increase of 0.5% over the past 24 hours.

Bitcoin (BTC)’s price chart on TradingView

Alongside its struggling price, BTC’s market capitalization has increased by more than $10 billion in just the past week. The asset market cap has surged from a high of $560 billion earlier last week to a current cap of $573 billion.

The top crypto’s trading volume has also followed closely with its surging market cap and has seen a significant spike from last week’s daily trading volume. Bitcoin’s 24-hour trading volume currently stands at $11.3 billion compared to a lesser volume of $8.7 billion last Monday.

Featured image from iStock, Chart from TradingView

HarryPotterObamaSonic10Inu Casts Spell On The Memecoin Sector And Soars 26%, Which Token Will Follow?

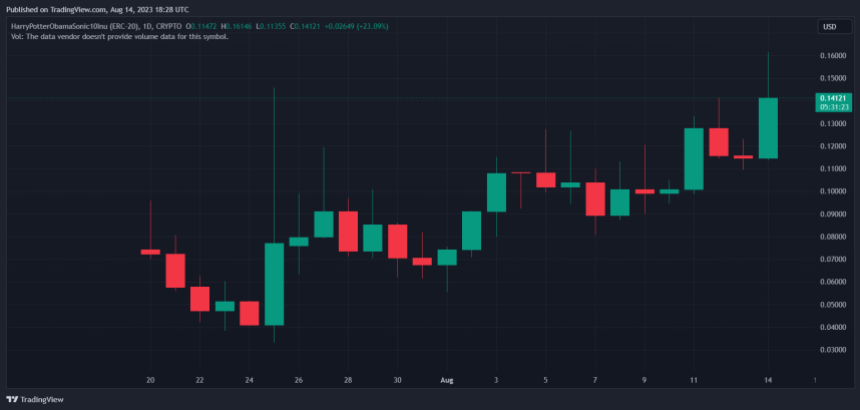
While Bitcoin and the crypto market experienced, HarryPotterObamaSonic10Inu and the memecoin sector are blooming. Recent data points to double-digit gains across the board for these assets, with the potential for further profits if Bitcoin and larger cryptocurrencies continue trading sideways.

As of this writing, HarryPotterObamaSonic10Inu trades at $0.14, with profits of around 30% during the last 24 hours. On the previous seven days, the token saw a 54% profit, but the last month has been the best in performance, with a 246% increase.

HarryPotterObamaSonic10Inu

HarryPotterObamaSonic10Inu Leads Memecoin Sector’s Gains As Bitcoin Acts Like A Stock

Data from market tracker CoinGecko indicates that HarryPotterObamaSonic10Inu’s gains have been followed by ElmoERC and DogeKaki. These cryptocurrencies experienced 10% and 11% rallies’ respectively.

Other cryptocurrencies that experienced positive price action in the memecoin sector include Mooncat CAT and Mog Coin. The last of these tokens recorded a 17% increase over the past hour and at the time of writing alone.

As Bitcoin, Ethereum, and other significant cryptocurrencies trend sideways, traders are attracted to riskier and volatile assets. In addition, these tokens experienced more volatility as they possessed less trading volume and liquidity.

In other words, smaller traders can influence the price action on some of these assets. While on Bitcoin, and even Dogecoin (DOGE), traders need billions of dollars to influence the price action.

When Will The Bitcoin Price Move Again?

But how long can traders in the memecoin sector benefit from a low volatility environment? Per a recent update from Bitfinex Alpha, the current status quo is bound to persist.

As seen in the chart below, there has been a record-low liquidation in the derivatives sector, and as a result, prices have remained steady. Traders should look out for catalyst events in the macroeconomics landscape and a potential liquidation spike if they are betting on HarryPotterObamaSonic10Inu and other memecoins.

HarryPotterObamaSonic10Inu  Bitcoin BTC BTCUSDT

If the spike finally comes through, Bitcoin’s price could finally move again, crushing memecoins and the altcoins market. The Bitfinex Alpha report stated:

(…) the low volatility regime should continue for a while. The lack of futures liquidations, euphoria and pain in the markets are also the reason for lack of any significant orderflow developments as the BTC price continues to range sideways even after breaking down from a significant range between $29,500 and $31,500.

Cover image from Unsplash, chart from Tradingview

Bitcoin Price Supported By Thin $40 Million Bid Pool, But For How Long?

In the ongoing market turbulence on higher timeframes, Bitcoin (BTC) is at a crucial juncture as a great consolidation phase persists.

Research and analysis firm Material Indicators closely monitored the recent weekly candle close/open, paying particular attention to two key factors: the trend line and the 21-day, 21-week, and 21-month moving averages (MA) – all of which are currently influential in shaping market dynamics. 

Uncertainty And Potential Turning Point For Bitcoin

The opening of the weekly candle below the trend line triggered a “subsequent nosedive,” amplifying concerns. While the 21-week and 21-month moving averages continue to serve as robust support, the 21-day MA has faced a rigorous seven-day testing period, according to the firm’s analysis. 

Notably, the tight correlation of the 21-MA across three distinct time frames is rare, indicating that the market is at a critical inflection point. 

Despite the compressed volatility witnessed in recent days, the price action observed over the past 24 hours exemplifies the market’s attempt to shake out weak hands.

According to Material Indicators, given the complexity of the current price action, it is prudent to zoom out and gain a broader perspective. Both Trend Precognition algorithms identified these moves on the four-hour chart, emphasizing the significance of adopting a comprehensive outlook.

Moreover, according to Materials, the order book reveals a concerning trend in bid liquidity, with less than $40 million holding the price up. 

Bitcoin

The absence of substantial liquidity below this level raises fundamental worries. However, it also suggests that there may not be sufficient sentiment to drive prices significantly lower – at least not yet. 

In addition, Material Indicators highlights that the examination of liquidity movements within the order book over the past month paints a picture of continued price volatility with a potential upward bias. 

However, the lack of volume raises concerns about the market’s overall health. Despite a $13 million buy wall at $27,900, the bottom of the channel at $28,300 remains a critical threshold for BTC to extend its current trend. The firm claims:

… the bottom of the channel at $28.3k remains my line in the sand for BTC to extend the trend, and I maintain that we must see weekly candles printing above the 100-Week MA to even consider a bull breakout.

BCT Faces Renewed Pressure Amid Strengthening US Dollar

As Bitcoin enters a new week of trading, market participants closely monitor the potential impact of the strengthening US Dollar Index ($DXY) on the world’s leading cryptocurrency. 

According to Yan Alleman, co-founder of blockchain analytics firm Glassnode, recent developments suggest that BTC may face renewed pressure due to the upward momentum of the $DXY.

Alleman highlights that the $DXY’s renewed strength could exert downward pressure on Bitcoin’s price. Historically, there has been an inverse correlation between the value of the US Dollar and the price of BTC, meaning that when the dollar strengthens, Bitcoin often faces headwinds. 

However, options pricing indicates a bullish sentiment for Bitcoin in the coming month. Options are financial derivatives that allow traders to speculate on the future price of an underlying asset, in this case, Bitcoin. 

The pricing of options contracts suggests an expectation of a bullish move shortly. This aligns with the technical analysis indicating potential upside for Bitcoin.

Analyzing the potential price movements, Alleman notes that it would require nearly twice as much selling pressure to push Bitcoin down to the low $28,000 range compared to the buying pressure needed to surpass the $30,000 level. 

This observation suggests that there may be greater support and buying interest at higher price levels, making a sustained drop less likely.

Bitcoin

As of the time of writing, Bitcoin (BTC) is trading at $29,500, reflecting a marginal 0.4% increase over the past 24 hours.

Featured image from iStock, chart from TradingView.com

Michael Burry’s Massive $1.6 Billion Short: Is A $DXY Collapse The Catalyst For A Crypto Bloodbath?

Michael Burry, renowned investor, and hedge fund manager, has once again made headlines with his significant short position in the traditional market, which could impact the nascent crypto industry if his bet is to materialize.

Burry, known for accurately predicting the subprime mortgage crisis, recently went mega-short with over $1.6 billion in S&P 500 (SPY) and Nasdaq 100 (QQQ) puts. These indexes often record a high correlation with the crypto market as they attract similar investors. 

Burry’s $1.6 Billion Short Signals Potential Implications For Crypto Market

Burry’s track record as an astute investor lends weight to his latest bet. By predicting and profiting from the subprime mortgage crisis, he gained a reputation as an investor capable of identifying market trends before they unfold. 

Crypto

It is important to consider that Burry has established himself as a prognosticator who is often ahead of the curve and is willing to wait for the anticipated market changes to come to fruition.

On this matter, Yan Alleman, co-founder of Glassnode, has supported Burry’s approach, suggesting that while the short-term effects may not be immediately evident, the long-term payoff is likely to be significant.

Alleman also highlighted the potential impact of the US Dollar Index (DXY) on the cryptocurrency market, specifically Bitcoin.

According to Alleman, the recent renewed strength of the DXY could exert pressure on Bitcoin. The DXY measures the value of the U.S. dollar against a basket of major currencies. 

On The Verge Of A Final Leg Up?

As Burry predicts, a drop in the DXY could result in a significant surge in crypto assets, including Bitcoin, as investors seek alternative stores of value. This surge would represent a final leg up before a presumed deep correction across financial markets.

While the correlation between the DXY and Bitcoin has been subject to debate, the potential consequences of Burry’s short position on the market cannot be ignored. 

If his prediction were to come true, it could trigger a domino effect, leading to a substantial downturn in traditional markets and a subsequent surge in crypto assets.

Nevertheless, the implications for Bitcoin and the broader crypto market in such a scenario are twofold. On the one hand, Bitcoin has often been hailed as a digital store of value and a hedge against traditional market downturns. 

Burry’s short position on the market could reinforce this narrative, attracting more investors to Bitcoin as a safe haven asset.

On the other hand, the cryptocurrency market’s extreme volatility could magnify the potential crypto bloodbath if Burry’s bet materialized. 

A sudden surge in selling pressure for Bitcoin and other cryptocurrencies, coupled with a widespread market correction, could result in a sharp decline in the crypto market, causing substantial losses for investors who entered the market at its peak.

As the market unfolds in the coming weeks and months, all eyes will be on Michael Burry’s $1.6 billion short position and its potential impact on traditional markets and crypto. 

Only time will tell if Burry’s bet proves prescient once again or if the market defies his expectations, leaving investors to navigate the ever-changing landscape of investment opportunities.

Crypto

As of the current writing, Bitcoin (BTC) is trading at $29,300, indicating a marginal 0.3% decline over the past 24 hours. The cryptocurrency has continued to be in a consolidation phase since the start of August.

Featured image from iStock, chart from TradingView.com

Here’s Why This Former SEC Lawyer Thinks A Spot Bitcoin ETF Isn’t Coming

Recent comments from former SEC Attorney John Reed Stark have further dampened optimism about the regulator approving any of the pending Spot Bitcoin ETF applications.

Spot Bitcoin ETF Approval Looking More Unlikely

The United States Securities and Exchange Commission (SEC) has continuously denied applications for a Spot Bitcoin ETF, and Stark has suggested that this trend isn’t going to change anytime soon as the SEC will likely deny all the pending applications due to several “compelling reasons.”

While aligning his opinion with that of Better Markets, Stark stated that the arguments laid forward in the nonprofit’s letters to the SEC “brilliantly” highlighted why the SEC would not approve any of these applications.

Better Markets had, in two separate letters (here and here) dated August 8, laid out arguments why the SEC should reject the proposed rule changes by the Cboe BZX Exchange and the Nasdaq Stock Market “to list and trade shares in Spot bitcoin-based exchange-traded products (ETP).” 

According to them, the Spot Bitcoin market is known to show inflated trading volumes due to illicit practices like market manipulation and wash trading. They argue that the markets are highly concentrated and Bitcoin’s network is maintained by a “select group of individuals and entities.” All this makes any proposed Spot Bitcoin ETP susceptible to manipulation by “bad actors” and puts investors and the public interest at risk. 

In their applications, these exchanges stated that CME Bitcoin futures, a regulated market of significant size, could provide the necessary data and insights relating to any fraud and manipulation in the Spot Bitcoin ETF market. Additionally, they had entered into a surveillance-sharing agreement with Coinbase as an extra measure to prevent fraud and market manipulation.

However, Better Market has labeled these measures as “wholly inadequate.” They argue that the CME Bitcoin futures market is not a “regulated market of significant size” and the surveillance-sharing agreement with Coinbase is insufficient to prevent market manipulation.

Bitcoin (BTC) price chart from Tradingview.com (Spot Bitcoin ETF SEC)

Is Crypto Regulation Now Political?

Stark believes that the “crypto-regulatory tides could shift exponentially” once the US 2024 elections take place. He noted the political divide regarding crypto and how this has also played out in the SEC’s clampdown on the crypto industry. 

Related Reading: Bitcoin-Friendly Javier Milei Wins Presidential Primaries In Argentina

The SEC has been known to come on hard at several crypto firms, including two of the world’s largest crypto exchanges, Binance and Coinbase, accusing them of securities violations. However, Stark predicts that the SEC will abandon this crypto-enforcement effort and focus more on mostly fraud cases should a Republican get elected as President next year.

Although the elections are slated for November 2024 (long after the SEC might have decided on the pending Spot Bitcoin ETF applications), Stark has forecasted that a GOP-led administration could bring about the approval of a Spot Bitcoin ETF. 

Winds Of Change: Bitcoin Miner Riot Sees Substantial Increase In BTC Holdings

Bitcoin mining has been up by a considerable fraction this year, as the blockchain network recorded a new all-time high in hash rate in the second quarter of the year. Mining revenue is also up, as the bitcoin Bitcoin recorded a spike in transaction volume. 

As a result, Riot Blockchain, one of the largest publicly traded Bitcoin mining companies in the US, has recorded an increase in operations in the second quarter. According to its 2023 second-quarter financial results, the mining company recorded a new all-time record hash while ramping up its Bitcoin mining operations.

Solid Second Quarter 2023

According to its financial report, Riot has seriously ramped up its Bitcoin mining operations. As a result, the mining company produced 1,775 BTC during the second quarter of 2023, a 27% increase compared to the 1,395 BTC it produced during that same period in 2022. 

In May 2023 alone, the company produced 676 BTC at an average of 21.8 BTC per day. The average cost to mine each bitcoin was $8,389, beating Q2 2022’s average of $11,316.

Riot also witnessed an increase in mining revenue, as Bitcoin miners generated a remarkable total revenue of $2.4 billion. Although the price of Bitcoin during the quarter was 15% less than what it was in Q2 2022, Riot saw a total revenue of $76.7 million, as compared to $72.9 million in Q2 2022. Mining revenue ($49.7 million), engineering revenue ($19.3 million), data hosting revenue ($7.7 million), and power curtailment credits ($13.5 million) were also higher than in Q2 2022. 

Not only has RIOT’s revenue from bitcoin mining increased, but their actual bitcoin holdings have also grown substantially. As of June 30, Riot held 7,264 BTC with the price of each BTC at $30,477.

In total, Riot finished the quarter with $408.4 million in working capital, including $289.2 million in cash on hand and $221.4 million in Bitcoin, while also reducing its net loss to $27.7 million compared to $353.6 million in Q2 2022.

Bitcoin (BTC) price chart from Tradingview.com (Riot Blockchain)

Increase In Bitcoin Mining Power

Riot Blockchain also drastically increased its hash rate throughout the quarter, reaching an all-time record hash rate capacity of 10.7 EH/s. However, the company is also looking to enhance its computational power. 

During the quarter, the company signed a long-term purchase agreement with MicroBT to acquire 33,280 next-generation miners. With an expanded mining fleet and facility, Riot believes it can see its hash rate grow to 20.1 EH/s by the second quarter of 2024. 

Bitcoin mining is an energy-intensive process. However, Riot’s power strategy contributes to the stability of the energy grid in Texas at times of high demand by selling extra power back to the grid. At the time of writing Riot’s stock is up by 1.53% in a daily timeframe and 158.14% in the past six months.