The latest price moves in bitcoin [BTC] and crypto markets in context for Jan. 23, 2024. First Mover is CoinDesk’s daily newsletter that contextualizes the latest actions in the crypto markets.
Bitcoin Price Drops Sub $39,000 – 3 Key Reasons
The Bitcoin price has plummeted below the $39,000 mark, the lowest level since December 2. This significant drop can be attributed to three main factors that have collectively contributed to the current market sentiment and price action.
#1 Selling Pressure From Grayscale’s GBTC Outflows
The market has been heavily influenced by the continuous outflows from the Grayscale Bitcoin Trust (GBTC). Bloomberg analyst James Seyffart commented on the severity of the situation, stating, “Woof. BAD day for Bitcoin ETFs overall in the Cointucky Derby. GBTC saw over $640 million flow out today. Outflows aren’t slowing — they’re picking up. This is the largest outflow yet for GBTC. Total out so far is $3.45 Billion.”
Nevertheless, the volume on the Bitcoin ETFs remained very strong, surpassing $2 billion, with GBTC accounting for over half of this volume. The total volume for the first seven trading days approached $19 billion.
Interestingly, while GBTC experienced significant outflows, the broader spot Bitcoin ETF landscape paints a different picture. Excluding Grayscale, the nine new ETFs have collectively amassed 95,000 Bitcoin ($3.8 billion), in stark contrast to the 65,000 Bitcoin ($2.9 billion) that flowed out of GBTC.
22,000 BTC have been from selling from the FTX Estate, meaning not flowing into others. While the cessation of this supply overhang is generally positive for the market, it remains crucial to monitor whether the outflows from Grayscale persist or intensify, even after the conclusion of the FTX-related sell-offs.
#2 Futures And Options Markets Cool Down
A significant contributor to Bitcoin’s price movement below $39,500 is the cooling of activity in the futures and options markets. Notably, the open interest in CME Bitcoin futures experienced a sharp decline, shedding over $1.64 billion following the approval of spot BTC ETFs, indicating a reduction in market leverage and speculative interest.
Crypto analyst Skew provided a nuanced analysis of the market dynamics, particularly focusing on the interplay between Bitcoin’s perpetual futures (perps) and the spot market. Skew noted, “Nothing too conclusive yet in perps market other than shorts becoming the dominant position in the market currently. Perp premiums often occurring during periods of spot limit selling into price. Spot premiums notably when perps push price into areas of limit bids on spot exchanges.”
This observation points to a shift towards bearish sentiment in the perps market, with short positions taking precedence. The analyst also highlighted the current market’s lack of volatility and urgency, attributing it to decreased open interest and a focus on spot market flows.
Further shedding light on the market sentiment, options analytics platform Greeks.live added insights into the options market, particularly the behavior of Bitcoin’s implied volatility (IV) and the volatility risk premium (VRP). They noted, “Bitcoin fell below the $40,000 as short-term IVs recovered. Overall VRP has risen, and the Skew curve is skewed towards put options.”
This shift towards put options signifies an increase in market participants hedging or betting on further downside, thus contributing to the bearish sentiment. However, Greeks.live also pointed out that despite the bearish forces and the presence of panic orders, the overall market is still witnessing a balanced game between bulls and bears.
#3 Sentiment Shift – Calls For $35,000 Get Louder
The third pivotal factor influencing Bitcoin’s price drop below $39,500 is a notable shift in market sentiment, emphasizing the need for a correction after a prolonged bullish period. Charles Edwards, the founder of Capriole Investments, articulated the market’s current state, highlighting the abnormality of the recent price trends and forecasting an inevitable return to volatility.
Edwards stated, “We’re still not here yet. This pullback is very overdue and lower is healthier.” He pointed out the rarity of the current market conditions, noting, “It’s now been over 232 days since Bitcoin had a 25%+ drawdown in the prior 12 months. The last time this happened was more than a decade ago, in 2011! The current low downside volatility period is NOT normal. These dips usually occur every 2-3 months. Volatility will return.”
The recent price correction, although perceived as a healthy and overdue adjustment by analysts, has nevertheless instilled a sense of panic among traders and investors. The market’s sentiment has taken a negative turn, especially as Bitcoin experiences a -20% dip, a movement partly attributed to the overhang of Grayscale’s supply.
The once robust bullish optimism has waned, giving way to louder calls for a further decline to $35,000 or even lower. This shift in sentiment is quantitatively reflected in the Bitcoin Fear & Greed Index, which has moved to a neutral position of 50, marking a significant departure from the extreme greed observed during the uptrend.
At press time, BTC traded at $39,219.
Bitcoin Under $39K As ETF Debut Continues To Be a ‘Sell-the-News’ Event
BTC was down nearly 5% in the past 24 hours, reaching its lowest level in two months. The CoinDesk 20, a liquid index of the highest tokens by market capitalization, fell 7%.
Bitcoin Indicator, Which Signaled Late 2023 Rally, Is About to Flash Bearish Signal
The Guppy Multiple Moving Average indicator is about to flash a red signal, indicating a strengthening of downward momentum.
Solana, Avalanche Tokens Slide as Bitcoin Traders Target Eye Support at $38K
Over half of the profits accumulated by short-term bitcoin holders have been wiped out, Bitfinex analysts said in a Tuesday note.
Bitcoin Unphased by China’s Stimulus Plan
Hong Kong’s Hang Seng Index and the CSI 300 both responded to Beijing’s plan to reboot China’s domestic stock market, but bitcoin remains in the red.
Pastor Accused Of Defrauding Congregation With $3 Million Crypto Ponzi Scheme
Denver-based internet pastor, Eli Regalado, is at the center of a controversy surrounding an alleged crypto Ponzi scheme involving INDX coin.
The self-proclaimed spiritual leader has come under scrutiny as Colorado’s securities regulator investigates his deceptive practices, which reportedly resulted in over $3 million in ill-gotten gains. Fortune magazine report shed light on the matter, exposing Regalado’s questionable actions and shedding light on the plight of the victims involved.
Pastor Regalado’s Deceptive Crypto Venture
According to Colorado’s securities regulator, Regalado, and his wife orchestrated a “small-scale swindle”, targeting hundreds of individuals with promises of extraordinary returns on their investments in INDX coin.
Presenting his appeals with biblical undertones, using terms like “sowing” and “tithing,” Regalado convinced his online church followers that purchasing the cryptocurrency would yield a tenfold increase in their investments.
However, the promised returns never materialized, and investors lost their “hard-earned” money. To compound matters, it is alleged that the Regalados diverted a significant portion of the funds to finance personal expenses, including home renovations and luxury purchases, further exacerbating the victims’ financial losses.
Despite the allegations and mounting legal troubles, Regalado chose to address the accusations head-on by posting a 10-minute video on the crypto project’s website.
In the video, he attempts to deflect responsibility, claiming that misappropriating funds was not solely his decision, but rather a result of divine guidance for a home remodeling project.
Displaying a lack of understanding of financial concepts, Regalado haphazardly employs buzzwords like “leverage” and “liquidity” without demonstrating a clear comprehension of their meaning.
Furthermore, Regalado boasts about the supposed success of the project, mentioning “$300 million of coins sown before the exchange went live.” However, the Colorado regulator clarifies that these coins have no value, primarily because they could only be traded on the Kingdom Wealth Exchange, an ill-functioning service operated by the Regalados themselves.
Colorado Authorities Take Action To Recover Funds
According to Fortune, the next steps in this ongoing investigation are expected to involve the state of Colorado seizing any remaining funds and returning them to the defrauded investors.
Meanwhile, Regalado’s video attempts to invoke divine intervention, predicting that the INDX coin debacle will resolve itself miraculously through divine intervention in the financial sector.
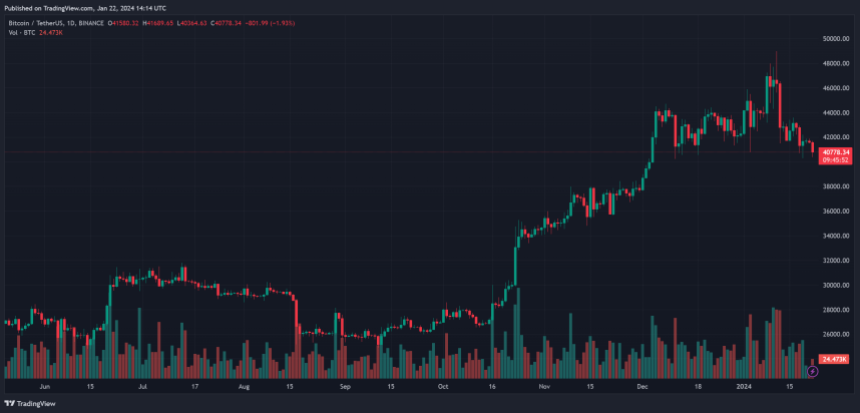
According to CoinGecko data, the total crypto market cap has declined over 4.6%, reaching as low as $1.51 trillion on Monday. However, when compared to one year ago, the cryptocurrency market has witnessed an impressive surge of 55.27%.
At the forefront of the cryptocurrency market stands Bitcoin (BTC), the pioneering digital currency that continues to dominate the landscape. As of today, Bitcoin’s market cap stands at an impressive $795 billion, accounting for a substantial 47.66% of the total cryptocurrency market.
Featured image from Shutterstock, chart from TradingView.com
Bitcoin Price Dives Below $40K, Can Bulls Save The Day?
Bitcoin price extended its decline below the $40,000 support zone. BTC is consolidating losses and remains at risk of more downsides below $38,500.
- Bitcoin price is gaining bearish momentum below the $40,500 zone.
- The price is trading below $40,500 and the 100 hourly Simple moving average.
- There is a connecting bearish trend line forming with resistance near $40,850 on the hourly chart of the BTC/USD pair (data feed from Kraken).
- The pair might correct above $40,000 but the bears could remain active near $40,500.
Bitcoin Price Takes Hit
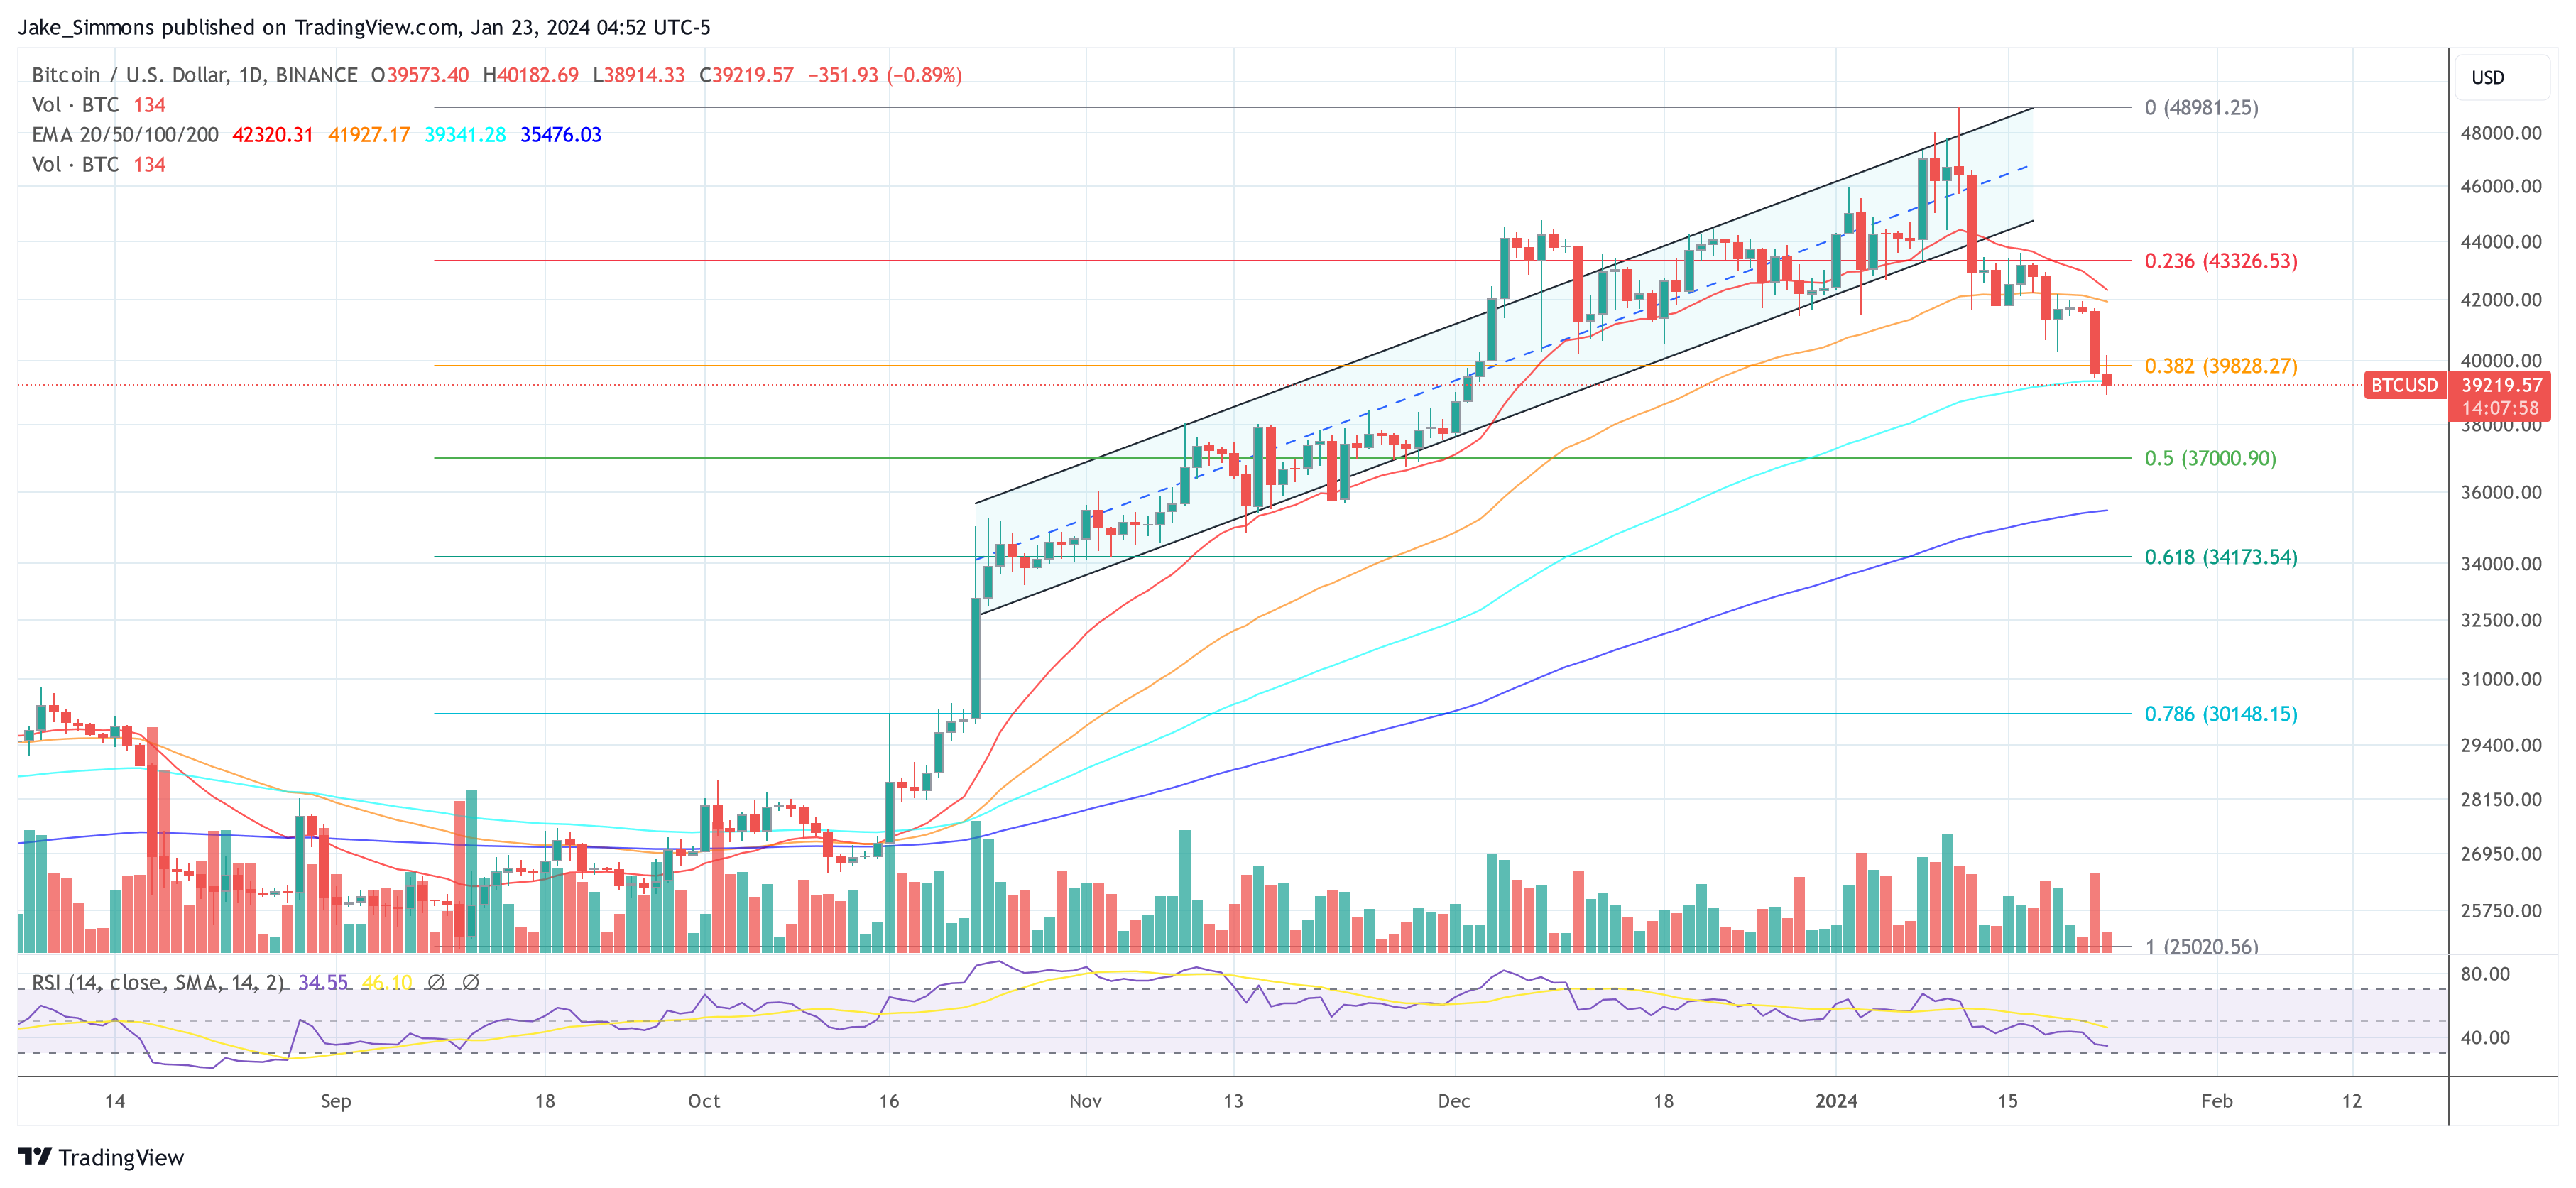
Bitcoin price remained in a bearish zone below the $42,000 support zone. BTC bears gained strength and were able to push the price below the $40,000 support zone.
A new weekly low was formed near $39,451 and the price is now consolidating losses. It is slowly recovering above the $39,800 level. It is approaching the 23.6% Fib retracement level of the recent decline from the $42,260 swing high to the $39,451 low.
Bitcoin is now trading below $40,500 and the 100 hourly Simple moving average. Immediate resistance is near the $40,150 level. The first major resistance is near the $40,850 level. There is also a connecting bearish trend line forming with resistance near $40,850 on the hourly chart of the BTC/USD pair.
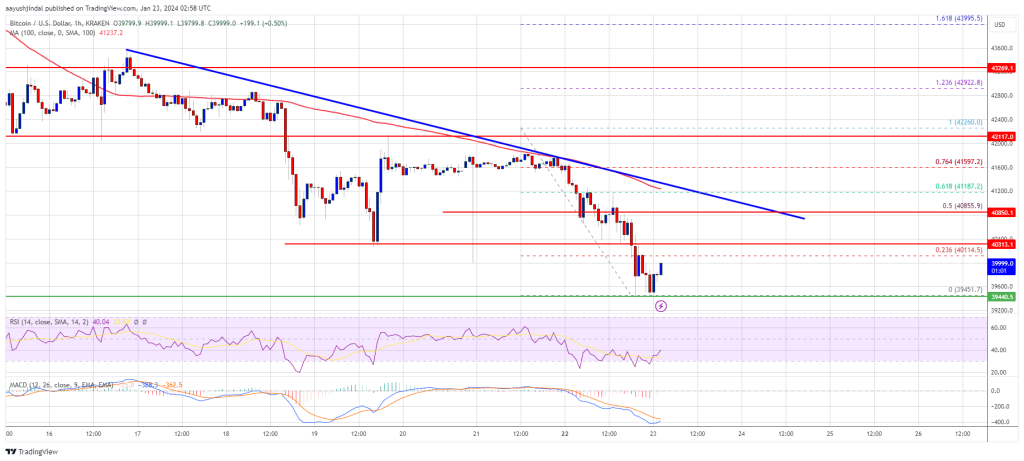
Source: BTCUSD on TradingView.com
The trend line is close to the 50% Fib retracement level of the recent decline from the $42,260 swing high to the $39,451 low. A clear move above the $40,850 resistance could send the price toward the $41,250 resistance. The next resistance is now forming near the $42,000 level. A close above the $42,000 level could push the price further higher. The next major resistance sits at $43,000.
More Downsides In BTC?
If Bitcoin fails to rise above the $40,850 resistance zone, it could continue to move down. Immediate support on the downside is near the $39,650 level.
The next major support is $39,500. If there is a close below $39,500, the price could gain bearish momentum. In the stated case, the price could drop toward the $38,500 support in the near term.
Technical indicators:
Hourly MACD – The MACD is now losing pace in the bearish zone.
Hourly RSI (Relative Strength Index) – The RSI for BTC/USD is now below the 50 level.
Major Support Levels – $39,500, followed by $38,500.
Major Resistance Levels – $40,500, $40,850, and $41,250.
Ethereum’s Tipping Point: Analyst Warns Of Steep Drop To $2,000
Since Ethereum (ETH) peaked at $2,717 in the last two weeks, the asset has experienced a gradual decline, culminating in its arrival at a key demand zone, which could be instrumental in determining its imminent price trajectory, according to a prominent crypto analyst.
Critical Support Zone Flags Continuous Bearish Move
Renowned crypto analyst Ali has pinpointed a critical demand zone for ETH, ranging between $2,388 and $2,460. The resilience of this support level could pave the way for an upward trajectory, offering Ethereum a much-needed respite from bearish pressures.
However, should Ethereum falter, a bearish slide to the next major support level of around $2,000 may be imminent. Such a decline would represent a significant drop of nearly 20% from its current price around the $2,300 mark, posing a stern test for Ethereum’s market upward stability.
#Ethereum Market Update: $ETH is currently in a key demand zone, ranging between $2,388 and $2,460. If this support holds strong, there’s a clear path ahead with minimal resistance, offering a potential for upward movement.
However, if #ETH fails to maintain this level, we… pic.twitter.com/F0HfyrSdGF
— Ali (@ali_charts) January 21, 2024
Over the past 24 hours, Ethereum has witnessed a noticeable 4.3% decrease in value, breaching Ali’s critical demand zone. Currently, ETH trades at $2,368, signaling a possibility of a further plunge from here.
This price dip is mirrored in Ethereum’s trading volume, which has seen a significant decrease from $19 billion last Monday to just over $10 billion today, indicating lesser trading activity and a shift in investor sentiment.
Ethereum’s Market Dynamics: Whales Buying Dip and Rising Dominance
The current market dip has not gone unnoticed by savvy investors. According to Lookonchain, a crypto analytics platform, a prominent Ethereum whale has capitalized on the opportunity, acquiring 3,600 ETH valued at around $8.9 million.
After the price of $ETH dropped today, this smart whale bought 3,600 $ETH($8.9M) back at a lower price 5 hours ago.
This whale is very good at buying $ETH at low prices and selling $ETH at highs.
The profit is ~$25.8M currently!https://t.co/UzXbheftr1 pic.twitter.com/DannZzsQVk
— Lookonchain (@lookonchain) January 19, 2024
This strategic move is part of a larger pattern observed in the whale’s trading history, marked by buying low and selling high. This tactic has reportedly amassed profits estimated at $25.8 million.
Amid this bearishness, Ethereum has shown resilience in terms of market dominance. A recent report by analytics firm Santiment reveals that Ethereum’s market share, relative to the total crypto market capitalization, has surged by roughly 22.4% in just one week.
This growth is complemented by a significant increase in active Ethereum addresses, with an average of 89,400 new addresses joining the network daily, reaching a peak of 96,300 new addresses in a single day.
These figures suggest a growing interest and engagement in the Ethereum ecosystem despite the current market conditions.
#Ethereum‘s price dominance continues to surge against #Bitcoin‘s, now +22.4% in a week. During this stretch, there have been 89.4K new $ETH addresses created per day, and 96.3K wallets just yesterday. Additionally, the 2nd largest market cap asset’s supply on
(Cont)
pic.twitter.com/9nHCl6PJPy
— Santiment (@santimentfeed) January 16, 2024
Featured image from Unsplash, Chart from TradingView
Bitcoin Expected To Mirror Historical Trends: Glassnode Sets $120K Price Prediction For 2024
Bitcoin (BTC), the largest cryptocurrency in the market, has encountered a significant downturn following the waning hype around exchange-traded funds (ETFs), resulting in a 9% decline over the past fourteen days.
However, Glassnode co-founders remain optimistic, asserting that the recent price corrections align with historical patterns and could propel Bitcoin to new heights, nearly doubling its current all-time high (ATH) of $69,000.
Healthy Market Correction?
In their latest analysis, the co-founders of the blockchain analytics firm posted on X (formerly Twitter), highlighting Bitcoin’s movement to the 6.618 Fibonacci Extension after a Bull Flag Correction.
They draw parallels between the current correction and similar market conditions observed in late 2017 and 2020. The question arises: Will history repeat itself in 2024, and will Bitcoin reach its 6.618 Fibonacci Extension during this bullish market, setting a target of approximately $120K?

Examining the chart above, the analysis by the Glassnode co-founders reveals a comparable price correction following Bitcoin’s breakout above the $10,000 price level, which initiated the bull trend that propelled the cryptocurrency to a $15,000 increase before reaching its current ATH of $69,000.
Likewise, Bitcoin exhibited a similar bull flag pattern after surpassing the $29,000 price level, leading to a 22-month high of $48,900 on January 11. Notably, this surge occurred shortly after the approval of Bitcoin spot ETFs by the U.S. Securities and Exchange Commission (SEC).
Considering these developments, the key to Bitcoin’s future trajectory lies in maintaining support around the $40,000 level and further consolidation above it. If these conditions are met in the coming months, Bitcoin has the potential to reach the 6.618 Fibonacci extension, pushing its price as high as $120,000.
New All-Time Highs Expected For Bitcoin
Like Glassnode co-founder’s recent price analysis, crypto analyst Crypto Con also relies on historical patterns to gauge the future price action of BTC. According to Crypto Con, the mid-top of this Bitcoin price cycle occurred slightly faster than previous cycles but slower than the third cycle.
Notably, this mid-top represents the only instance where it occurred outside of an early top, as indicated by the purple and yellow dots on the chart provided by the analyst.

Despite the 2019 mid-top occurring a year earlier than expected, the cycle top still manifested within the usual timeframe, plus or minus 21 days from November 28th, 2021.
Crypto Con stresses that there is currently no evidence apart from complex theories to support the notion of an accelerated cycle. The analyst cautions against assuming that ETFs prevent potential Bitcoin price corrections.
After November 28th, 2024, Crypto Con predicts the emergence of new all-time highs for the Bitcoin price of $90,000 or $130,000 and significant growth for the cryptocurrency market.
At the time of writing, BTC is trading at $40,590, down 2.5% in the past 24 hours. If this level is breached, Bitcoin could drop towards the $37,650 level as it is the next major support for the cryptocurrency.
Featured image from Shutterstock, chart from TradingView.com
Bitcoin-Based Digital Art Image ‘Genesis Cat’ Sells for $254K in Sotheby’s Auction
The sale of the digital image from the Taproot Wizards project came as popularity surges for the NFT-like creations minted atop the Bitcoin blockchain’s Ordinals protocol. All in, some 19 lots sold by Sotheby’s raked in a combined $1.1 million.
Bitcoin Price “Mad Heavy,” Why A Detour To $30,000 Might Be Imminent
The Bitcoin price took a downside turn over the weekend and seems ready to re-test critical support levels. The downside price action was triggered by a spike in selling pressure following the approval of Bitcoin spot Exchange Traded Funds (ETFs) in the US.
As of this writing, the Bitcoin price trades at $40,900 with a 2% loss in the past 24 hours. Over the last week, these losses doubled, with other assets in the crypto top 10 by market underperforming, except for Dogecoin (DOGE), which still records a 4% profit in the same period.
Bitcoin Price Loses Steam, How Low Can BTC Go?
Via the social media platform X, the founder and former CEO of crypto exchange BitMEX, Arthur Hayes, shared a forecast for the Bitcoin price. According to Hayes, BTC seems poised to lose its current levels.
The crypto founder and trader claims that the low timeframe price action will likely push Bitcoin below $40,000 and potentially below $35,000 if bulls fail to defend the higher area around these levels.
The main issue regarding the current market structure rests upon the liquidity in the Bitcoin market. As seen in the chart below and as pointed out by Hayes, the liquidity in the BTC market has been trending to the downside since the Bitcoin spot ETF was approved.
As a result, and due to the constant selling pressure from the Grayscale Bitcoin Trust (GBTC), the market has been trending to the downside and could maintain this course until the next major macroeconomic event.
On the above, the BitMEX founder stated:
Why has $SPX and $BTC stopped moving up together post US BTC ETF launch? Both are love more $ liq, which one is right about the future? $BTC is telling us that there are hiccups ahead for $ liq, next signpost is 31st Jan US Treasury refunding annc (announcement).
If Bitcoin Goes South, What Levels Could Hold The Line?
A pseudonym crypto analyst showed a cluster of buying orders stacked from the $38,819 to the $40,000 levels in a separate report. In other words, these levels should present opposition and seem like BTC’s biggest opportunity to bounce back, at least on low timeframes.
In that sense, the analyst stated the following, anticipating a possible short-term recovery, and showing the image below:
Some big zones starting to build up around 41K & 42K. Pretty certain we’ll at least take out that top part somewhere next week. Will see if price sustains after that.

Cover image from Unsplash, chart from Tradingview
Bitcoin Slides Below $40K, Now Down Nearly 20% From Post-ETF Euphoria
Analysts at 10x Research are eyeing the $38,000 level for a potential bottom.
Bitcoin Bulls Buoyed by Report of FTX’s $1B GBTC Sale
Flows of fresh investor money into the newly approved spot bitcoin ETFs may be far higher than previously thought.
Hold On For Four Months: Analyst Predicts When Bitcoin Price Will Reach New ATH
Bitcoin has been experiencing a downward trend recently, dropping from its 2023 all-time high of about $49,000 to below $41,000 at the time of writing. Despite this significant price correction, popular crypto analyst Kevin Svenson has predicted a new all-time high for BTC in the months after the 2024 Bitcoin halving.
Bitcoin Anticipated To Hit New All-Time High
Svenson released a YouTube video last week, predicting that BTC’S new all-time high is set for June 2024. Despite the hype surrounding the approval and launch of Spot Bitcoin ETFs, the crypto analyst revealed that Bitcoin has been witnessing significant declines and is currently approaching the critical price level of $40,200.
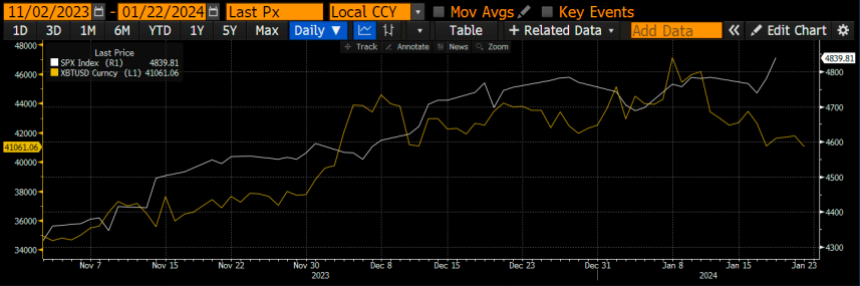
The crypto analyst compared Bitcoin’s price movements with the recent stock market patterns. Last Friday, Wall Street stocks, particularly the S&P 500 index, achieved an all-time high of 4,839.81, surpassing its previous record in January 2022.
Svenson pointed out a significant correlation between Bitcoin and the S&P 500 index in the months leading up to and following the Bitcoin halving. According to the crypto analyst, the last three Bitcoin halvings illustrated a key price pattern for BTC as the stock market hit its all-time high.
The analyst explained that after the first Bitcoin halving in November 2012, the S&P 500 index hit its all-time high, and BTC followed after, recording an all-time high two months later.
Additionally, in the second halving in July 2016, the S&P 500 index achieved a record high, after which Bitcoin hit an all-time high about seven-and-a-half months later. In the third halving in May 2020, the S&P 500 index broke its all-time high in August, with BTC following suit about four months later.
Svenson has suggested that these results reveal a unique correlation between the price of BTC and the S&P 500 index during the halving phases. Using the average time difference observed in the three halving events, he projected the timeline for Bitcoin’s all-time high in the upcoming halving in April 2024.
According to the crypto analyst, BTC is expected to achieve a new record high in approximately four-and-a-half months after the S&P 500 index hits its own all-time high.
BTC Overcomes Critical Price Level
In his video, Svenson disclosed that BTC has successfully bounced off the critical price level of $40,200. He revealed that the cryptocurrency had achieved this feat around the same time the S&P 500 index had recorded its new all-time high.
“Bitcoin is already bouncing, the weekly is now back in the green, and the daily chart, the daily candle is now also back in the green,” Svenson said.
It’s important to note that at the time of writing, the price of Bitcoin was trading at $40,832, reflecting a 2.06% decline in just 24 hours, according to CoinMarketCap. The crypto analyst warned that if BTC had failed to overcome the critical support level, it could have triggered major bearish signals.
Svenson also noted that the recent gains in the stock market presented a positive development for both Bitcoin and altcoins in the crypto market. He stated that the stock market’s new all-time high would enable Bitcoin to effectively secure its critical position while also potentially influencing speculator sentiment positively within the crypto space.
Bitcoin Puell Multiple At Crucial Juncture: Will Retest Save Rally?
On-chain data shows the Bitcoin Puell Multiple indicator is currently retesting a crucial level that may end up deciding the fate of the latest rally.
Bitcoin Puell Multiple Is Now Retesting Its 365-Day Moving Average
As explained by an analyst in a CryptoQuant Quicktake post, the interaction of the Puell Multiple with its 365-day moving average (MA) can indicate trends in the market.
The “Puell Multiple” refers to an indicator that keeps track of the ratio between the daily revenue of the Bitcoin miners (in USD) and the 365-day MA of the same. The mining revenue here is simply the total amount of coins issued by the network inside a 24-hour span multiplied by the spot price of the coin.
When the value of the Puell Multiple is greater than 1, it means that the miners are currently making a higher income than the average value for the past year. Naturally, when this happens, the motive to sell would rise for these chain validators and thus, the BTC price may be considered overvalued.
On the other hand, values under the mark suggest the cryptocurrency’s price may be becoming undervalued as the miners are now making lower revenues than the 365-day average.
Now, here is a chart that shows the trend in the Bitcoin Puell Multiple, as well as its 365-day MA, over the history of the asset:

As displayed in the above graph, the Bitcoin Puell Multiple had naturally spiked to high levels just earlier when the asset’s price had observed its rally, which had naturally resulted in the block rewards of the miners also shooting up.
As the price of the asset has struggled recently, though, the indicator’s value has come back down and is now retesting its 365-day MA. This line has been relevant historically for the metric, as the quant highlighted in the chart.
Generally, a break above the line has proven to be bullish for the cryptocurrency, while a move under can imply a transition towards a bearish trend. As such, Bitcoin might be standing at a crucial juncture right now, at least from the perspective of this indicator.
Last year, the Puell Multiple also witnessed a similar retest at its 365-day MA, as is apparent in the graph. Back then, the metric had ended up finding support at this important line, and the resulting bounce was what led towards the latest rally in the asset.
It now remains to be seen whether the 365-day MA would act as support this time as well or if the indicator would go through a breakdown. In the latter scenario, the Bitcoin price could end up observing a deeper correction.
BTC Price
Bitcoin’s struggle has continued recently as its price has come down to just $40,800.
Analyst Foresees Bitcoin Downtrend Until GBTC Is Liquidated
Chris J Terry, a cryptocurrency analyst and enthusiast, has revealed his insights on the price action of Bitcoin, predicting a continuous decline in the price of the crypto asset.
Analyst Says Bitcoin Will Continue To Drop
The crypto analyst shared his insights regarding Bitcoin with the cryptocurrency community on the social media platform X (formerly Twitter), anticipating a possible “continuation of a flat or declining trend.”
He highlighted that the downtrend will continue until Grayscale Bitcoin Trust (GBTC) is fully “liquidated.” According to him, the liquidation will be possible with a whopping $25 billion worth of selling activity over the next few weeks.
Terry cites Grayscale’s choice to keep Bitcoin ETF fees at 1.5% as the cause of what he sees to be the “biggest strategic error” in cryptocurrency history. This implies that Grayscale’s action might have a long-term impact on the crypto market and may prevent wider adoption.
The post read:
Looks like the BTC price will continue flat/down until GBTC is liquidated, $25B of selling over the next few weeks. Grayscale decision to keep ETF fees at 1.5% will go down as the biggest strategic error in crypto history. Greedy idiots.
His analysis emphasizes how investment vehicles are interconnected and how this affects the state of the cryptocurrency market as a whole. However, this has attracted disbelief from a few famous figures in the community.
One of the figures who has expressed disbelief is Galaxy Digital CEO Mike Novogratz. He asserted that he “disagrees” with Chris Terry’s analysis because although Novogratz experts some selling pressure activity, he believes investors will move to other ETFs, especially supporting BTCO. Novogratz also pointed out that the Invesco Galaxy Bitcoin ETF (BTCO) is his favorite among the products.
Furthermore, Novogratz highlights the significance of maintaining perspective in light of transient market conditions. He noted that the latest development will facilitate older investors’ or boomers’ entry into the crypto landscape.
In addition, he has highlighted the potential for enhanced leverage by having 4×5 exposure to Bitcoin via BTCO. He then shared an optimistic look, noting that “BTC will go higher in the next six months after this indigestion.”
BTC Sees $25 Million Outflows
A recent report from Coinshares has revealed that Bitcoin witnessed an outflow of a whopping $25 million. Coinshares shared the information in its most recent weekly “Digital Asset Fund Flows.”
It also noted a massive $11.8 billion in BTC trading volume last week. According to Coinshares, this is seven times more than the average weekly trading activity recorded in 2023.
There were notable withdrawals from digital asset investment products last week, totaling about $24.7 million. Notably, this spike in trading activity indicates that ETFs account for 63% of all Bitcoin volumes on reliable exchanges.
As of the time of writing, Bitcoin was trading at $40,827, indicating a decline of 2.16% in the past day. Despite the price drop, its trading volume is currently up by over 81% in the last 24 hours.
China’s Currency Woes to Weigh on Bitcoin: Crypto Observer
Measures taken by the People’s Bank of China to cushion yuan against the stock market slide could weigh over bitcoin’s price.
First Mover Americas: Solana, Cardano Lead Losses as Market Starts Week in the Red
The latest price moves in bitcoin [BTC] and crypto markets in context for Jan. 22, 2024. First Mover is CoinDesk’s daily newsletter that contextualizes the latest actions in the crypto markets.
Bitcoin Price Turns Red, Why BTC Could Tumble Below $40K
Bitcoin price started a fresh decline below the $41,250 support zone. BTC is showing bearish signs and might decline heavily below the $40,000 support zone.
- Bitcoin price is gaining bearish momentum below the $41,500 zone.
- The price is trading below $41,500 and the 100 hourly Simple moving average.
- There is a key bearish trend line forming with resistance near $41,320 on the hourly chart of the BTC/USD pair (data feed from Kraken).
- The pair is now at risk of more downsides if it breaks the $40,000 support zone.
Bitcoin Price Resumes Downtrend
Bitcoin price struggled to stay above the $42,200 support zone. However, BTC failed to clear many hurdles and started a fresh decline below the $42,000 level.
There was a move below the $41,500 and $41,250 support levels. The price even spiked below the $40,500 level. A low is formed near $40,369 and the price is now consolidating losses. It is now trading near the 23.6% Fib retracement level of the recent drop from the $42,260 swing high to the $40,369 low.
Bitcoin is now trading below $41,500 and the 100 hourly Simple moving average. Immediate resistance is near the $41,000 level. The first major resistance is near the $41,250 level. There is also a key bearish trend line forming with resistance near $41,320 on the hourly chart of the BTC/USD pair.
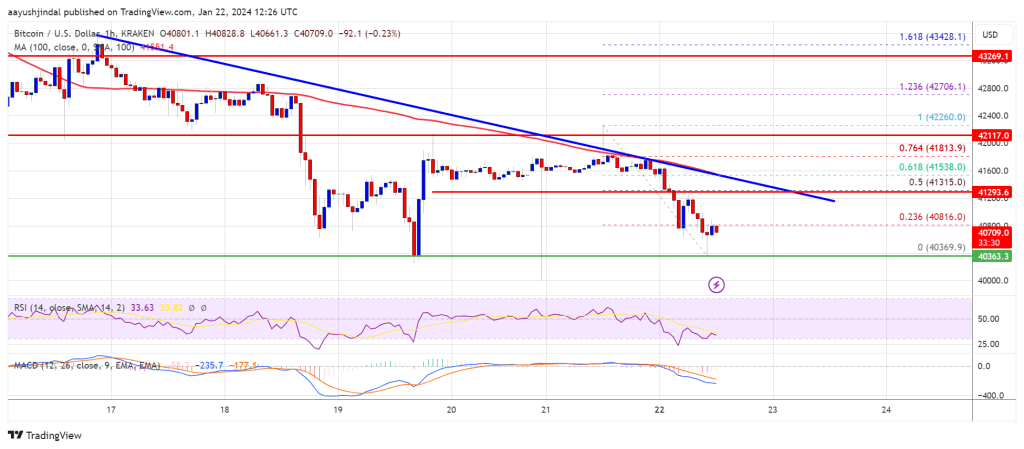
Source: BTCUSD on TradingView.com
The trend line is close to the 50% Fib retracement level of the recent drop from the $42,260 swing high to the $40,369 low. A clear move above the $41,320 resistance could send the price toward the $42,000 resistance. The next resistance is now forming near the $42,200 level. A close above the $42,200 level could push the price further higher. The next major resistance sits at $43,250.
More Losses In BTC?
If Bitcoin fails to rise above the $42,200 resistance zone, it could continue to move down. Immediate support on the downside is near the $40,500 level.
The next major support is $40,000. If there is a close below $40,000, the price could gain bearish momentum. In the stated case, the price could drop toward the $38,500 support in the near term.
Technical indicators:
Hourly MACD – The MACD is now gaining pace in the bearish zone.
Hourly RSI (Relative Strength Index) – The RSI for BTC/USD is now below the 50 level.
Major Support Levels – $40,500, followed by $40,000.
Major Resistance Levels – $41,500, $42,000, and $42,200.


