The S&P 500 look expensive relative to bonds, but that does not imply risk aversion or outflow of money from stocks and crypto and into Treasury notes.
Bitcoin ETFs Flows Could Propel BTC Prices to $112K This Year: CryptoQuant
Spot bitcoin ETFs have amassed more than 192,000 bitcoin in holdings, as of Friday, since their launch nearly a month ago.
Bitcoin Price Reclaims $48K But Can Bulls Pump BTC To $50K?
Bitcoin price climbed higher above the $48,000 resistance. BTC tested $48,800 and is currently showing signs of a downside correction.
- Bitcoin price climbed higher above the $46,500 and $48,000 resistance levels.
- The price is trading above $47,500 and the 100 hourly Simple moving average.
- There is a key bullish trend line forming with support at $48,000 on the hourly chart of the BTC/USD pair (data feed from Kraken).
- The pair could continue to move up unless there is a close below the $48,000 support.
Bitcoin Price Turns Green
Bitcoin price started a major increase above the $45,500 resistance zone. BTC cleared a few hurdles near the $46,000 and $47,200 levels to move further into a positive zone.
The bulls gained strength and were able to pump the price above the $48,000 resistance. It tested the $48,800 zone. A new multi-week high was formed near $48,775 and the price is now consolidating gains. There was a minor decline below the $48,500 level.
The price dipped below the 23.6% Fib retracement level of the recent wave from the $46,602 swing low to the $48,775 high. Bitcoin price is now trading above $47,500 and the 100 hourly Simple moving average.
There is also a key bullish trend line forming with support at $48,000 on the hourly chart of the BTC/USD pair. Immediate resistance is near the $48,500 level. The next key resistance could be $48,800, above which the price could start another decent increase.
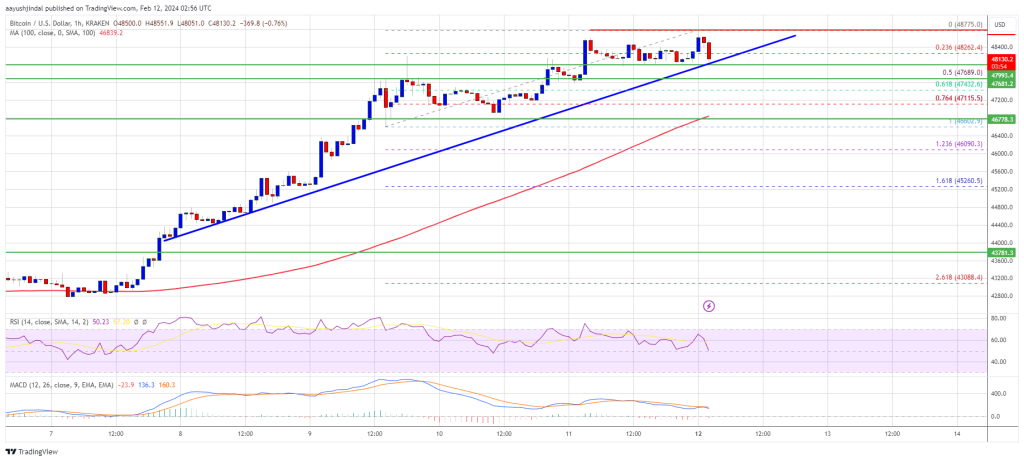
Source: BTCUSD on TradingView.com
The next stop for the bulls may perhaps be $49,250. A clear move above the $49,250 resistance could send the price toward the $49,800 resistance. The next resistance could be near the $50,000 level.
Downside Correction In BTC?
If Bitcoin fails to rise above the $48,800 resistance zone, it could start a downside correction. Immediate support on the downside is near the $48,000 level or the trend line.
The first major support is $47,650 and the 50% Fib retracement level of the recent wave from the $46,602 swing low to the $48,775 high. If there is a close below $47,650, the price could gain bearish momentum. In the stated case, the price could dive toward the $46,500 support.
Technical indicators:
Hourly MACD – The MACD is now losing pace in the bullish zone.
Hourly RSI (Relative Strength Index) – The RSI for BTC/USD is now near the 50 level.
Major Support Levels – $48,000, followed by $47,650.
Major Resistance Levels – $48,500, $48,800, and $50,000.
Bitcoin Price Nears $50,000 Milestone Again With 91% Of Addresses Now In Profit
Bitcoin is edging closer to the $50,000 mark after a week of extreme bullish price action, a level not seen since December 2021. Amidst this price surge, the number of Bitcoin addresses in profit has now crossed over 90%.
According to data from IntoTheBlock, 91% of Bitcoin addresses are currently profitable. This means the vast majority of holders and investors have an incentive to continue holding, particularly as the next halving for Bitcoin miners approaches.
91% Of Bitcoin Addresses Now In Profit As Price Nears $50,000
Bitcoin has had an eventful week in terms of price action. The world’s largest crypto recently grew by 14.4% to reach $48,500 on February 11, its highest point in 26 months. This price spike, although highly welcome, seemed to have taken most investors by surprise considering it was coming off four weeks of unimpressive action after the debut of spot Bitcoin ETFs in the US.
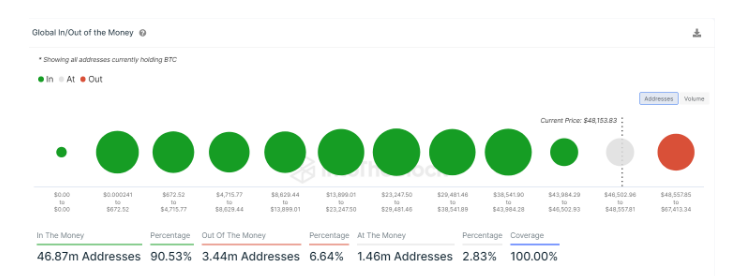
Notably, IntoTheBlock’s “Global In/Out of the Money” profitability metric shows that the total number of addresses in profit is now at 46.87 million addresses, representing 90.53% of the total addresses. At the same time, 3.44 million addresses representing 6.64% are still posting losses, while 1.46 million addresses representing 2.83% of the total addresses are at the money or break-even point.
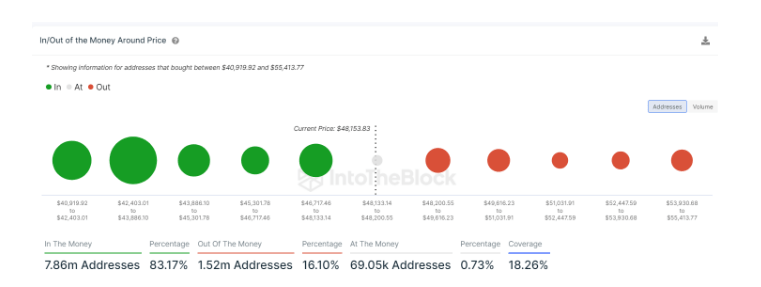
Similarly, IntoTheBlock’s “In/Out of the Money Around Price” metric which follows addresses that bought between $40,919.92 and $55,413.77, shows that a majority (83.17%) of addresses are in profit. This is a hugely bullish signal and shows that the majority of Bitcoin holders are well in the money. As the price continues climbing as the crypto approaches the $50,000 mark, more and more addresses are likely to move into profit.
Bitcoin Set To Keep Shining
With over 90% of Bitcoin addresses now in profit and the price nearing $50,000, it’s clear this bull run still has room to run. The bullish action last week saw BTC closing over $44,000 on the weekly timeframe for the first time in the current market cycle.
BitMEX Research recently reported that spot Bitcoin ETFs now have over $10 billion worth of BTC under management. There is a high probability that the price of the top coin continue to surge if the activity surrounding these exchange-traded funds (ETFs) continues at this pace.
Bitcoin ETF Flow – 9th Feb
All data out. Strong day at $541.5m of net inflow
Invesco had an outflow, the first non-GBTC product to have an outflow day pic.twitter.com/UCFDVAaKD3
— BitMEX Research (@BitMEXResearch) February 10, 2024
Another catalyst for a sustained price increase is the upcoming halving. Historically, Bitcoin bull runs leading up to each halving have always trended up and gone parabolic after the halving event. A similar trend could see the crypto asset reaching $60,000 before the next halving in April and $100,000 before the end of the year.
Featured image from Adobe Stock, chart from TradingView
Bitcoin Price Forecast: Analyst Predicts $100,000 Peak Before Halving Event
Crypto analyst Adam Back believes there is a chance Bitcoin (BTC) could hit the $100,000 price mark ahead of the halving event in April. This prediction comes as Bitcoin continues its recovery from a rather bearish January. Data from the price tracking site, CoinMarketCap, reveals that BTC’s price gained by 11.02% in the last week, moving into the $47,000 zone.
Dual Bull Cycle? Analyst Forecasts Bitcoin Bull Run Pre-Halving
In a post on X on February 10, Adam Back shared a Bitcoin price forecast in which he predicted the digital asset to attain a new all-time high (ATH) price before the much-anticipated halving event on April 12, 2023. Back based his projections on Bitcoin’s historical price data stating that just like on Friday, BTC crossed the $47,000 mark on October 1, 2021, in what would be a 41-day journey to its current ATH of $69,045.
1st oct 2021 #bitcoin crossed $47k like yesterday, then on it’s way to the $69k ATH. that run-up took 41 days. there are 70 days to the halving. just another data point for what it looks like, and how we may yet get a new ATH or even $100k before the halvening. pic.twitter.com/jmtQIHcenR
— Adam Back (@adam3us) February 10, 2024
The analyst explained that he anticipates that BTC will maintain its present upward trajectory, embarking on a bull run to possibly notch a new ATH within the next 70 days leading up to the Bitcoin halving event. Back’s price prediction comes across as somewhat unique as, historically, the Bitcoin bull run usually occurs months after the halving event.
However, the crypto analyst explains in subsequent responses to certain X users that he anticipates the recent launch of the Bitcoin spot ETFs to induce a bull run before the halving event. Following a rather rocky launch, the Bitcoin spot ETF market appears to have finally found its expected rhythm, with consistent positive net inflows recorded throughout last week.
Notably, on Friday, the budding ETF market experienced a total net inflow of $541.5 million, second only to the $655.3 million recorded on the first trading session on January 11. In addition, Grayscale’s GBTC continues to see a consistent decline in outflows recording a new low of $51.8 million.
Adam Back predicts that a consistent development of the Bitcoin spot ETF market over the next few weeks could trigger a bull run pre-halving, causing the asset to potentially reach the $100,000 price mark. In addition, the analyst supports Bitcoin still to repeat its bull run months after the halving event, painting a dual bull cycle.
BTC Price Overview
At the time of writing, Bitcoin trades at $47,716, reflecting a 0.88% gain in its price over the last day. However, the token’s daily trading volume is down by a staggering 59.68% and is valued at $15.92 billion. Meanwhile, BTC continues to dominate the crypto market with the largest asset market cap of $936.17 billion.
BTC trading at $47,668 on the daily chart | Source: BTCUSDT chart on Tradingview.com
Crypto Analyst Says Bitcoin At $100,000 Not Far Off, Here’s When
Kevin Svenson, a crypto analyst on YouTube, recently provided an analysis of the future price trajectory of Bitcoin, predicting a strong surge to $100,000 this year. According to the analyst, BTC is poised to go parabolic after its halving in April as the crypto is looking very bullish on the weekly chart.
The halving cuts the block reward for Bitcoin miners in half, reducing the supply of new Bitcoins in circulation. With demand remaining steady or increasing, the reduced supply has been historically known to drive up the price of BTC.
Bitcoin Parabolic Surge Not Far Off
Bitcoin is currently leading a crypto market surge after four weeks of lackluster action following the launch of spot Bitcoin ETFs in the US. Bitcoin recently broke above $47,000 for the first time this year, pushing the narrative of the return of a strong crypto market bull run.
Svenson noted in his YouTube video that Bitcoin is yet to close above $44,000 on the weekly timeframe this year. However, recent price action indicates this is about to change, giving the highest weekly close so far in the current cycle. The analyst noted that if Bitcoin were to successfully clear trapped liquidity around the wicks, it could lead to the crypto reaching the first step of the $60,000 price level.
On a larger timeline, Svenson looked at past Bitcoin halvings to note a recurring trend before and after each halving. History shows that the price of BTC has always trended up in the months leading to the halving and then going on a parabolic trend in the months after.
Of course, past performance does not necessarily guarantee future price action, but Svenson believes several factors are lining up that could send Bitcoin surging past its all-time high once again.
“There’s no reason for me to not think that we’re just going to do what we’ve been doing in these past cycles,” he said.
Now, looking forward, the analyst noted past halvings were set up by Satoshi to correlate with election years in the US, which have always led to a spike in the financial markets.
In addition, Svenson mentioned that the profitability of Bitcoin has always increased until 80 weeks following each halving, which marks the beginning of a new bear market. If history repeats itself, an 80-week timeline after the upcoming halving should be around October 2025, which is when a new bear market cycle is expected to begin.
Institutional interest in Bitcoin is surging, contributing to a 9.57% surge in the past seven days. Bitcoin is trading at $47,211 at the time of writing.
JUST IN: #Bitcoin ETFs are the most successful ETFs 1 month after launch EVER!
(out of 5,535 total launches in 30 years)
They hold the #1 ($IBIT), #2 ($FBTC), #20 ($ARKB), and #22 ($BITB) spots.
And there is still 2 days left. pic.twitter.com/NAVoyraPHT
— Swan Media (@Swan) February 9, 2024

Bitcoin Back Above $48,000 – Is This Level The Springboard To $52,000?
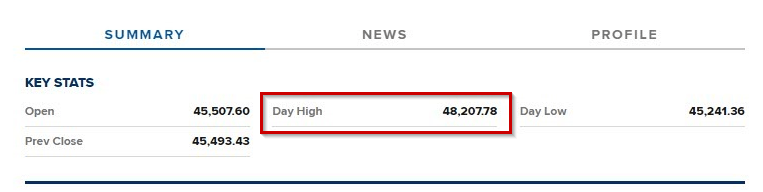
Bitcoin roared back this week, clawing its way to $48,207 – its highest point since early January. This fiery ascent follows weeks of muted trading, fueled by concerns about institutional outflows and a post-ETF price dip. But what’s sparking this sudden surge? And can the digital dragon overcome its next hurdle?
Positive Winds Fill Bitcoin’s Sails
Several factors are propelling Bitcoin’s recent rally:
- Spot ETF Momentum: The long-awaited launch of spot Bitcoin ETFs in January might be finally delivering on its promise. Potential inflows and positive sentiment surrounding these new investment vehicles are driving interest.
- Halving Horizon: The Bitcoin halving, scheduled for May 2024, looms large. Historically, this event, which reduces the rate of new Bitcoin creation, has been linked to price increases, fueling investor optimism.
- Market Synergy: The S&P 500’s recent ascent to record highs seems to be spilling over to the crypto market, creating a wave of positive momentum.
- Lunar Luck? Bitcoin often experiences gains around the Chinese New Year, and this year is no exception. The “Year of the Dragon,” with its auspicious connotations, adds another layer of bullish sentiment.
- ETF Absorption of Selling Pressure: Several ETFs have absorbed over a billion dollars worth of Bitcoin selling pressure in recent weeks, indicating underlying demand despite pre-ETF concerns.
But Can Bitcoin Slay The Resistance Dragon?
While the outlook seems bright, challenges remain:
- Resistance at $48,500: Bitcoin faces a crucial resistance level at $48,500. Breaking through this barrier is key for a potential new all-time high.
- Post-ETF Sell-off: Despite the recent surge, Bitcoin remains below its pre-ETF highs, sparking concerns about a potential sell-off after the initial excitement fades.
- Volatility Reigns: Crypto remains a notoriously volatile asset, and predicting future price movements is fraught with difficulty.
Experts Weigh In: Bitcoin At $52K
Sylvia Jablonski, CEO of Defiance ETFs, attributes the price appreciation to “recent inflows into the spot ETFs, the prospect of the halving, and general market momentum.” However, she cautions that breaking through resistance levels is never guaranteed, and investors should approach any investment with caution.
Meanwhile, Markus Thielen, the founder of 10x Research and head of research at Matrixport, predicted more rise in bitcoin prices using Elliott Wave theory, a technical study that makes the assumption that prices move in repeating wave patterns.
The idea states that price trends evolve in five stages, with waves 1, 3, and 5 serving as “impulse waves” that indicate the primary trend. Retracements between the impulsive price movement occur in waves two and four.
According to Thielen, BTC has begun its final, fifth impulsive stage of its uptrend, aiming to reach $52,000 by mid-March, after completing its wave 4 retracement and correcting to $38,500.
Featured image from Adobe Stock, chart from TradingView
Bitcoin Price Faces Threat As Analyst Foresees $55 Million Liquidation
According to data from CoinMarketCap, Bitcoin (BTC) has maintained its upward price trajectory over the last day, gaining by 4.04% to briefly trade above the $48,000 mark. As BTC now hovers around the $47,100 price zone, investors and market experts remain highly speculative about the token’s next action. On that note, popular analyst Ali Martinez has called a major prediction that could spell weighty losses for many investors.
Liquidity Hunters Target $45,810 In Potential Bitcoin Price Manipulation Plot
In an X post on Friday, Martinez predicted an incoming dip in Bitcoin’s price driven by a planned liquidation. Using data from the cryptocurrency futures trading platform, CoinGlass, the analyst stated the Bitcoin liquidation heatmap indicated that there is potential strategic liquidation in play.
According to the #Bitcoin liquidation heatmap, there’s a potential strategy unfolding where liquidity hunters could drive the price of $BTC down to $45,810. This move is aimed at triggering liquidations amounting to $54.73 million! pic.twitter.com/monFlZmvQ6
— Ali (@ali_charts) February 9, 2024
Martinez stated that liquidity hunters in the BTC market could be looking to push the token’s price as low as $45,810 for personal benefits. For context, liquidity hunters are traders or investors who actively seek opportunities in the financial markets to exploit changes in liquidity.
This set of market players often targets specific price levels where there is a concentration of stop-loss orders or where market liquidity is expected to be thin. By triggering liquidations or capitalizing on price movements, liquidity hunters aim to profit from short-term market inefficiencies.
According to Martinez, the liquidity hunters in the BTC market are currently looking to induce an estimated 3% decline in the token’s price. While this change may seem minimal, it represents an astounding $54.73 million in liquidations. Based on these numbers, BTC traders and investors should be wary of potentially significant losses in the coming days.
BTC Price Overview
The premier cryptocurrency has recently taken flight, gaining by 8.6% in the last two days after a flat period of consolidation stretching to the beginning of February. Interestingly, the asset’s pathway to higher gains appears more confident with recent developments in the Bitcoin spot ETF market, which recorded a total net flow of $403 million on February 8 – the highest value of that metric since January 17.
At the time of writing, Bitcoin trades at $47,238, with a 0.26% gain in the last hour. Meanwhile, the coin’s daily trading volume has soared by 56.33% and is now valued at $39.42 billion. In addition, BTC maintains its top spot in the crypto market with a total market cap of $924.67 billion.
BTC trading at $47,229 on the daily chart | Source: BTCUSDT chart on Tradingview.com
Can Bitcoin Overcome Past Trends? Examining The Pre-Halving Rally And Resistance Levels
Bitcoin (BTC), the largest cryptocurrency in the market by trading volume and capitalization, has embarked on a renewed bullish uptrend, reclaiming previously lost territories and surpassing resistance levels, igniting optimism among investors.
Currently trading just below its 25-month high of $49,000 at $47,900, Bitcoin has experienced a remarkable price increase of over 6% within 24 hours and a significant 11% surge over the past seven days.
Mapping BTC’s Path Amidst Pre-Halving Rally
However, amidst the market’s excitement, it is crucial to consider historical tendencies and their potential impact on Bitcoin’s trajectory leading up to the upcoming halving event. Market expert and analyst Rekt Capital highlights two noteworthy historical patterns:
Firstly, the “Pre-Halving Rally” phase appears to be commencing. This phase refers to a period where Bitcoin experiences a surge in price before the halving event takes place.
Secondly, historical data reveals that Bitcoin has struggled to break beyond the macro diagonal resistance before the halving, which Rekt places at $47,000. Additionally, it has encountered difficulty surpassing its Four Year Cycle resistance, which is approximately $46,000 in the current cycle.
It is worth noting that even though the price has surpassed these resistance levels, a consolidation or continuation of the uptrend must be seen, as a retracement could take place and leave the BTC price stuck between these resistances.
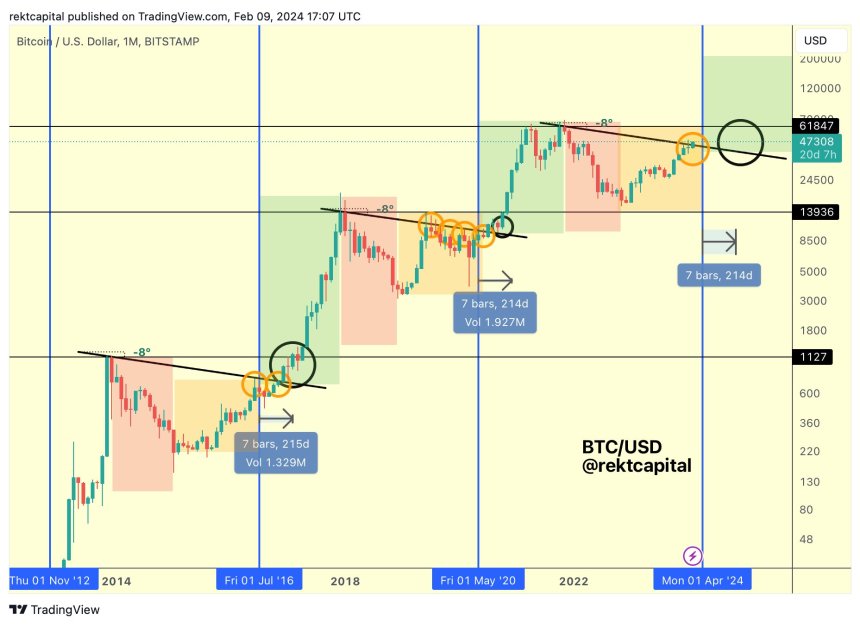
Given these historical trends, exploring how Bitcoin could potentially reconcile these patterns is interesting. Rekt Capital offers insights into one possible path that Bitcoin could take:
During the pre-halving rally phase, Bitcoin may produce limited upside, resulting in an upside wick at the end of February. This pattern has been observed in previous months and 2019.
Following this, Bitcoin might establish another range at higher price levels in March, potentially allowing altcoin rallies to take center stage. Finally, a few weeks before the halving event, Bitcoin could experience a pullback, creating a pre-halving retrace.
This proposed path suggests that Bitcoin could surpass the Macro Diagonal resistance with an upside wick but remain below it in terms of end-of-month monthly candle closes during this gradually concluding pre-halving period.
Bitcoin Bull Run Indicator Flashing Buy Signal
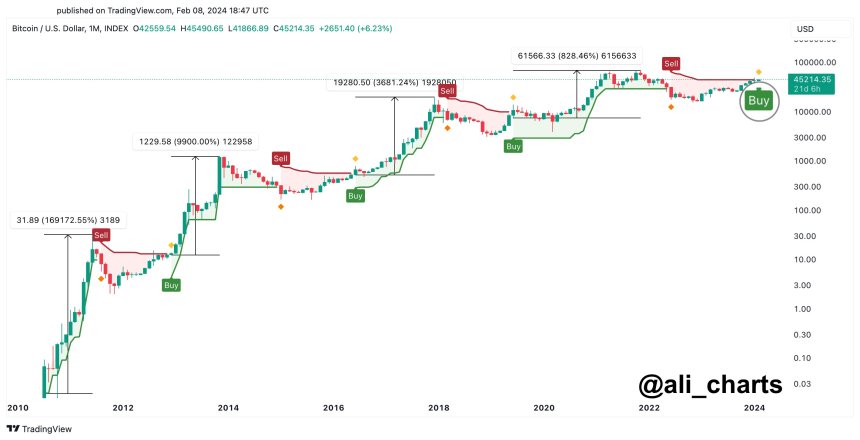
Crypto analyst Ali Martinez has added to the growing bullish sentiment surrounding Bitcoin by highlighting a key indicator that suggests potential upside movement.
According to Martinez, the Super Trend indicator flashed a buy signal on the BTC monthly chart. This tool is renowned for its precision in predicting bullish trends in Bitcoin markets.
The indicator’s track record underscores the significance of this buy signal. Martinez points out that the Super Trend has issued four buy signals since Bitcoin’s inception, and all four have been validated, leading to substantial gains. These gains amount to an impressive 169,172%, 9,900%, 3,680%, and 828%, respectively.
However, amidst the bullish outlook, Martinez also highlights a potential strategy that may soon impact Bitcoin’s price.
According to the Bitcoin liquidation heatmap, a scenario is unfolding where liquidity hunters could drive the price of Bitcoin down to $45,810. The intention behind this move would be to trigger liquidations amounting to a substantial $54.73 million.
It is important to understand that liquidity hunters aim to exploit price movements to trigger forced liquidations among overleveraged traders. By strategically driving the price down, they can force these traders to sell their positions, resulting in cascading liquidations that potentially amplify price downward movements.
Featured image from Shutterstock, chart from TradingView.com
Finance Expert Drops Grim Prediction For US Economy, Says Bitcoin Is The ‘Parachute’
The United States economy and where it might be headed has been a hot topic of debate among finance experts, with some recommending Bitcoin as a safe haven. One of those who has continued to tout BTC as the answer is renowned finance author Robert Kiyosaki, who has made a gloomy prediction for the US economy.
The Economy Is Coming Down
In a post made on X (formerly Twitter), Robert Kiyosaki, who is widely known for his best-selling finance book titled ‘Rich Dad Poor Dad’, warned investors of an impending crash. According to Kiyosaki, a lot of investors would end up losing their money as they do not know what to do with it.
He compared the current situation to flight students in the US Navy being taught how to fly and also how to crash. However, it seems that there is no easy option for investors going forward, as he calls for a “bail out.”
The finance expert warns that banks as well as the US economy will crash, and “We are not going in for a soft landing.” In light of this, he steers investors toward other forms of wealth preservation, which are Gold, Silver, and Bitcoin.
As much as the finance author expects that the crash will be brutal, he believes that by being in the three assets mentioned above, then investors can have “parachutes for your personal soft landing.”
Strong Advocate For Bitcoin
Kiyosaki is not new to pushing Bitcoin as an alternative to traditional cash and investment vehicles. Over the last year, the finance expert has warned that the US economy is headed for doom and as always, pushes the likes of Gold, Silver, and Bitcoin as an answer to the ‘inevitable crash.’
The author has also provided incredibly bullish predictions for the BTC price going forward, which he expects to rise more than 300% from here. According to Kiyosaki, Bitcoin will rise as high as $150,000 post-Spot Bitcoin ETFs approval, and with the price inching toward $50,000 already, it seems Kiyosaki’s prediction may end up playing out.
Kiyosaki has also presented Bitcoin as a safe haven at a time when there is widespread political discontent. He has also publicly declared his dislike for the current President, Joe Biden, who he believes is weak and a terrible president.
In order to fight back, the finance author suggests that investors move their assets into Gold, Silver, and Bitcoin which cannot easily be controlled by the government. He also believes BTC is the “best protection” against hyperinflation, which he expects to happen soon.
Bitcoin Flies Above $47,300, But Watch Out For Extreme Greed
Bitcoin is finally showing a sustained bullish push as it has now broken above $47,300, but overly positive sentiment can be an obstacle to this rally.
Bitcoin Fear & Greed Index Suggests Market Is Nearing Extreme Greed
The “Fear & Greed Index” is an indicator that tells us about the general sentiment among the investors in the Bitcoin and wider cryptocurrency sector. According to Alternative, its creator, the index takes into account five factors to calculate this sentiment.
These are volatility, market volume, social media sentiment, market cap dominance, and Google Trends. The index outputs the sentiment as a number lying between zero to hundred.
All values of 46 and under imply the investors are fearful, while those of 54 or over suggest the presence of greed in the market. The region between 47 and 53 corresponds to the region of neutral sentiment.
Now, here is what the Fear & Greed Index looks like for Bitcoin right now to see which of these regions the market stands in at present:
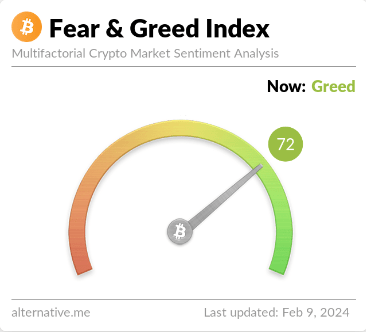
As is visible above, the Bitcoin Fear & Greed Index has a value of 72 at the moment, implying that the majority of the investors in the space share a greedy mentality.
Besides the three core sentiments mentioned earlier, there are also two extreme ones: the extreme fear and extreme greed. The former of these occurs at values of 25 and under, while the latter takes place at 75 and above.
Historically, these two sentiments, in particular, have held great significance for the cryptocurrency’s trajectory. Generally, at any point, the asset is more likely to move against the expectations of the majority, and in these extreme regions, this expectation becomes the strongest.
As such, these sentiments have been where major reversals in the asset have been the most likely to occur. Followers of a trading philosophy called “contrarian investing” exploit this fact to time their buying and selling moves. Warren Buffet‘s famous quote sums up the idea, “Be fearful when others are greedy, and greedy when others are fearful.”
At a value of 72, the Bitcoin market is quite close to entering into the extreme greed region right now. Just yesterday, the metric had a value of 66, which means there has been some jump in just the past 24 hours.
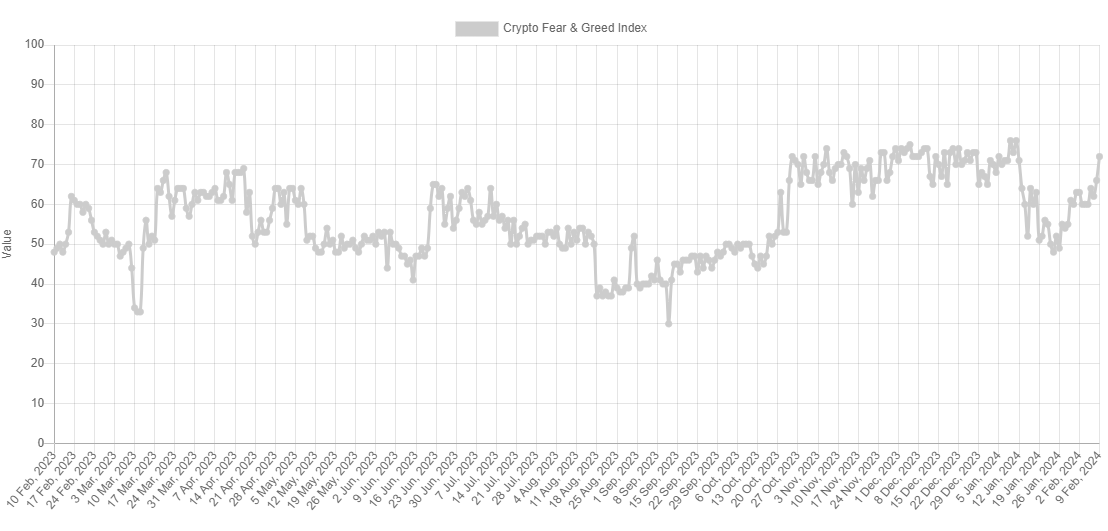
This increase in the index has naturally come because of the bullish momentum that the asset has enjoyed in the past day. Any further improvements in sentiment, however, may be alarming, as the metric would then enter into the extreme greed territory.
The last time that the Bitcoin Fear & Greed Index surged into extreme greed values was around the time of the approval of the spot exchange-traded funds (ETFs). As it happened, the coin hit its top, coinciding with this overly bullish mentality.
Thus, if this precedence is anything to go by, any visit into the territory in the coming days may serve as a warning that a top is near for the cryptocurrency.
BTC Price
Bitcoin has enjoyed an uplift of over 6% during the past 24 hours as its price has cleared the $47,300 level.
Bitcoin Supply On Exchanges Has Dropped To A 6-Year Low, What This Means For Price
Bitcoin broke over the $46,000 level twice in the past 24 hours for the first time since the approval of spot Bitcoin ETFs by the SEC, signaling a bullish return into most cryptocurrencies spearheaded by BTC. In particular, Bitcoin investors seem to be gearing up for action as the next Bitcoin halving approaches with an interesting time of withdrawal from exchanges.
Serious money has been on the move from exchanges in the past 30 days, as shown by on-chain data. As a result, the Bitcoin balance across various exchanges has seen a drastic drop to the lowest level in six years.
Percentage Of Bitcoin Supply On Exchanges Drops To Lowest Level Since 2017
A large portion of Bitcoin holders have been holding onto their coins for the long haul. According to IntoTheBlock data, about 69% of Bitcoin holders have been holding their coins for longer than one year.
Data from the on-chain analytics platform Santiment also showed that the supply of Bitcoin on exchanges recently dropped to 5.3% of the total circulating supply for the first time since December 2017, indicating 94.7% of the supply is currently in private custody. This metric is particularly interesting, considering BTC’s total circulating supply has grown by 2.84 million since December 2017.
As shown in Santiment’s chart, the supply on exchanges has been on a free fall since January 10, around when the first spot Bitcoin ETFs went live in the US. This isn’t surprising, as the sentiment around Bitcoin turned fully bullish during this period despite a prolonged price struggle.
#Bitcoin‘s price dominance has continued to grow over #altcoins, as its market value surged as high as $45.5K today. Traders remain skeptical toward the asset for a 3rd straight week. This is the lowest ratio of $BTC on exchanges since December, 2017. https://t.co/XC3UK258lM pic.twitter.com/4MwvXE28RC
— Santiment (@santimentfeed) February 8, 2024
In a similar manner, whale transaction tracker Whale Alerts has disclosed large bouts of BTC exiting crypto exchanges to private wallets in the past month. Notably, Bitcoin’s dominance over altcoins has gained ground, with the institutional demand for Bitcoin post-ETF approval also surging.

— Whale Alert (@whale_alert) February 8, 2024
This mass BTC exodus from crypto exchanges signals that long-term holders feel more comfortable keeping their coins in self-custody rather than on exchanges.
The total Bitcoin withdrawals from exchanges in the past seven days were to the tune of $8.64 billion, outpacing a $8.42 billion inflow by $220 million. Wallets holding more than 1,000 BTC have also accumulated 1.03% of the total circulating supply in the past month.
Withdrawals from exchanges are generally a good phenomenon for crypto assets, as they reduce the amount of cryptocurrencies readily available for sale. Fewer BTC available means less selling pressure and the opportunity for the value to go up based on supply and demand.
At the time of writing, Bitcoin is trading at $46,250, up by 4% in the past 24 hours and 7.15% in the past seven days. The cryptocurrency is currently aiming for the $50,000 mark, which it can reach very soon if the accumulation strategy continues.
Bitcoin Tops $47K as Spot Bitcoin ETFs Book One of Their Best Days
Spot bitcoin ETFs attracted Thursday their third-largest net inflows since debut, increasing their holdings by 9,260 BTC.
Analyst: After Bitcoin Hits $50,000, Expect Another 100% to 200% Rally
David Krueger, a crypto analyst on X, thinks Bitcoin (BTC) will tear higher, surging by 100% to 200% within five months, fueled primarily by fear of missing out (FOMO) once the coin breaks above $50,000.
Will Bitcoin Break Above $50,000 And Rally To $100,000?
Citing Tom Lee’s historical analysis, Krueger believes FOMO typically kicks in when Bitcoin trades above a price level “exceeding 97% of its historical days.” Lee is the co-founder and researcher at Fundstrat.
Zooming at the development in the monthly chart, the analyst notes that this price point sits at $50,000, a key psychological level that bulls have failed to overcome since the bull run from mid-November 2023.
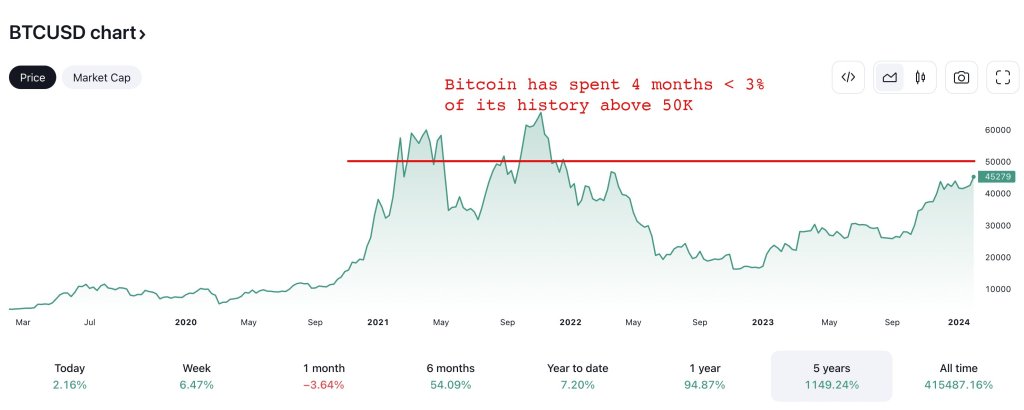
Accordingly, if Lee’s analysis and the analyst’s assertion come true, BTC prices will likely float higher in the sessions ahead. However, what’s unclear is when BTC will clear this $50,000 level, paving the way for $100,000 and even $200,000 five months after the decisive breakout.
When writing, BTC prices are firm and rallying. The coin is trending above $46,500 and will likely clear above January 2024 highs of around $48,700. Even so, whether the current uptrend will cause excitement, possibly creating FOMO, is yet to be seen.
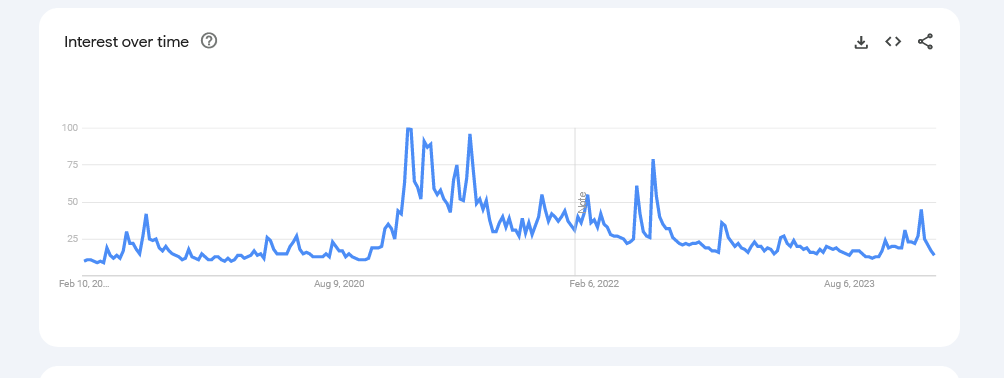
Looking at Google Trends data and organic search related to Bitcoin, interest is fizzling out. Data shows that the number of people searching for Bitcoin in the United States has dropped and is at around early 2021 levels. Even so, around that time, Bitcoin prices began trending higher, eventually rising to as high as $69,000.
Halving And Spot ETF Issuers Loading Up More Coins
While FOMO appears elusive at spot rates, another analyst offers a different perspective. In response to Krueger’s outlook, the analyst notes that sharp interest in Bitcoin historically arrives around six months after halving, lasting up to 18 months. This event and steady or increasing demand create a supply-demand imbalance that may pump prices.
Bitcoin will halve its miner rewards in early April 2024. It is an event that may anchor bulls, setting the base for more gains as projected by analysts.
The coin might also edge higher considering the pace at which spot Bitcoin exchange-traded fund (ETF) issuers have been buying BTC in the past few weeks since the product was approved in mid-January 2024.
With Wall Street players like Fidelity, BlackRock, and other crypto firms like Bitwise loading up more coins, BTC will likely be more scarce than it has been after past halving events.
Expert Predicts Bitcoin Price Rally To $58,000, Here’s Why
Charles Edwards, the founder of Capriole Investments, has recently provided an analysis in Capriole’s Update #13, predicting a significant upswing in the Bitcoin price to $58,000. His forecast is rooted in a detailed examination of market trends, ETF developments, technical patterns, and fundamental indicators.
In-Depth Market Analysis Of The Bitcoin Market
The analysis begins with a detailed look at the market’s recent behavior, focusing on the aftermath of Bitcoin ETF launches. Edwards points out, “Two months of chop and ETF readings under the microscope appears to be resolving to the upside as of writing.”
He highlights the significant shift in momentum following the initial “sell the news” reaction to the ETF launches, noting a considerable decrease in outflows from the Grayscale Bitcoin ETF. This change, according to Edwards, aligns with his previous predictions.
Furthermore, Edwards highlights the massive success of Blackrock and Fidelity’s Bitcoin ETFs (IBIT and FBTC), which have collectively absorbed over $6 billion in assets in less than a month. This achievement not only underscores the ETFs’ historic launch success but also signals a broader acceptance of Bitcoin within the traditional finance sector.
“Bitcoin [is] the most successful ETF launch in history by a very wide margin,” Edwards notes, referencing data from Eric Balchunas to emphasize the unprecedented scale of Bitcoin’s entry into the ETF market.
Here's a look at the Top 25 ETFs by assets after 1 month on the market (out of 5,535 total launches in 30yrs). $IBIT and $FBTC in league of own w/ over $3b each and they still have two days to go. $ARKB and $BITB also made list. pic.twitter.com/Yyi1nxukUk
— Eric Balchunas (@EricBalchunas) February 8, 2024
A major milestone in Bitcoin’s institutional adoption is Fidelity’s decision to include Bitcoin in its “All-in-One Conservative ETF.” Edwards considers this move a significant endorsement of Bitcoin’s value as an investment asset, stating, “Bitcoin is finally being acknowledged in traditional investment vehicles.”
He predicts that this could set a precedent, with most major ETFs likely to allocate between 1-5% to Bitcoin in the next 12-24 months, emphasizing the critical importance of this development for Bitcoin’s mainstream acceptance.
Technical Outlook And BTC Price Prediction
Turning to the technical analysis, Edwards points out the bullish trend that has taken shape, with Bitcoin breaking past the $44,000 resistance level. This breakout, according to Edwards, is a strong indicator of the market’s bullish sentiment and a precursor to further gains.
He notes, “The Weekly closing above $47K mid-range bound on Sunday would give a great technical confirmation of a new bullish trend,” highlighting the significance of this level as a determinant of the market’s direction.
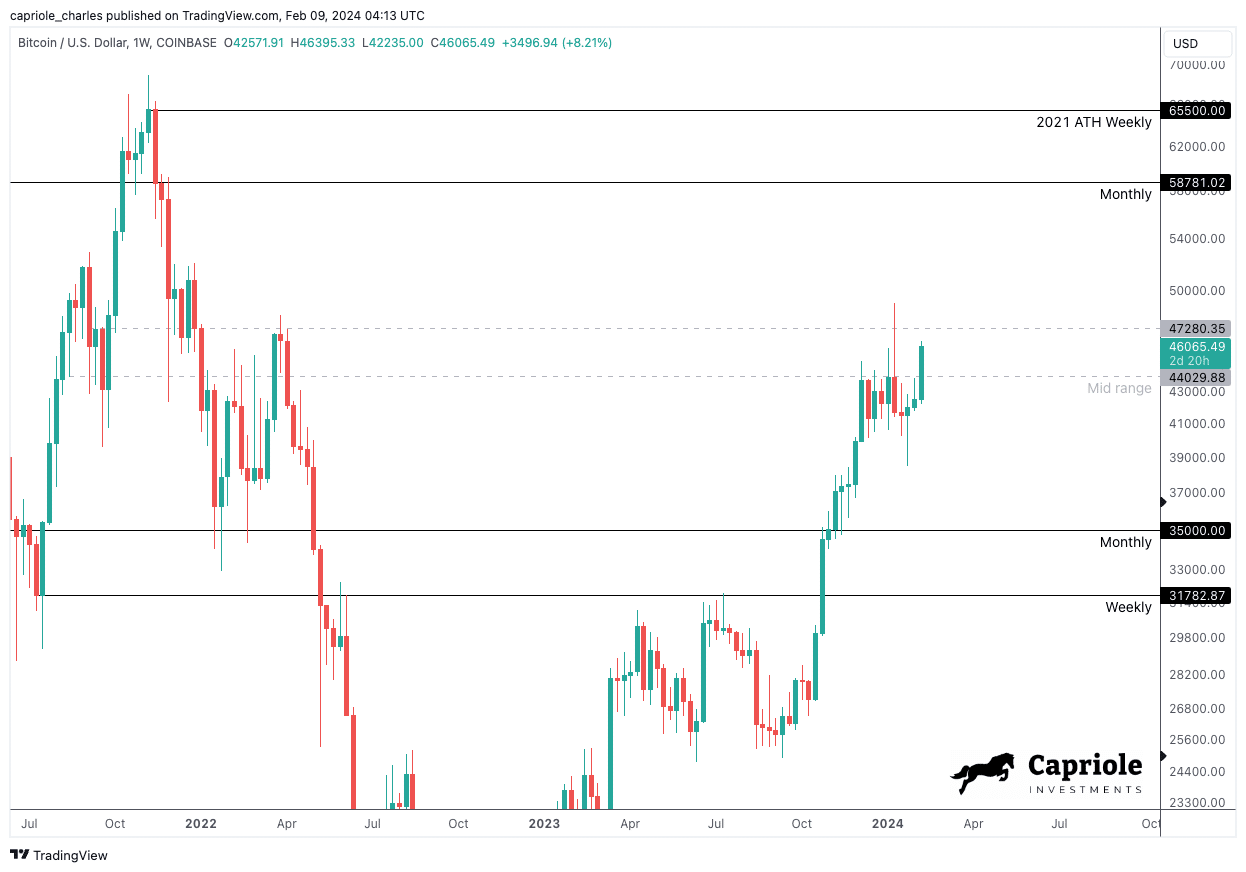
Furthermore, Edwards elaborates on the low timeframe technicals, indicating a measured move towards the monthly resistance, which presents an attractive risk-to-reward (R:R) setup for investors. This technical breakout, combined with the strategic management of risk, underscores the potential for significant price appreciation in the near term.
A clean breakout on the daily timeframe of the $44K resistance is suggestive of a measured move to Monthly resistance. This is a good R:R setup. ‘Risk’ can be easily managed (a close back into the range at $44K would be a logic stop) with “Reward” 3-4X higher at $58-65K.
Fundamentals Turn Bullish
The foundation of Edwards’ bullish outlook is also built on a robust analysis of fundamentals and on-chain data. The Capriole’s Bitcoin Macro Index, which aggregates over 50 Bitcoin-related metrics into a single model, plays a crucial role in this analysis.
“The fundamental uptrend resumed on Wednesday which is also supportive of continuation of the technical move. We want to see on-chain fundamental growth continue with price to support confirmation of this mid-range breakout. Monday’s reading will be particularly important,” Edwards states.
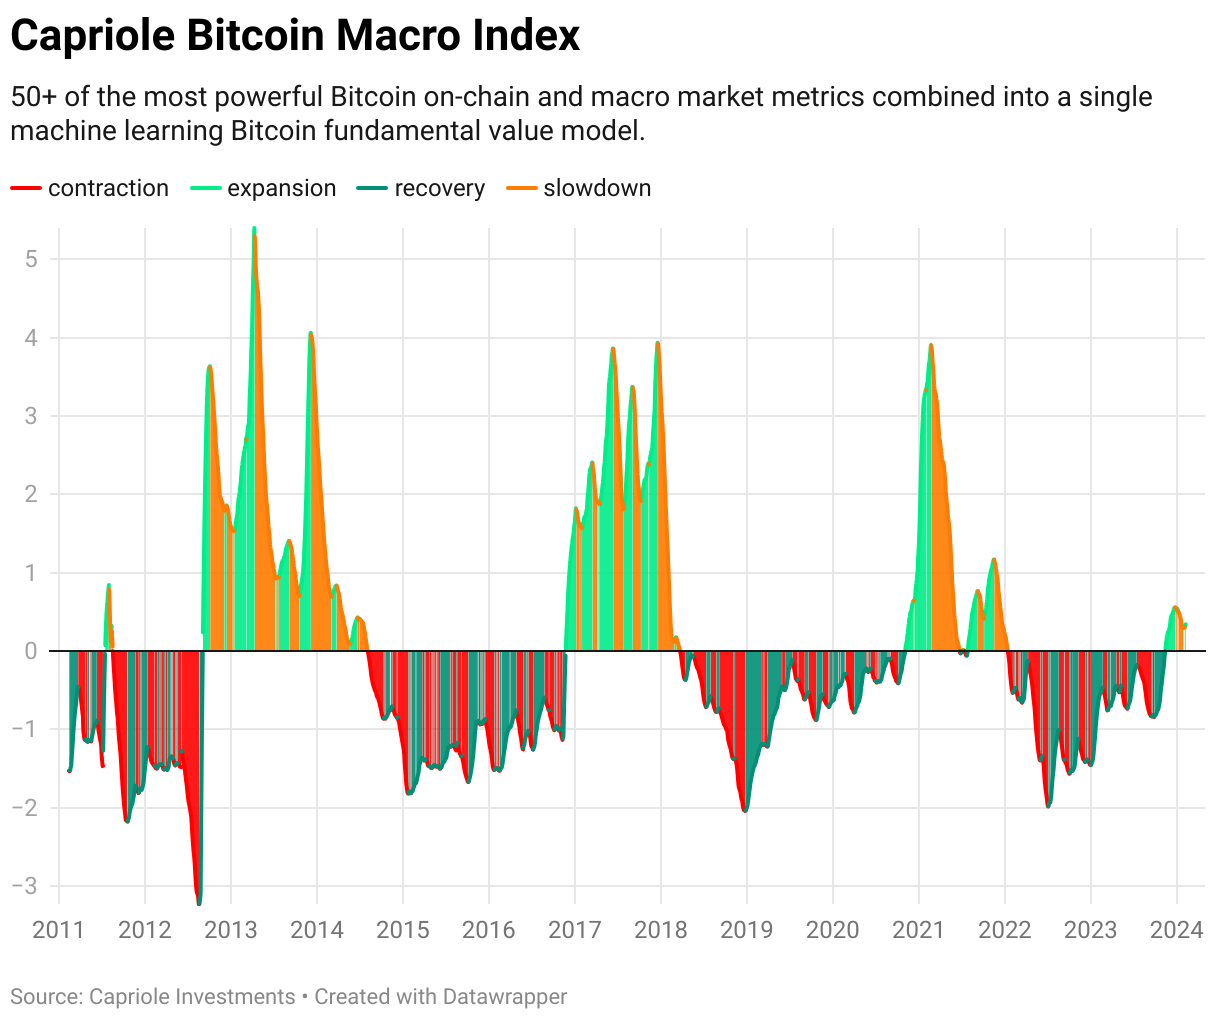
Edwards’ analysis concludes on a bullish note, with a clear technical breakout and a transition of on-chain fundamentals into growth territory. “ETF FUD cleared. A Technical breakout on the daily timeframe and on-chain fundamentals transitioning into growth,” he summarizes, pointing towards a strong start to February and setting an optimistic tone for Bitcoin’s short-term future.
At press time, BTC traded at $46,790.
First Mover Americas: Bitcoin Seen Topping $50K This Weekend
The latest price moves in bitcoin [BTC] and crypto markets in context for Feb. 9, 2024. First Mover is CoinDesk’s daily newsletter that contextualizes the latest actions in the crypto markets.
Crypto Stocks Rally Pre-Market as Bitcoin Tops $46K
Bitcoin climbed over $46,000 for the first time in nearly a month early Friday, extending its gain for the week to nearly 10%.
Bitcoin Crosses $46K as Year of ‘Long’ Begins, Easing ETF Selloff
Over the next few days, East Asia will celebrate the start of the year of the dragon, which is considered to be one of the luckiest and most prosperous animals in the Chinese Zodiac.
Boom! Bitcoin Barrels Past $46,000, Eyes $50K As Bullish Sentiment Returns
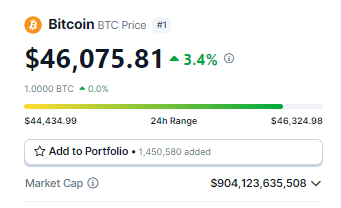
For the first time since the spot ETFs’ debut trade on January 11, Bitcoin (BTC) has surpassed $46,000. According to data from Coingecko, BTC had increased 3.4% in the previous day to $46,075 at the time of publication, maintaining a 6% increase over the previous seven days.
Bitcoin Flexes Muscles, Reclaims $46K Level
Despite the approval of several eagerly awaited exchange-traded funds that were meant to strengthen its institutional legitimacy, Bitcoin’s 2024 has had a rough start. However, things are improving as Bitcoin is now again trading above the $46k territory.
 Laurent Ksiss, a specialist in crypto Exchange-Traded Products (ETPs) at CEC Capital, mentioned that if the current upward trend continues, breaking the $45,000 mark could bring early investors in the BTC ETF close to being profitable. He also suggested that this momentum might lead to some investors taking profits, potentially triggering a reversal and testing the $42,000 to $40,000 level.
After the introduction of 10 ETFs in January, the price of BTC experienced an unanticipated decline. The value plunged after momentarily touching $49,000 when one of the funds, Grayscale, began transferring significant portions of their cryptocurrency to Coinbase.
This was due to the fact that, before Grayscale converted the Bitcoin Fund ETF to an open-ended fund, investors had to hold their shares for a minimum of six months before they could cash out. Many of the investors were eager to cash out and redeem their shares when it became an ETF in January.
Whale Appetite Up For BTC
As a result, Grayscale sold enormous quantities of Bitcoin, which dropped in price. It was trading below $39,000 at one point. However, it appears that the sell-off is ended, and Bitcoin is rising once more, partly due to large holders acquiring the asset.
Meanwhile, Markus Thielen, head of research at Matrixport and founder of 10x Research, says that Bitcoin (BTC) is headed towards $48,000 in the near future following its breakout driven by a solid track record of gains during the Chinese New Year festival.
Since bitcoin often rises by more than 10% around Chinese New Year, beginning on February 10, the following few days are extremely important statistically, according to Thielen’s research from Thursday.
Every time traders acquired bitcoin three days prior to the start of the Chinese New Year and sold it 10 days later, the price of bitcoin has increased during the previous nine years, according to Thielen.
Bitcoin Seen Hitting $50K
In a related development, LMAX Digital stated that it anticipates bitcoin to continue rising, maybe hitting the $50,000 mark.
According to LMAX Digital, technically speaking, bitcoin has broken out of a range and may be aiming for a surge to a new yearly high through $50,000.
Using Elliott Wave theory, a technical study that presupposes that prices move in repeating wave patterns, Thielen projected greater upside for bitcoin in the future.
The concept states that price trends evolve in five stages, with waves 1, 3, and 5 serving as “impulse waves” that indicate the primary trend. Retracements between the impulsive price movement occur in waves two and four.
Thielen said Bitcoin has started its final, fifth impulsive stage of its rally, aiming to reach $52,000 by mid-March, after completing its wave 4 retracement and correcting to $38,500.
Featured image from Adobe Stock, chart from TradingView
Bitcoin Price Climbs To $46K, Uptrend Could Extend To $48K?
Bitcoin price is gaining pace above the $45,500 resistance. BTC tested $46,000 and could extend its rally toward the $48,000 resistance.
- Bitcoin price climbed higher above the $44,500 and $45,000 resistance levels.
- The price is trading above $45,000 and the 100 hourly Simple moving average.
- There is a key connecting bullish trend line forming with support at $45,480 on the hourly chart of the BTC/USD pair (data feed from Kraken).
- The pair could continue to move up if it clears the $46,000 resistance zone.
Bitcoin Price Jumps 5%
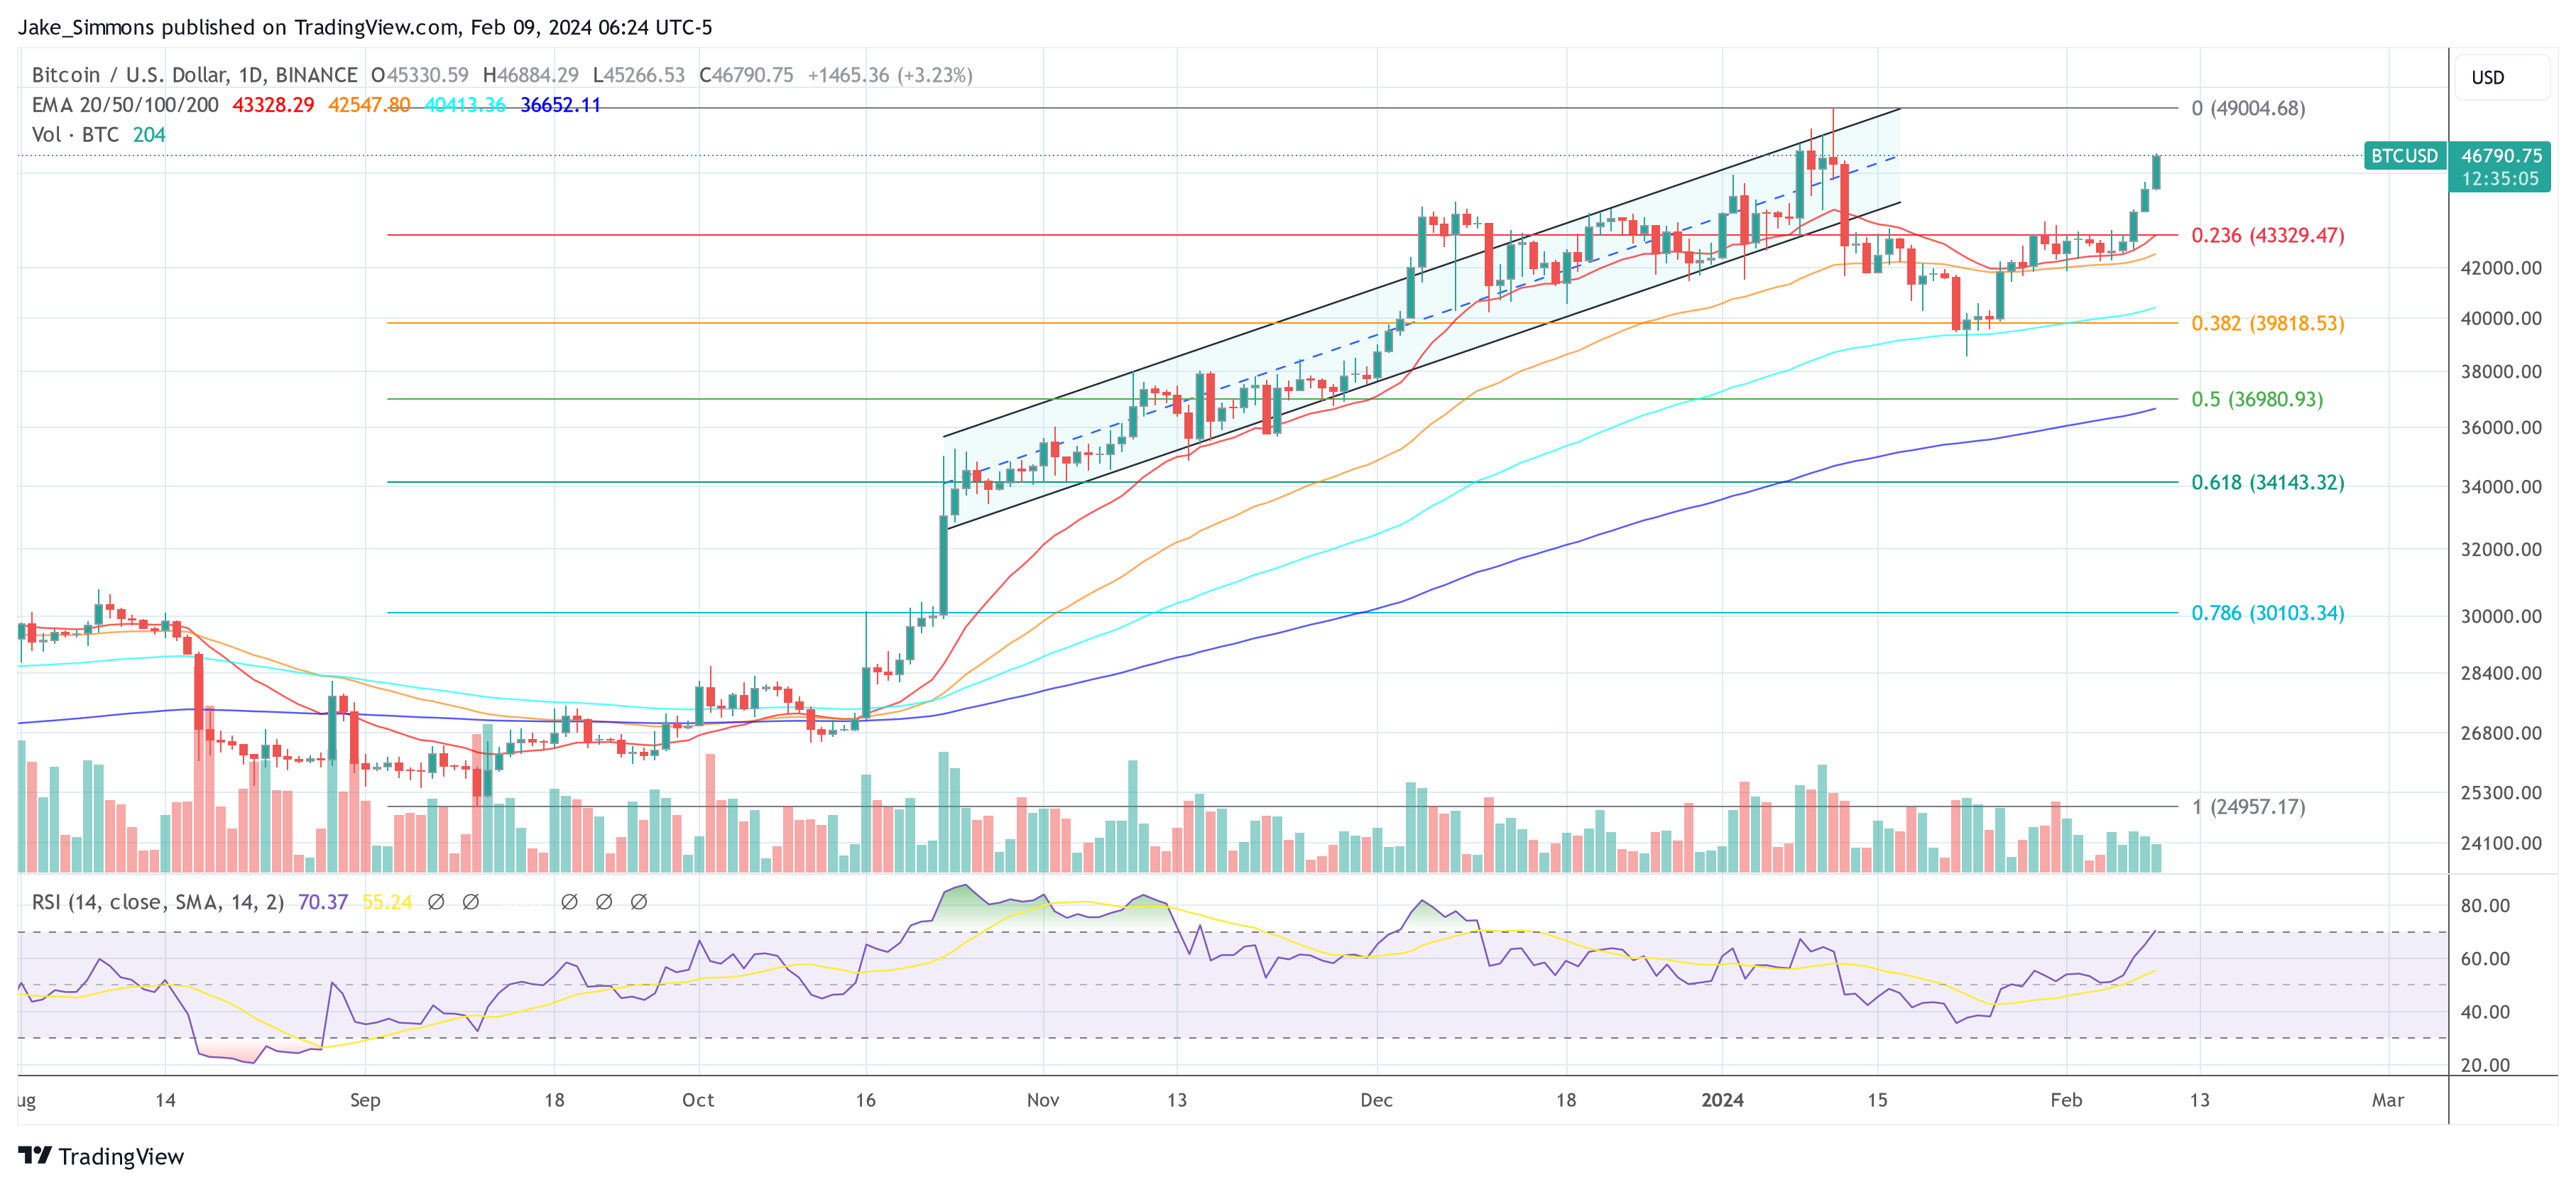
Bitcoin price started a steady increase above the $43,500 resistance zone. BTC cleared a few hurdles near the $44,000 and $44,200 levels to move into a positive zone.
The bulls gained strength and were able to pump the price above the $45,000 resistance. It traded close to the $46,000 level. A new multi-day high is formed near $45,955 and the price is showing signs of more gains in the near term.
Bitcoin is trading well above the 23.6% Fib retracement level of the recent surge from the $42,765 swing low to the $45,955 high. It is also trading above $45,000 and the 100 hourly Simple moving average.
Besides, there is a key connecting bullish trend line forming with support at $45,480 on the hourly chart of the BTC/USD pair. Immediate resistance is near the $46,000 level. The next key resistance could be $46,200, above which the price could start another decent increase.
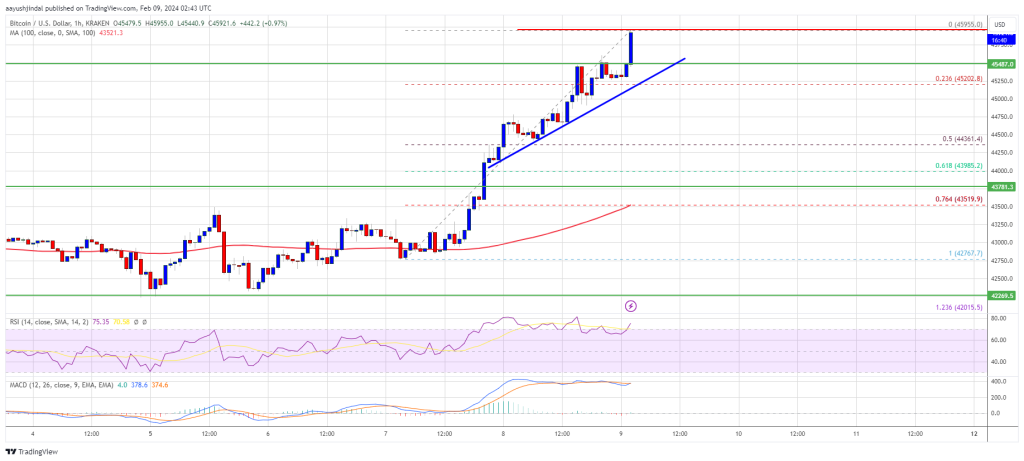
Source: BTCUSD on TradingView.com
The next stop for the bulls may perhaps be $46,850. A clear move above the $46,850 resistance could send the price toward the $47,500 resistance. The next resistance could be near the $48,000 level.
Downside Correction In BTC?
If Bitcoin fails to rise above the $46,000 resistance zone, it could start a downside correction. Immediate support on the downside is near the $45,500 level or the trend line.
The first major support is $44,400 and the 50% Fib retracement level of the recent surge from the $42,765 swing low to the $45,955 high. If there is a close below $44,400, the price could gain bearish momentum. In the stated case, the price could dive toward the $43,500 support.
Technical indicators:
Hourly MACD – The MACD is now gaining pace in the bullish zone.
Hourly RSI (Relative Strength Index) – The RSI for BTC/USD is now above the 50 level.
Major Support Levels – $45,500, followed by $44,400.
Major Resistance Levels – $46,000, $46,200, and $47,500.


