Binance’s fairly new boss Richard Teng has said Bitcoin (BTC) will exceed his previous expectations of hitting the $80,000 mark by the end of this year, according to Bloomberg.
Standard Chartered Raises Year-End BTC Forecast to $150K, Sees 2025 High of $250K
The bank also predicted that approval of an ether ETF could be expected on May 23, leading to as much as $45 billion of inflows in the first 12 months and ETH climbing to $8,000 by the end of 2024.
Bitcoin Threatens To Retreat To $60,000 As Bulls Seek Solid Ground
After a spectacular ascent to record highs, Bitcoin (BTC) is facing a reality check. The past week has seen a dramatic price correction, leaving investors wondering if this is a temporary setback or a sign of a more bearish future.
The world’s most popular cryptocurrency reached an intraday low of $64,620 on March 17th, a significant drop from its recent peak above $73,000. This pullback has triggered a wave of pessimism, with analysts pointing to declining profitability and a drop in daily active addresses on the network.
A Bearish Shadow Looms
According to analysts, investor sentiment has been hurt by a series of descending peaks and failed upturns, while selling pressure remains rampant as we approach the “weekly candle close.” This sentiment is echoed by data from IntoTheBlock, which shows a sharp decline in the number of addresses “In the Money,” signifying a decrease in overall profitability within the Bitcoin network.
Finding Support: A Beacon of Hope?
However, not everyone is hitting the panic button. Technical analysis suggests a potential support zone for buyers between $60,000 and $67,000. Popular trader Skew highlights this area as a possible turning point, while also acknowledging significant spot selling from major exchanges like Coinbase and Binance.
$BTC Spot Market Data Thread, in partnership @_WOO_X $BTC Binance Spot
Weekend spot buyer hereSpot Supply ($72K – $74K)
Spot Demand ($60K)Interestingly last bounce which was sold into also resulted in a stack of limit bids being quoted lower.
~ Keep an eye on those bids… pic.twitter.com/3PKHyddNlv— Skew Δ (@52kskew) March 17, 2024
Bulls On The Horizon: Are The Giants Awakening?
While the immediate future appears uncertain, some analysts remain bullish on Bitcoin’s long-term prospects. They view the current correction as a natural and healthy part of any bull run, pointing to historical data where similar pullbacks paved the way for further growth.
Related Reading: Bitcoin Crashes: Dip To $65,000 Triggers Over $400 Million Liquidation Avalanche
Adding fuel to the fire of optimism is the potential return of institutional capital. The recent resumption of buying from US Bitcoin ETFs and the prospect of a significant influx of funds from hedge funds and investment advisors in the coming months are seen as potential catalysts for a rebound.
Thomas Fahrer, CEO of Apollo, a decentralized online cryptocurrency platform renowned for its comprehensive crypto reviews and analysis of ETF inflows, echoes sentiments regarding X.
Fahrer characterizes the current state as a “Bear Trap” and pinpoints the resumption of buying from US Bitcoin ETFs on March 18 as a potential catalyst for an upward surge in X’s value.
Related Reading: Forget Dogecoin, Shiba Inu Set To Become The Top Dog: Expert Predicts $100 Billion Market Cap
Emphasizing the significance of increased institutional acceptance, Fahrer anticipates a surge in liquidity within Bitcoin ETFs, suggesting that substantial capital inflows from institutional investors have yet to materialize.
The Verdict: Brace For A Volatile Week
This week will be crucial for Bitcoin. The coming days will be a test of the cryptocurrency’s resilience and its ability to overcome the current selling pressure. If bulls can regain control and positive sentiment prevails, a return to record highs remains a possibility. However, if the downtrend continues, Bitcoin could face a more extended period of correction.
Featured image from Pexels, chart from TradingView
SOL, BOME Trend on Social Media as Ether, Bitcoin Lag
Increased crowd chatter may be a sign of an impending retail investor frenzy.
Indonesia’s Crypto Market Booms as Transactions Hit $1.92B in February
The country’s registered crypto investors also surged to 19 million users last month.
Bitcoin Price Hits Support But Fresh Rally Faces Many Hurdles
Bitcoin price tested the $65,000 support zone. BTC is now rising and attempting a fresh increase above the $70,000 resistance zone in the near term.
- Bitcoin price is showing a few positive signs from the $65,000 zone.
- The price is trading below $70,000 and the 100 hourly Simple moving average.
- There was a break above a major bearish trend line with resistance at $67,100 on the hourly chart of the BTC/USD pair (data feed from Kraken).
- The pair could gain bullish momentum if it clears the $70,000 resistance zone in the near term.
Bitcoin Price Holds Support
Bitcoin price started a downside correction from the $73,500 zone. There was a steady decline below the $70,000 support zone and the bears pushed the price below $68,000.
Finally, the price tested the $65,000 support zone. A low was formed at $64,555 and the price is now attempting a fresh increase. There was a move above the $66,500 resistance zone. The price climbed above the 23.6% Fib retracement level of the downward move from the $73,734 swing high to the $64,555 low.
There was also a break above a major bearish trend line with resistance at $67,100 on the hourly chart of the BTC/USD pair. Bitcoin is now trading below $70,000 and the 100 hourly Simple moving average.
Immediate resistance is near the $69,200 level or the 50% Fib retracement level of the downward move from the $73,734 swing high to the $64,555 low. The next key resistance could be $70,000, above which the price could rise toward the $71,200 resistance zone.
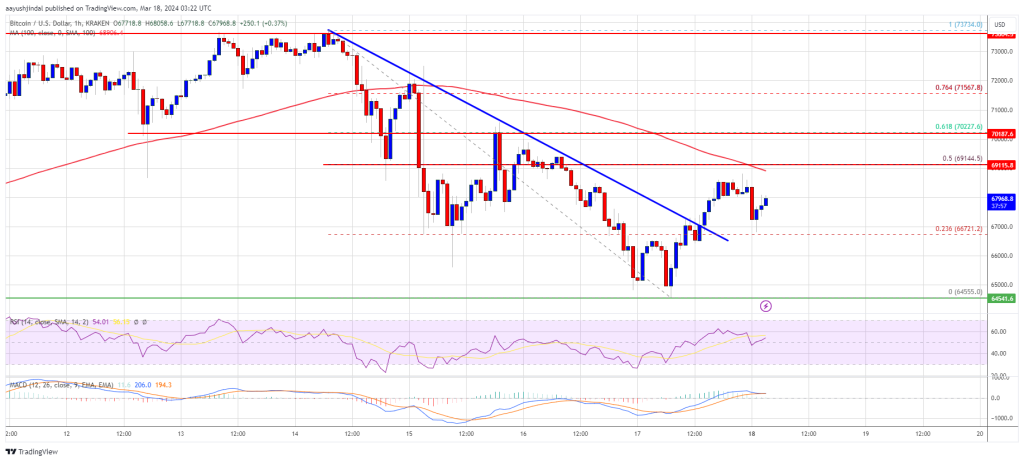
Source: BTCUSD on TradingView.com
If there is a clear move above the $71,200 resistance zone, the price could even attempt a move above the $72,000 resistance zone. Any more gains might send the price toward the $73,500 level.
More Losses In BTC?
If Bitcoin fails to rise above the $70,000 resistance zone, it could start another decline. Immediate support on the downside is near the $67,000 level.
The first major support is $65,000. The main support sits at $64,500. If there is a close below $64,500, the price could start a drop toward the $63,500 level. Any more losses might send the price toward the $62,000 support zone.
Technical indicators:
Hourly MACD – The MACD is now losing pace in the bearish zone.
Hourly RSI (Relative Strength Index) – The RSI for BTC/USD is now above the 50 level.
Major Support Levels – $66,500, followed by $65,000.
Major Resistance Levels – $69,200, $70,000, and $71,200.
Bitcoin Crashes: Dip To $65,000 Triggers Over $400 Million Liquidation Avalanche
In a tumultuous turn of events, the cryptocurrency market has been rattled by a sharp decline in Bitcoin prices. After a sustained period of remarkable gains and record highs, Bitcoin has plunged to a weekly low of $65,000, marking a significant setback for investors.
At the time of writing, Bitcoin numbers were all painted in red, and trading at $65,710, losing value in the 24-hour and weekly timeframes by 5.6% and 4.5%, respectively, according to data from Coingecko.
A few days after its previous low of $68,000, Bitcoin plummeted to its present level, a figure not seen in a week, as bears persisted in their downward pressure.
Altcoins Also Take A Beating
While Bitcoin bears the brunt of the downturn, altcoins are not spared from the fallout. Ethereum (ETH) and Binance Coin (BNB) have also witnessed substantial losses, shedding 10% of their value or more.
Dogecoin and Shiba Inu, two popular meme coins, have experienced even steeper declines, plunging by 20% and nearly 30%, respectively. The broader altcoin market mirrors Bitcoin’s downward trajectory, amplifying the sense of unease among investors.
Bitcoin: Impact On Market Dynamics
The recent price correction in Bitcoin has reverberated across the cryptocurrency landscape, reshaping market dynamics and investor sentiment. The surge in liquidations, with over 151,000 traders facing margin calls in the past 24 hours, underscores the magnitude of the market upheaval. Bitcoin’s dominance in the market is evident as it accounts for the lion’s share of the total liquidations, highlighting its pivotal role in shaping overall market trends.
As a result of the decline in value, the total market liquidations have reached $426 million, with Bitcoin taking the worst hit.
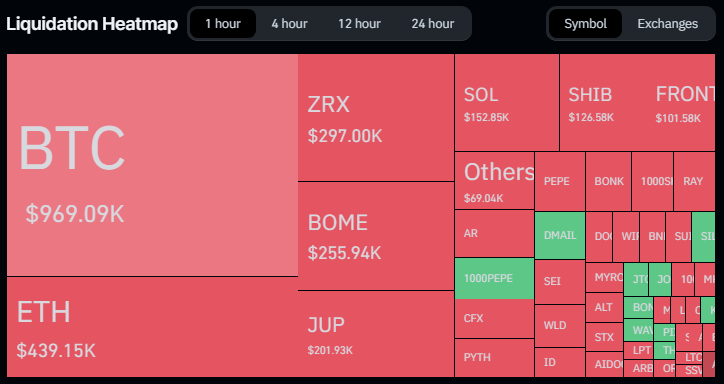
Liquidation Spree
The amount that the price of Bitcoin has liquidated over the last 24 hours has exceeded $104 million, with long traders losing the most money—they lost $86 million compared to $18 million for short sellers. Ethereum saw a $48 million overall liquidation, with $33 million going to long traders and $15 million going to short traders, as a result of the losing run.
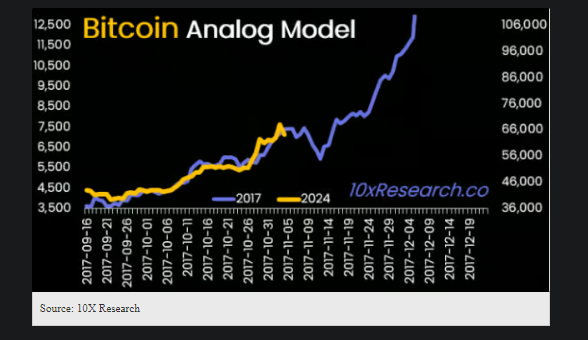
Analyst Sounds Alarm Siren
Meanwhile, market analysts such as Markus Thielen, CEO of 10x Research, have sounded the alarm bells, warning of further downside risks for Bitcoin. Thielen’s prediction of a potential drop to $63,000 sends a sobering message to investors, urging caution and prudence in navigating the current market environment.
His insights shed light on underlying concerns about Bitcoin’s market structure, including low trading volumes and liquidity, which exacerbate the risk of sharp price corrections.
Amidst the market turbulence, investors are grappling with the implications of Thielen’s analysis and adjusting their strategies accordingly. The era of meme coin mania appears to be waning, prompting investors to reassess their positions and secure profits while they still can.
Featured image from Kinesis Money, chart from TradingView
Crypto Carnage: Over $800 Million Wiped Out In Market Plunge
The recent market plunge has sent shockwaves through the crypto industry, resulting in hundreds of millions in dollars being wiped out in a matter of hours.
The price of Bitcoin has retreated violently to a weekly low of $67,500 after a few days of showing remarkable advances and setting new all-time highs.
The altcoins have experienced a significant decline as well, resulting in nearly 200,000 traders making liquidations during the last 24 hours.
The weekend brought a tremor to the cryptocurrency market, with a sudden price correction causing short-term panic and hundreds of millions in liquidated positions.
However, despite the wobble, analysts are divided on whether this signifies a broader market shift or a mere blip on the bullish radar.
Crypto Long Squeeze Triggers Liquidations
Over a 24-hour period ending Friday, March 15th, the global cryptocurrency market capitalization shed a cool 6%. This triggered a wave of automated liquidations, particularly for investors holding leveraged long positions – essentially large bets on rising prices.
According to Coinglass, a crypto data analysis platform, over $800 million worth of long positions were liquidated across the market. Bitcoin itself bore the brunt of the selling pressure, dipping as low as $67,000 – its lowest point in over a week.
The pain wasn’t evenly distributed. Over one third of the liquidations, a total of $660 million, came from long positions on Bitcoin.
Altcoin Bloodbath Follows Bitcoin’s Lead
The tremors weren’t confined to Bitcoin. The correction spilled over to the altcoin market, with popular tokens like Cardano, Dogecoin, Shiba Inu, and XRP all experiencing significant price drops.
This, in turn, triggered further liquidations for long positions held on these altcoins. XRP traders alone saw over $10 million liquidated, with nearly $11 million coming from long positions.
Crypto Market Fights Back: Buying The Dip
Despite the week’s fright, the overall sentiment in the crypto market remains surprisingly bullish. This is primarily fueled by the swift buying activity observed at key support levels as prices dipped.
Bitcoin, the world’s most sought-after crypto asset, for example, has already staged a partial recovery, bouncing back to a little over $69,000 at the time of writing.
Similar rebounds have been observed across several altcoins, suggesting that investors might be viewing this as a buying opportunity.
This correction can be seen as a healthy market reset after a strong rally, some analysts say. While some leveraged positions got burned, the fact that investors are stepping in to buy the dip indicates continued confidence in the long-term potential of cryptocurrencies.
A Continued Balancing Act
The weekend’s events serve as a microcosm of the ongoing struggle within the crypto market. On one hand, there’s a growing sense of institutional adoption and mainstream acceptance, fueling a bullish sentiment.
On the other, the inherent volatility of crypto assets continues to pose a challenge, with sudden price swings capable of inflicting significant losses on unsuspecting investors.
Featured image from Pexels, chart from TradingView
Analyst Expects Bitcoin Price Correction To Persist, Targets $57,000 Support
Bitcoin (BTC) has drawn much attention in the last few weeks, with a stunning price surge leading to a new all-time high of $73,750. Largely defined as the pre-halving rally, BTC’s bolstering gains have been followed by significant price correction, with the crypto market leader trading as low as $65,630 on March 15.
While the cryptocurrency may have picked up some minor gains in the last 12 hours as it attempts a market recovery, popular analyst Michaël van de Poppe has released a disturbing prediction that indicates Bitcoin price correction may be far from over.
Related Reading: Behind The Scenes Of Shiba Inu 12% Plunge: What On-Chain Analysis Tells Us
Bitcoin May Have Peaked Pre-Halving, Analyst Says
In a Friday post on X, van de Poppe shared a market forecast that Bitcoin could fall as low as $57,000, thus prolonging its current correction phase. The analyst began by highlighting that BTC still retained a valid bearish divergence which occurs when the price of an asset forms higher highs while the corresponding indicator forms lower highs. It usually indicates that the driving force behind a certain trend is attenuated with a reversal now on the horizon.
#Bitcoin remains to have a valid bearish divergence.
This is confirmed by the lower timeframe, lower highs, and clear rejection at $70.5K.
For this correction, I’d be targeting $57-61K, and, likely, we’ll have peaked pre-halving.
Altcoin summer is on the horizon. pic.twitter.com/bGmnHcVDnz
— Michaël van de Poppe (@CryptoMichNL) March 15, 2024
In the case of Bitcoin, the bearish divergence indicates the coin’s recent rally may be exhausted and is now likely to produce major negative price movements. Van de Poppe stated this theory was confirmed by BTC’s latest rejection at the $70,000 zone during its attempted market rebound.
The prominent crypto analyst predicts Bitcoin to soon resume its price correction, falling to a price range of $57,000 to $61,000. If these speculations prove true, it could also indicate that in similar fashion, the BTC market may attain its highest value prior to the Bitcoin halving.
For context, the Bitcoin Halving is historically preceded by a price rally followed by a significant price retrace ranging from 20% to 40%. With the next Halving event set for April 2024, van de Poppe believes that further retracement by Bitcoin could stamp the end of the pre-halving rally.
BTC Price Overview
According to data from CoinMarketCap, Bitcoin is currently trading at $69,027 with a 0.17% and 1.26% in the last hour and day, respectively. In tandem, the token’s daily trading volume is up by 1.20% and is valued at $69.58 million.
BTC trading at $69,259 on the weekly chart | Source: BTCUSD chart on Tradingview.com
Post-Halving Pressure: Marathon Digital Anticipates Bitcoin Break-Even Price Of $43,000
The Bitcoin (BTC) market has been on a wild ride recently, hitting a new all-time high (ATH) before experiencing notable volatility that resulted in an 8% drop to the $65,500 level on Friday.
Meanwhile, Marathon Digital, one of the largest US-based Bitcoin mining companies, is preparing to acquire more power infrastructure and streamline operations to meet the challenges posed by a reduction in revenue due to the upcoming April halving event.
Bitcoin Miners Brace For Post-Halving Shakeout
According to a Bloomberg report, Marathon Digital plans to acquire additional power infrastructure and expand its mining capacity to keep costs low and maintain profitability.
By optimizing operations and scaling up, Marathon aims to mitigate the impact of the impending revenue drop and secure wider margins in the post-halving landscape.
Marathon Digital recently announced an agreement to purchase a 200-megawatt data center in Garden City, Texas, for over $87 million. This acquisition marks the company’s second major investment in power infrastructure after it acquired multiple sites for $179 million earlier this year.
By increasing its ownership of mining capacity infrastructure to 53%, up from a meager 3% in the previous year, Marathon is positioning itself for greater operational efficiency and cost-effectiveness, Bloomberg notes.
However, post-halving, the Bitcoin mining industry is expected to undergo significant changes, with some miners facing profitability challenges and potential exits.
Profitability Crisis Looms
Marathon Digital’s CEO, Fred Thiel, highlights the impact of revenue reduction, estimating that the industry’s average break-even point will rise from around $23,000 per Bitcoin to approximately $43,000. Thiel stated:
Post halving, there will be some miners to lose profitability, maybe challenged, or maybe looking for an exit as their revenues will drop because of the Bitcoin rewarded will drop. The simple math is, if the industry average break-even point was around $23,000 per Bitcoin, it will now go up to around $43,000.
It is worth noting that this does not necessarily mean that Bitcoin’s price will fall to $43,000 from its current trading price of $69,300. The breakeven price refers to the price at which miners like Marathon Digital can cover their operating costs and achieve profitability. It is not directly correlated to the market price of Bitcoin.
As of the time of writing, BTC is trading at $69,300 and is on the verge of reclaiming the significant milestone of $70,000. The cryptocurrency experienced a notable spike in volatility during the early hours of Friday’s trading session but has since recovered, mitigating its losses from 8% down to 2.5%.
Featured image from Shutterstock, chart from TradingView.com
Surge Alert: Bitcoin’s Futures Basis Climbs To New Heights, What This Means For BTC
Bitcoin’s futures market is showcasing signs that have historically signalled bullish sentiment. Analysts are turning their attention to the Bitcoin futures basis—a metric representing the differential between the futures price of Bitcoin and its spot price.
Recent data has revealed that this basis has escalated to unprecedented levels since Bitcoin’s all-time high of $69,000 in November 2021.
Bullish Indications From Bitcoin Futures
Deribit’s Chief Commercial Officer, Luuk Strijers, has highlighted the current state of the Bitcoin futures basis, which ranges between 18% to 25% annually, a rate reminiscent of the market conditions in 2021.
According to Strijers’s comment, this elevated basis is not just a number but a lucrative opportunity for derivatives traders.
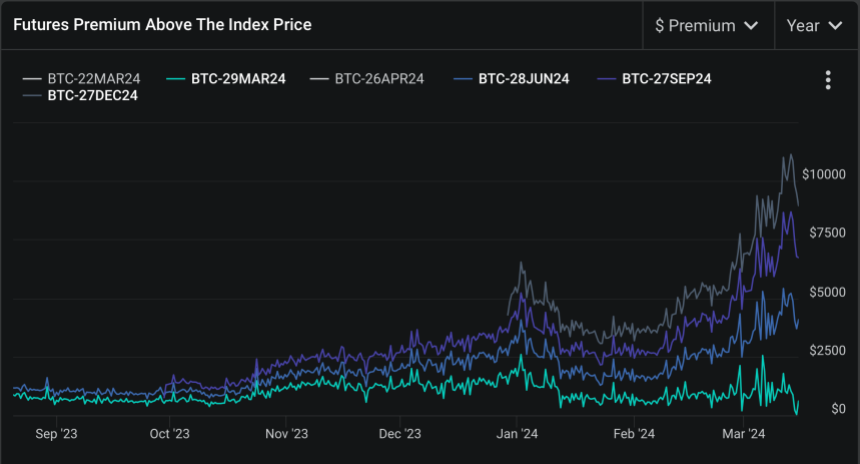
By engaging in trades that involve buying Bitcoin in the spot market and simultaneously selling futures contracts at a premium, traders can secure a “dollar gain” that will materialize at the contract’s expiry, irrespective of Bitcoin’s price volatility.
Strijers further noted that this strategy is particularly appealing in the current climate, fueled by the influx of new investments following the approval of Bitcoin ETFs and anticipation surrounding the Bitcoin halving event.
The significance of the heightened futures basis extends beyond the mechanics of derivatives trading. It further reflects broader market optimism, “bolstered” by recent regulatory approvals and macroeconomic factors influencing cryptocurrency.
The disparity between Bitcoin’s spot and futures prices suggests a confident market outlook, propelled by the anticipation of continued investment inflows and the impact of the upcoming Bitcoin halving.
Such conditions create a fertile ground for Bitcoin’s value to surge, as historical precedents have often linked bullish futures basis rates with periods of substantial price appreciation.
Market Sentiment And Halving Cycles
While Bitcoin’s current market performance exhibits a bearish trajectory, with a 3.9% dip bringing its price to $68,203, market analysts advise against interpreting this as a negative signal. Rekt Capital, a respected figure in crypto analysis, views the recent price correction as a “positive adjustment” preceding the much-anticipated Bitcoin halving in April.
Halving events, which reduce the block reward for miners, thus slowing the rate of new Bitcoin entering circulation, have traditionally catalyzed significant price rallies due to the resulting supply constraints.
Rekt Capital’s analysis parallels current market movements and historical patterns observed in previous halving cycles.
According to the analyst, despite the swift pace of these cycles, they exhibit a consistent sequence of a pre-halving rally followed by a retracement phase—both of which align with Bitcoin’s current trajectory. This cyclical perspective suggests that the recent dip is merely a temporary setback, setting the stage for the next bullish phase post-halving.
Though there are signs of BTC experiencing an Accelerated Cycle…
History still continues to repeat, nonetheless$BTC broke out into a “Pre-Halving Rally” right on schedule
And now, #Bitcoin is transitioning into its “Pre-Halving Retrace” right on schedule#Crypto https://t.co/Egqxs9ritl pic.twitter.com/lj0IdQtBEE
— Rekt Capital (@rektcapital) March 15, 2024
Featured image from Unsplash, Chart from TradingView
United States Dominates Global Crypto Market With Massive $9.3 Billion In Profits
In a recent report by market intelligence firm Chainalysis, it has been revealed that global crypto gains in 2023 amounted to a staggering $37.6 billion. This profit surge reflects improved asset prices and market sentiment compared to 2022.
Although this figure falls short of the $159.7 billion gains witnessed during the 2021 bull market, it signifies a significant recovery from the estimated losses of $127.1 billion experienced in 2022.
Sharp Surge In Crypto Gains
The report suggests that despite similar growth rates in crypto asset prices in 2021 and 2023, the total gains for the latter year were lower. According to Chainalysis, this discrepancy could potentially be attributed to investors’ decreased inclination to convert their crypto assets into cash.
The analysis further suggests that investors in 2023 seem to have anticipated further price increases, as crypto asset prices did not exceed previous all-time highs (ATHs) during the year, unlike in 2021.
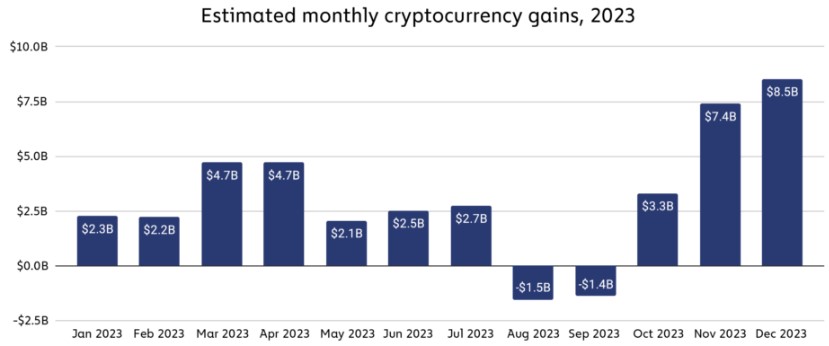
Cryptocurrency gains remained relatively consistent throughout 2023, except for two consecutive months of losses in August and September, as seen in the image above. However, gains surged sharply thereafter, with November and December eclipsing all previous months.
United States Leads
Leading the pack in cryptocurrency gains was the United States, with an estimated $9.36 billion in profits in 2023. The United Kingdom secured the second position with an estimated $1.39 billion in crypto gains.
Notably, several upper and lower-middle-income countries, particularly in Asia, such as Vietnam, China, Indonesia, and India, achieved significant gains, each surpassing $1 billion and ranking within the top six countries worldwide.
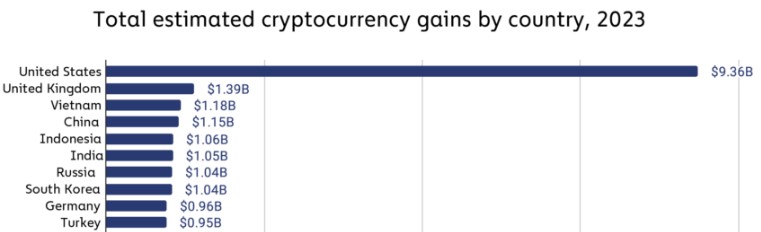
Chainalysis had previously observed strong cryptocurrency adoption in these income categories, particularly in “lower-middle-income” countries, which demonstrated resilience even during the recent bear market. The gains estimates indicate that investors in these countries have reaped substantial benefits from embracing the asset class.
Ultimately, the Chainalysis report suggests that the positive trends observed in 2023 have carried over into 2024, with prominent cryptocurrencies such as Bitcoin (BTC) hitting all-time highs of $73,700 following the approval of Bitcoin exchange-traded funds (ETFs) and increased institutional adoption.
If these trends persist, the firm believes that it is conceivable that gains in 2024 will align more closely with those witnessed in 2021.
As of this writing, the total crypto market cap valuation stands at $2.5 trillion, a sharp drop of over 4% in the last 24 hours alone, and down from Thursday’s two-year high of $2.7 trillion. Bitcoin, on the other hand, is trading at $68,400 after dropping as low as $65,500 but has quickly regained its current trading price, limiting losses to 4% over the past 24 hours.
Featured image from Shutterstock, chart from TradingView.com
Bitcoin FOMO: Over 533,330 Addresses Bought Above $70,180
On-chain data suggests more than 533,330 addresses FOMO’d into Bitcoin above $70,180. Following the latest plunge, these investors would all be in losses.
Over 500K Bitcoin Addresses Have A Cost Basis Between $70,180 & $71,340
As pointed out by analyst Ali in a post on X, many investors have bought at the recently high price levels. Below is the chart shared by the analyst that shows how the distribution of the BTC supply looks right now across the various price ranges.
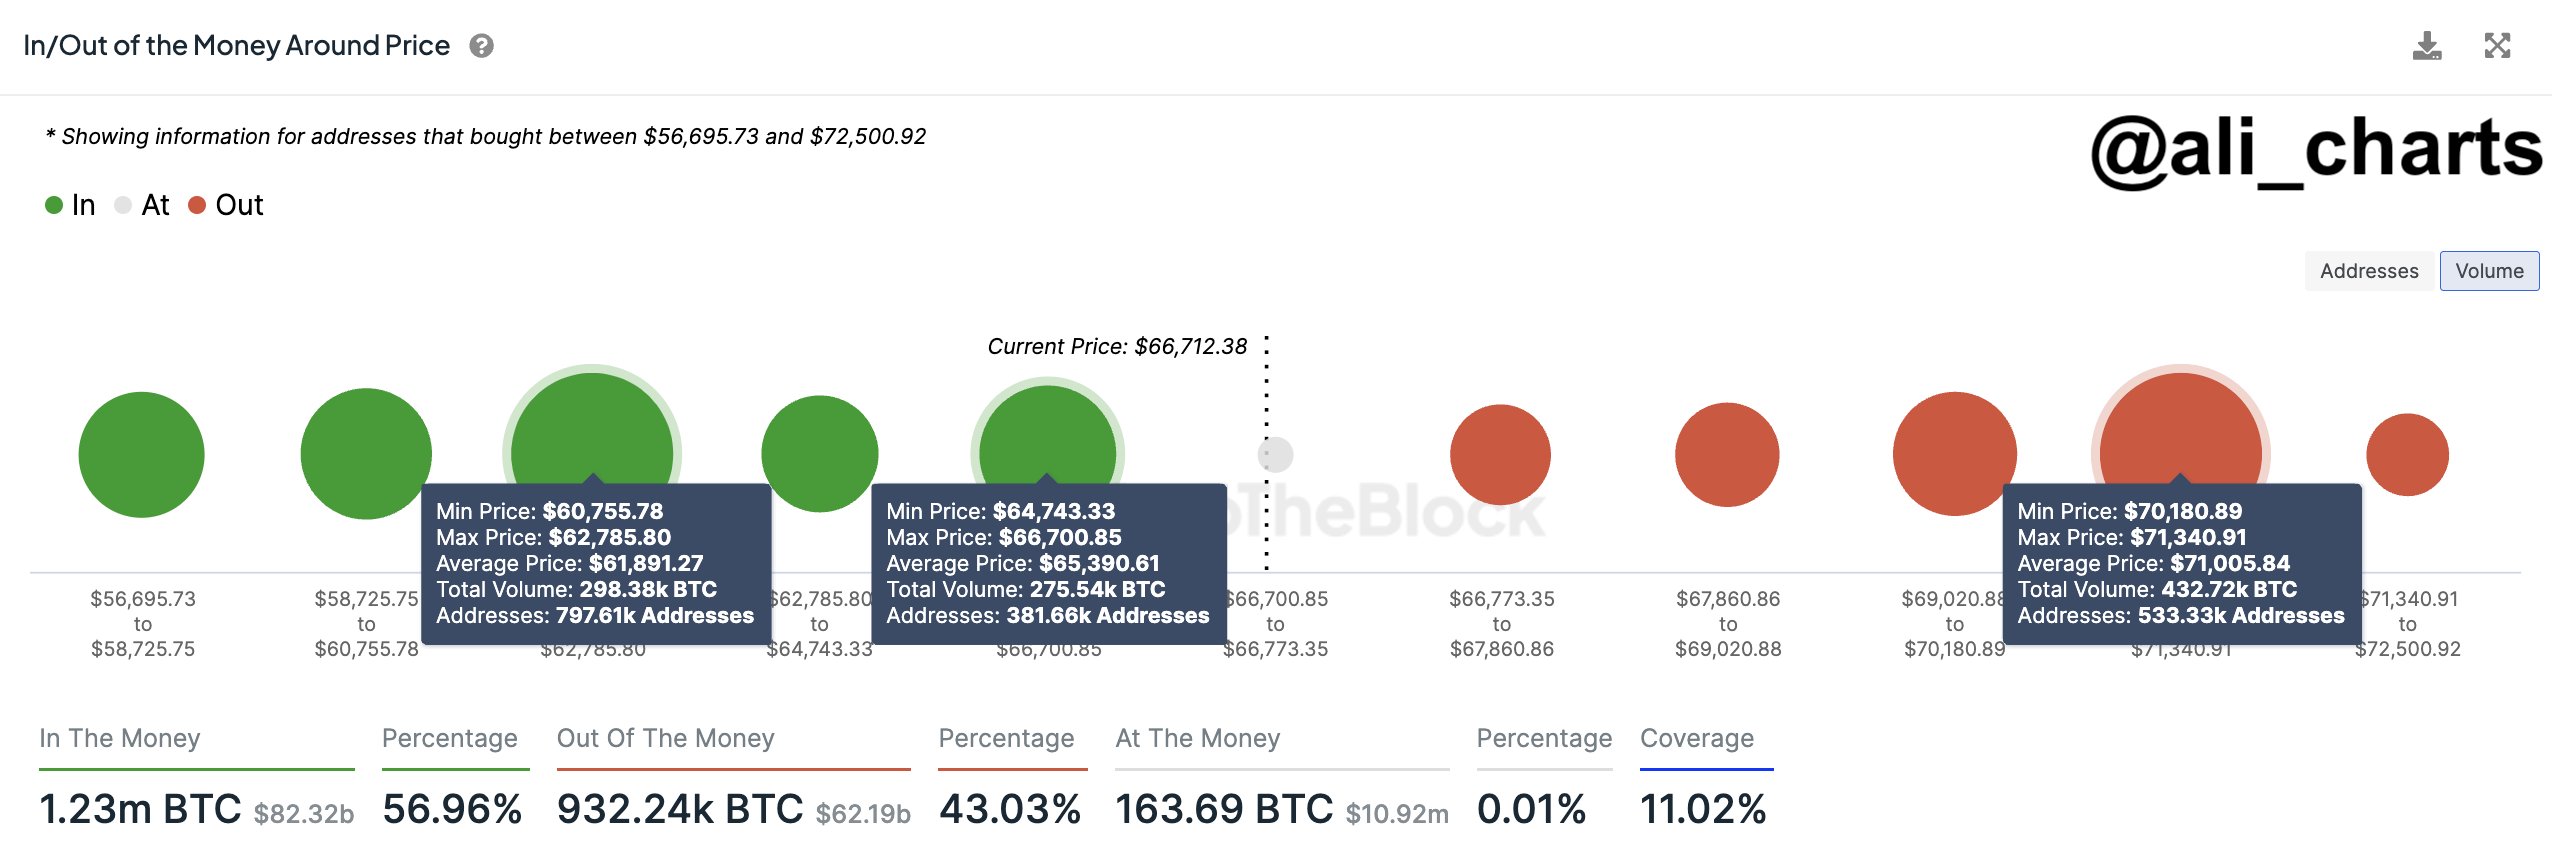
The data is from the market intelligence platform IntoTheBlock, which has used on-chain data to determine the average acquisition price for any given address based on when its coins moved into its balance.
In the chart, the size of the dots represents the amount of coins that have their cost basis inside the corresponding range. It would appear that the $64,743 and $66,700 range is below the current price that hosts the cost basis of a significant amount of addresses.
More particularly, 382,000 addresses acquired 275,450 BTC at these levels. As the Bitcoin spot price is currently trading above this range, all these investors would naturally be carrying some profits.
Generally, investors are sensitive to retests of their cost basis, as such retests can potentially flip their profit-loss status. For holders who were in profit before the retest, the dip may appear as an opportunity to buy more.
The emerging reaction can be significant when many hands share their cost basis inside the same narrow range. If this retest occurs from above, the asset could feel some support as these investors rush to accumulate more.
Since the $64,743 to $66,700 range is dense with investors and is situated below the current spot price of the cryptocurrency, it could act as a major support center.
“Monitoring this level closely is crucial, as losing it could shift the focus to the next significant demand zone between $60,760 and $62,790, safeguarded by 797,500 addresses with over 298,000 BTC,” notes Ali.
In terms of the levels above, the $70,180 to $71,340 range particularly stands out, as 533,330 addresses bought a total of almost 433,000 BTC. A lot of these new buyers would be those FOMO’ing into the asset after seeing it explore new all-time highs.
This large block, however, may serve as a point of resistance for the cryptocurrency. These fresh hands might sell just as quickly as they bought in when a retest of their cost basis happens since they may be willing to just exit at their break-even, fearing more drops in the near future.
BTC Price
Bitcoin has seen a sharp correction during the past day, following which its spot price is now trading around the $67,900 level.
Key Trend Driving Altcoin Market Toward $425 Billion: Analyst
Amid the bullish sentiment around the crypto landscape, the Altcoin overall market cap has displayed positive strength as many investors and traders are throwing capital into several altcoins ahead of the bull cycle.
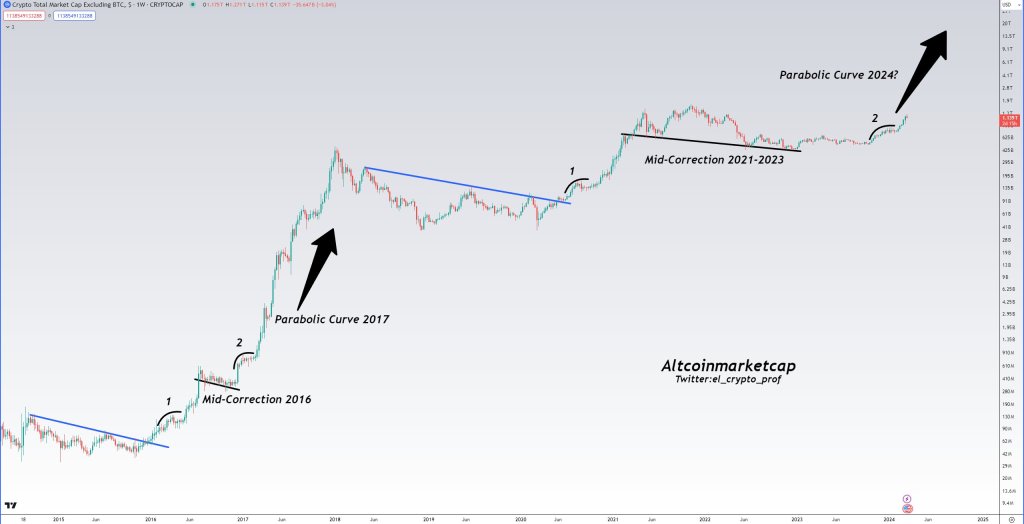
Altcoin Market To Rally Toward $425 Billion
Since Bitcoin has surged to a new record high, many cryptocurrency analysts anticipate a surge in the altcoin market cap. Rekt Capital, a cryptocurrency expert and trader, has shared a positive prediction regarding the altcoins market cap with the community on X.
The expert analysis delves into the current state of the market and its potential to surge higher in the coming months. His projections came in light of the altcoin season index showing advancement, which suggests that its season is almost here.
According to the analyst, the market has been “redirected into the blue-circled testing area,” which was caused by rejection from the “red-circled circle zone.” However, the market has rebounded since then, indicating an increased interest from market investors.
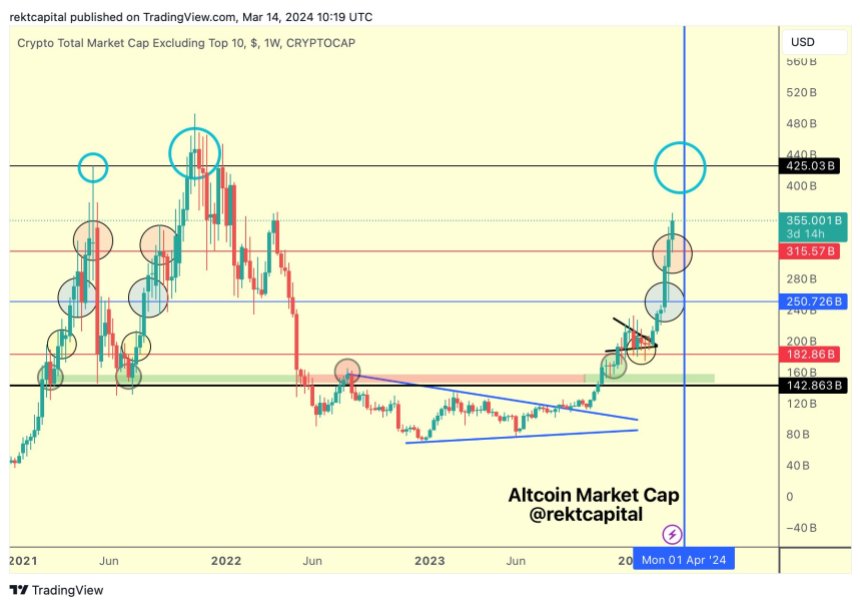
Furthermore, Rekt Capital noted that the market has surpassed the “$315 billion red line of resistance.” As a result, the red line resistance level has now been changed to a “new support level.” Due to this, the crypto analyst anticipates a surge to the “light blue circle” at the $425 billion threshold in the upcoming months.
The post read:
The red-circled area rejected the Altcoin Market back into the blue-circled retesting zone. Since then, the Altcoin Market Cap has recovered, broken beyond the red $315bn resistance, and turned recently into new support. Next is the light blue circle, over time.
However, Rekt Capital also asserted in another recent post that the “$315 billion mark is still being retested by alts market cap new support.” It has been unable to move past it despite today’s double-digit declines on several altcoins.
Even though the market is still retesting the aforementioned level, Rekt Capital is confident that it will “revisit the $425 billion resistance” soon. He anticipates the market revisiting the level before the Bitcoin Halving event, expected to take place in April.
Alts Gains Are Sustable And Likely To Crash
Chief Executive Officer (CEO) of Bitcoin technology firm JAN3, Samson Mow, has also shared his insights regarding the altcoin market. Despite anticipating a rise in the altcoin market, Mow highlighted that he expects alts to “crash in the upcoming weeks.”
According to Mow, alts have been monitoring the “increase in Bitcoin” after launching BTC Spot Exchange-Traded Funds (ETFs). However, altcoins do not possess “the $500 million to $1 billion” daily inflows seen with Bitcoin.
Consequently, this should be the “major sign” that their gains “can not” be maintained. “MSTR has a $30 billion market cap, Solana is $73 billion. That is absurd. A correction is overdue,” he added.
Bernstein Analysts Convinced Bitcoin Is Headed For $150,000, Here’s Why
Analysts from private wealth management firm, Bernstein have reaffirmed their previous Bitcoin prediction, emphasizing that the cryptocurrency has a greater chance to reach $150,000 by 2025.
Bitcoin $150,000 Price Forecast Grows Stronger
Bernstein analysts Gautam Chhugani and Mahika Sapra said in a note to clients on Monday that they were now more convinced of Bitcoin’s exponential surge to new all-time highs at around $150,000 by mid-2025. The analyst’s statements were a reiteration of their earlier Bitcoin forecast in November 2023, when they predicted the price of Bitcoin to surge to $150,000.
At the time, Bitcoin was trading around a price of $35,000, putting the analysts’ estimate at around five times the price of BTC. Now with BTC recently witnessing remarkable surges to new all time highs above $71,000, and potentially continuing its upward momentum, Bernstein analysts’ forecast seems more probable.
Analysts from the private wealth investment firm have disclosed several factors that could trigger BTC’s bullish momentum. Highlighting the success and surging demand for Spot Bitcoin Exchange Traded Funds (ETF), the company boldly affirmed that large volume of inflows into Spot Bitcoin ETFs could significantly contribute towards increasing the value of BTC.
“We estimated $10 billion inflows for 2024 and another $60 billion for 2025. In the last 40 trading days since the ETF launch on Jan 10, Bitcoin ETF inflows have crossed $9.5 billion already,” Bernstein analysts wrote.
Sharing the sentiment of most crypto analysts in the market, Bernstein analysts believe that the price of BTC could experience a fresh “break out” after the halving event in April 2024. At the time of writing, the cryptocurrency is trading at $68,218, witnessing a slight price correction of about 6.96% in the past 24 hours, according to CoinMarketCap.
Miners To Become Top Beneficiaries Of BTC Surge
In their note, Bernstein analysts highlighted that investing in Bitcoin miners could be the best equity proxy to BTC. According to their analysis, BTC miners typically outperform during BTC bullish cycles and conversely underperform during bearish periods.
As Bitcoin rapidly rises to all time highs above $71,000, Bernstein analysts expect that institutional interest in Bitcoin related equities could top over, with BTC miners becoming one of the largest beneficiaries. Despite various analysts predicting that the next Bitcoin halving could potentially become a death sentence to small mining companies and solo miners, Bernstein analysts have revealed that the rising price of BTC and elevated transaction fees could serve as a cushioning mechanism for miners during the halving period.
Bitcoin To $53,200? Why History Says It’s Possible
As Bitcoin drops below $68,000, history suggests this correction is rather tame for bull markets, as plunges to this deep on-chain level have been the norm.
Bitcoin Short-Term Holder Realized Price Is Currently Around $53,200
As pointed out by CryptoQuant Netherlands community manager Maartunn in a post on X, BTC still has a decent margin over the realized price of the short-term holders.
The “realized price” is an on-chain metric that keeps track of the average price at which the Bitcoin investors acquired their coins. The indicator calculates this value by going through the transaction history of each coin and assuming that the last transfer of it was the last time it was purchased (that is, the price at the time is its current cost basis).
When the spot value of the cryptocurrency dips below the realized price, it means that the average investor is now in a state of loss. On the other hand, a break above implies the market as a whole has entered into net profits.
In the context of the current discussion, the realized price for only a particular segment of the investors is of interest: the “short-term holders” (STHs). The STHs include all the investors who bought their coins within the past 155 days.
Now, here is a chart that shows the trend in the Bitcoin realized price specifically for this cohort:
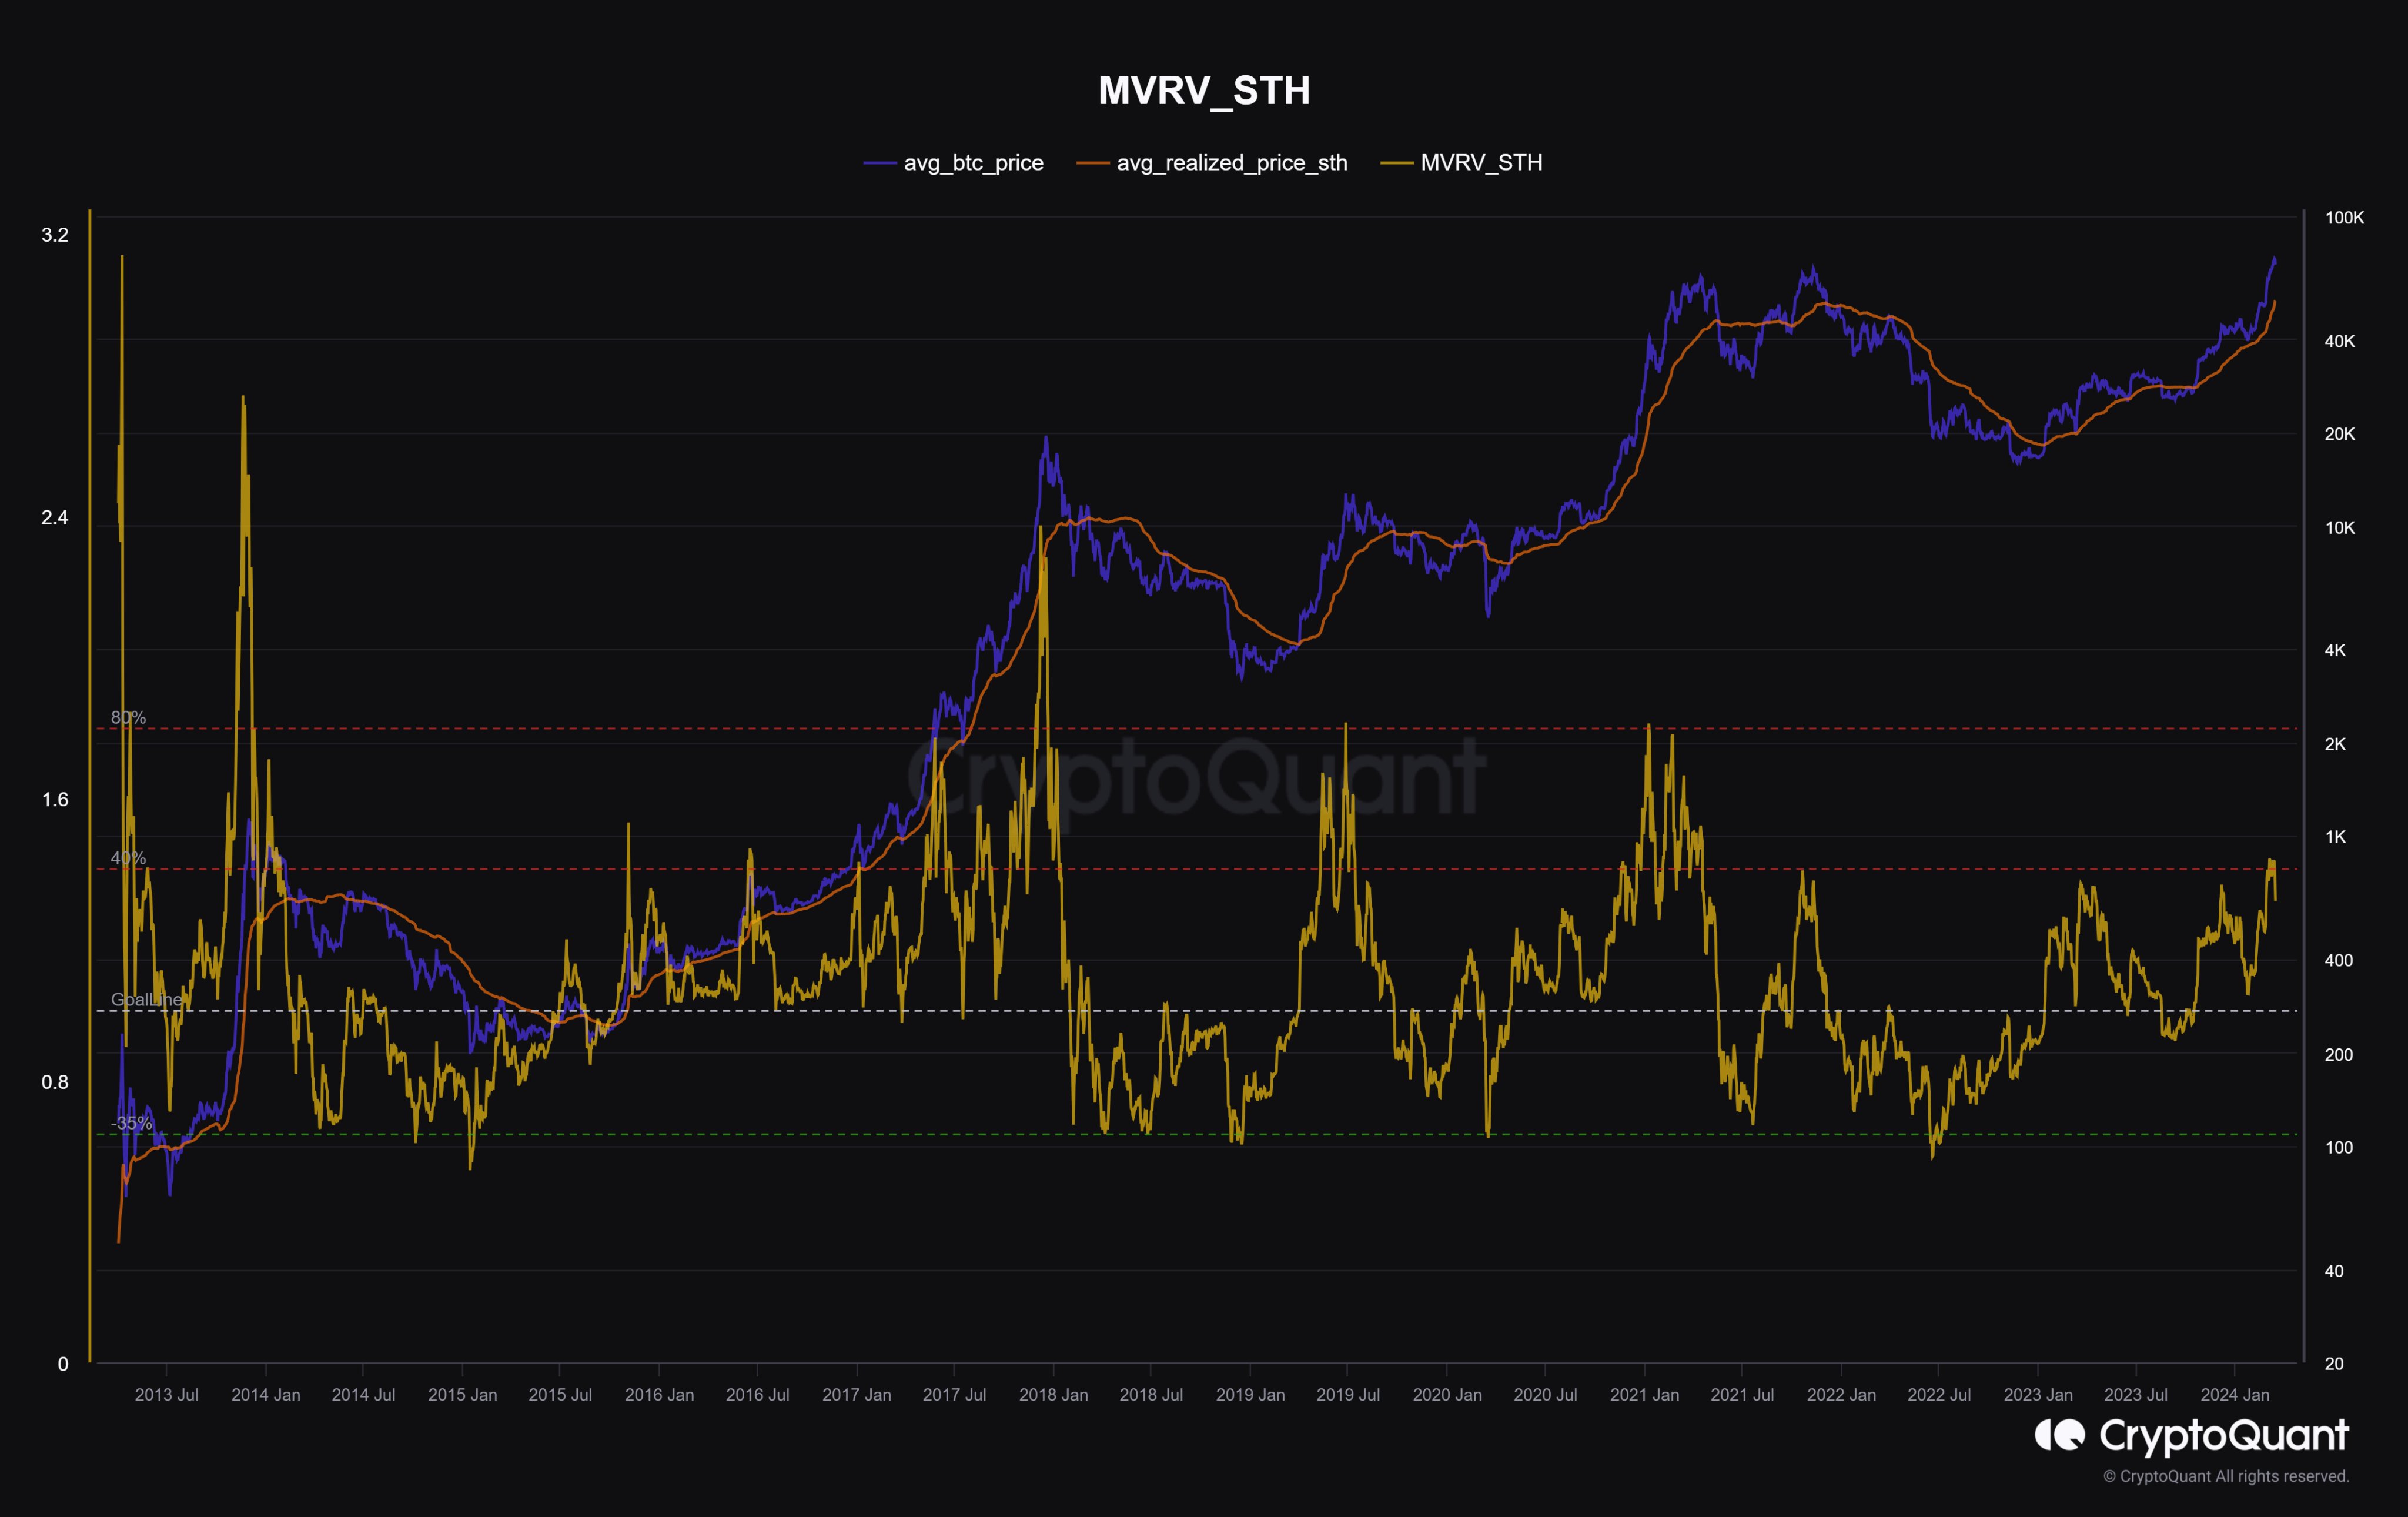
As displayed in the above graph, the Bitcoin STH realized price has shot up recently as the price of the asset has gone up. This makes sense, as this group includes the most recent buyers, who would continuously be buying at higher prices in an uptrend, thus raising their average cost basis.
At present, this cohort’s realized price is about $53,200. During the past day, BTC has seen a sharp drop that has taken its price below the $68,000 mark, but clearly, the STHs would still be in high profits even after this drawdown.
“In previous bull markets, the average cost basis of short-term holders was fully reset multiple times,” explains Maartunn. This trend is most prominent in the data for the 2017 bull run when the price retested this level several times.
An interesting pattern that has been held is that these retests of the level during bull trends have generally resulted in the cryptocurrency finding support and turning itself back around.
The explanation for this trend may lie in the fickle nature of the STHs. The cost basis is an important level for these investors, and when a retest of it happens, they panic and show some reaction.
During uptrends, these holders are more likely to buy more when a retest of their cost basis occurs since they may think that the same price levels that were profitable earlier will be so again in the near future.
Naturally, it’s not a certainty that Bitcoin would also end up retesting this level in this bull market. Still, a correction might reach close to it if the historical precedent is anything to go by.
BTC Price
Following its 7% drop in the past day, Bitcoin is trading at around $67,700.
What Happens Next in COPA vs Craig Wright Trial is Down to the Judge
The Crypto Open Patent Alliance is seeking several court injunctions from Wright.
Altcoins Fall: Will Ethereum And Solana Bulls Surpass Expectations?
After a six-week run, altcoins are cooling off, leading some to fear the worst. However, in a post on X, one crypto analyst urges calm, saying the dip is a normal part of any bull market and may even present opportunities for discerning traders and investors.
Altcoins Drop, Follow Bitcoin
After posting solid gains and rallying to as high as $73,800 on March 13, Bitcoin edged lower on March 14 and continues under pressure when writing. Considering the positive correlation between Bitcoin and altcoins, leading altcoins like Ethereum, XRP, Cardano, and Solana retraced slightly.
Related Reading: Bitcoin Crash Triggered By Failed $1 Billion Hedge Fund Spread Trade: Expert
When writing, Ethereum is far from the $4,090 recorded last week. At the same time, the Solana uptrend has slowed, with $200 proving elusive for optimistic traders. Meanwhile, XRP, despite the high optimism when prices roared higher on March 11, is struggling for momentum and is currently trending lower.
While the altcoin has been drawn down, the total crypto market cap drop and fear creep in have caused the analyst to remain bullish. Despite the correction, the altcoin uptrend remains, and most coins, including Ethereum, Solana, and Cardano, could post more gains.
Ethereum, Solana, and BNB Fundamentals Are Solid
To illustrate, the crypto community remains upbeat because of Dencun and its potential to enhance Ethereum and the broader layer-2 ecosystem. Ethereum rollup platforms, including Base and Optimism, that have activated Dencun features have seen decentralized applications (dapps) launching on their platforms benefit.
Uniswap Labs, the team behind Uniswap, a leading decentralized exchange, reported that transaction fees on users trading on Optimism have fallen even further after activating Dencun. This reduction in fees may be a catalyst to drive more activity on-chain, propping up prices.
On the other hand, Solana bulls are upbeat. Since September 2023, SOL has been on a sharp uptrend. At spot rates, the coin roared to register fresh 2024 highs.
With this performance, Solana outperforms Bitcoin and other altcoins, including ETH. CoinMarketCap data shows that SOL has risen by 15% in the past week, closely trailing BNB, the native currency of the BNB Chain ecosystem.
Analysts are looking at the upcoming Firedancer upgrade to fortify Solana’s infrastructure further and increase reliability. Meanwhile, regulatory developments in the United States are evolving positively, propping up altcoins, mainly BNB.
Overall, the crypto uptrend remains even with prices cooling off. More importantly, even with falling prices, sentiment remains bullish. In the past week, CoinMarketCap data shows that the Crypto Fear and Greed Index is at “extreme greed” territory.
Bitcoin Suffers Crash To $65,000 As Spot ETF Inflows Wane
Bitcoin is closing out the week on a rather bearish note after suffering a massive crash in the early hours of Friday. The crash pushed the price below $66,000, drawing the rest of the crypto market down with it in the process. The reason for this crash could be traced back to what started the bull run in the first place – Spot Bitcoin ETFs.
Spot Bitcoin ETF Net Flows Suffer
After a long strength of what seemed to be only inflows for Spot Bitcoin ETFs across the space, institutions seem to be scaling back on their buying this week. The data aggregation platform Spot On Chain, revealed that net flows into these ETF dropped drastically over the last few days.
The decline was first noted on Wednesday, March 3, when daily net inflows had experienced a 38% crash. Interestingly, Wednesday had seen the second-largest daily inflow for these Spot BTC ETFs. However, with outflows ramping up at the same time, the net inflows have begun to wane.
This trend continued on Thursday, March 14, as net inflows into the Spot ETFs registered another massive crash. This time around, it fell 80.6% compared to the prior day, which had already seen a 38% decline. As a result, the ETFs saw their worst trading day in over a week.
BTC #ETF Net Inflow Mar 13, 2024: +$684M
• The net inflow dropped by 38.3% compared to the previous day but remains the second-largest inflow per day since ETF inception.
• The cumulative total net inflow after 43 trading days is $11.82B.
• BlackRock ($IBIT) now holds… https://t.co/hziFc5Uy4v pic.twitter.com/DGsnfVecZF
— Spot On Chain (@spotonchain) March 14, 2024
Nevertheless, the ETFs are still seeing positive inflow which suggests that outflows continue to dim compared to inflows. However, if the outflows continue to rise, then Bitcoin could suffer tremendously from this, with an example of what could happen being the market crash from the Grayscale Bitcoin Trust outflows.
BTC Price Struggles To Recover
After falling to $65,600. The Bitcoin price is struggling to recover from the flash crash. There was a quick buy up of the dip, indicating a lot of demand for BTC at low prices. This demand has been able to brush up the price, causing it to rise once more before being rejected at $68,700.
Presently, the BTC price is circling $66,500, with the $68,000 level proving to be the next significant resistance for the price. But even if the crypto was able to beat this level, there is still the matter of the mounting resistance at $68,700, making it an important resistance level to beat.
The crash has seen Bitcoin’s price decline over 8% in the last day, bringing its market cap down to $1.33 billion. This crash has also proven detrimental for altcoins, with the likes of Ethereum, Dogecoin, and Cardano seeing an average decline of 10%.
Michael Saylor’s MicroStrategy Prices Upsized $525M Debt Offering to Buy More Bitcoin
The firm announced its plans to raise $500 million in a debt offering on Wednesday only days after purchasing 12,000 BTC with the proceeds of a previous $700 million offering.


