Bitcoin’s Big Breakout: This Bullish Pattern Signals An Imminent Price Surge

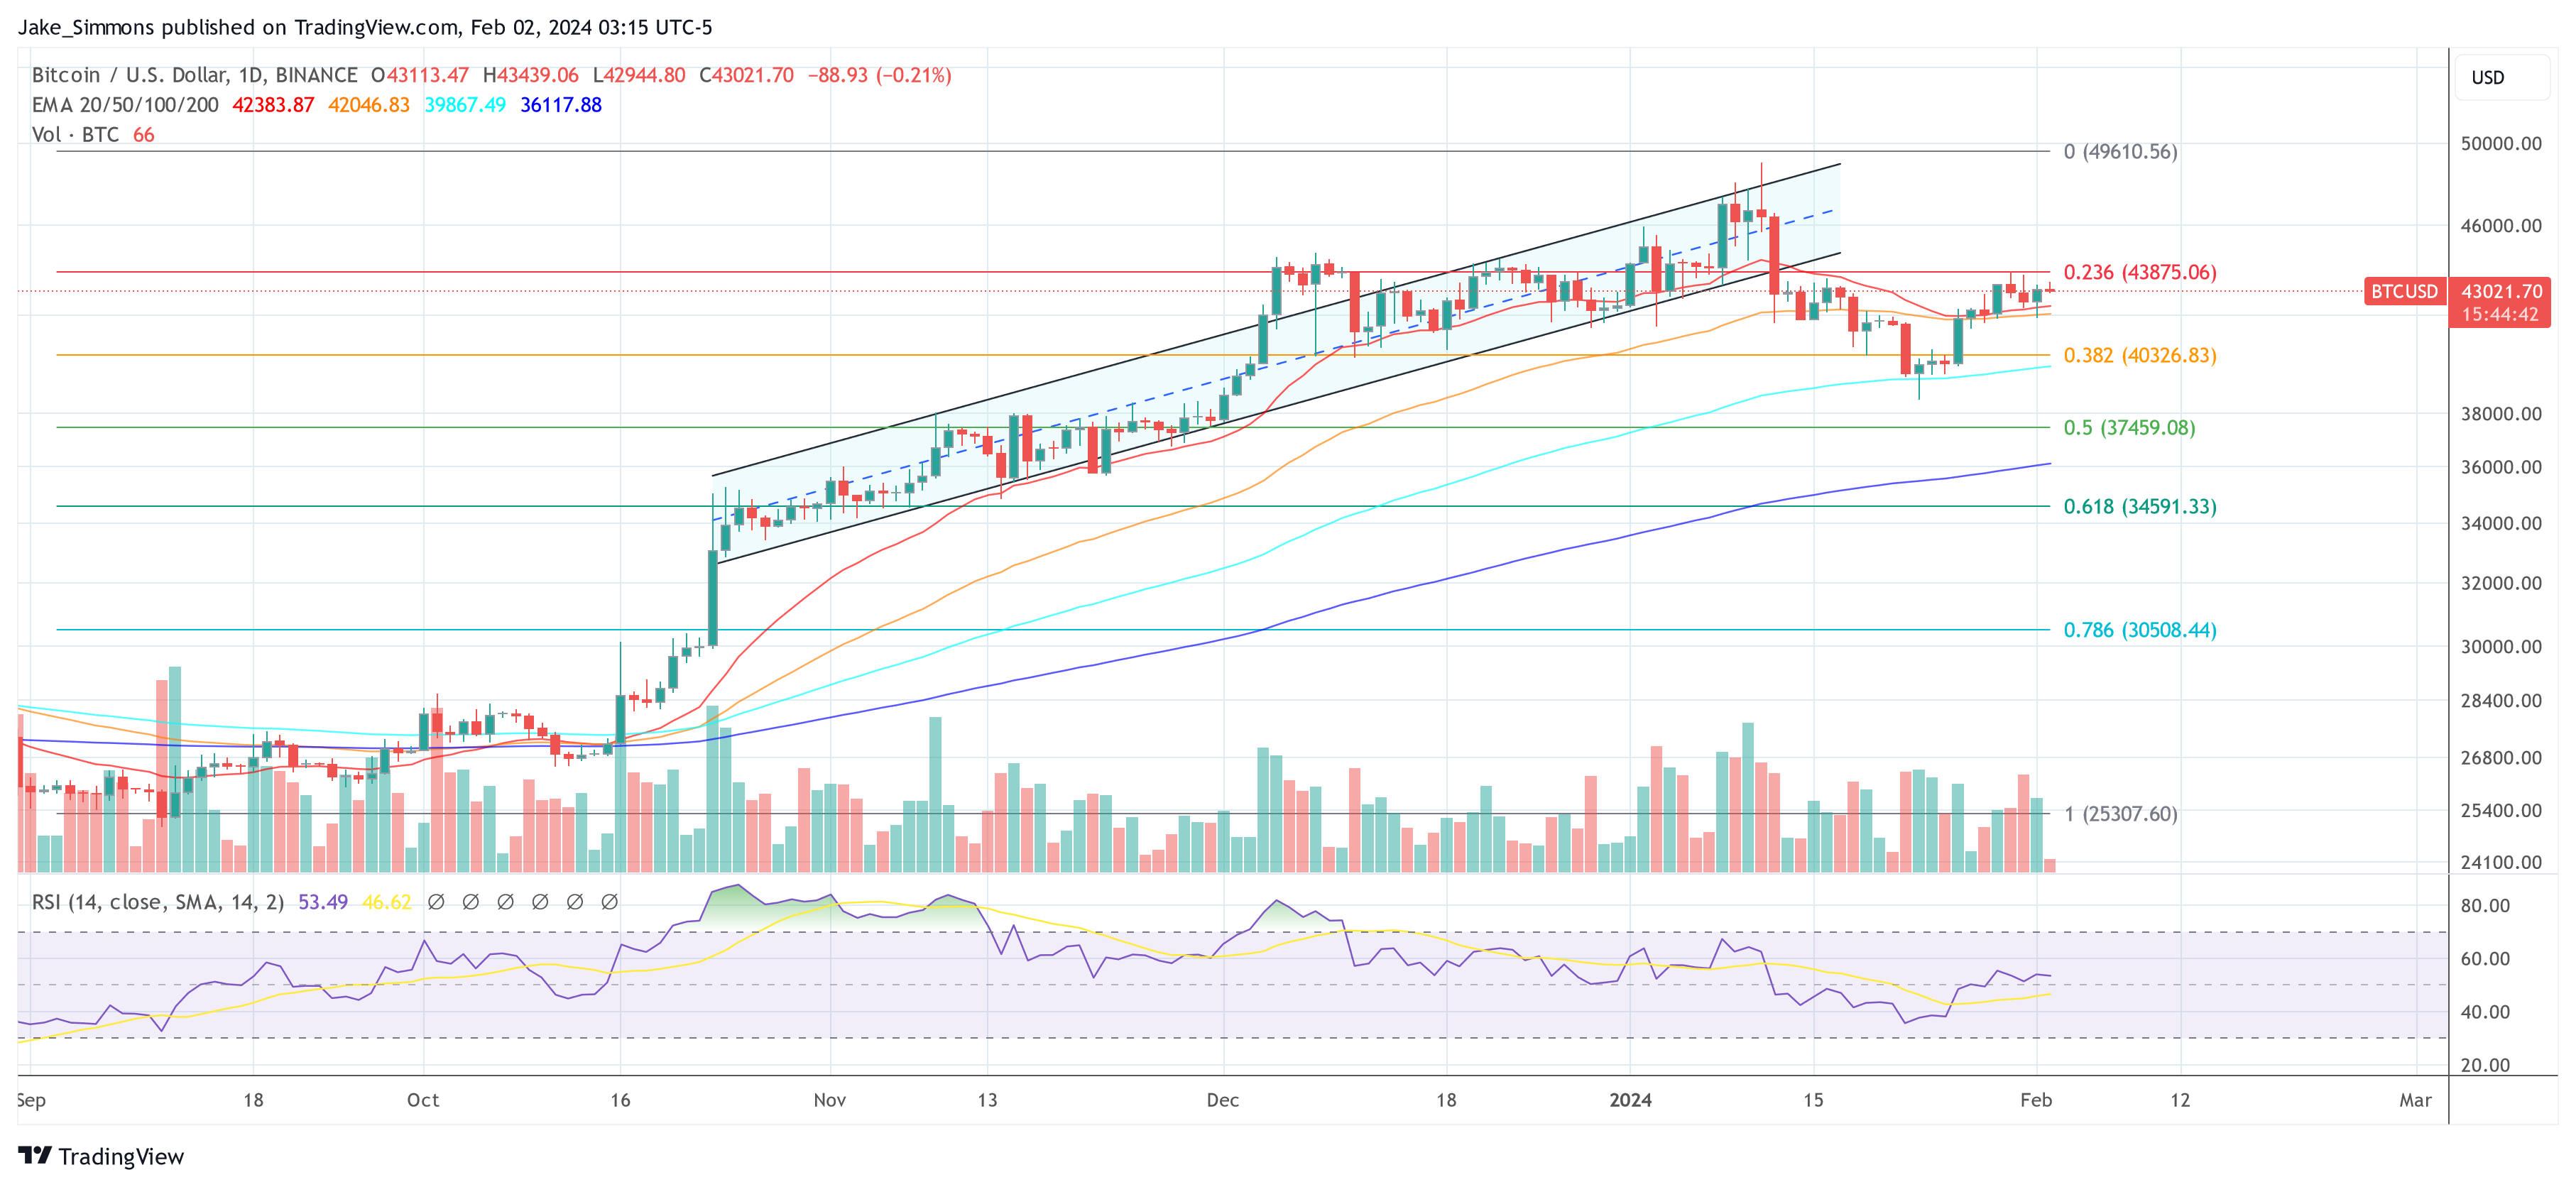
Market analysts have recently observed a notable pattern in Bitcoin price chart, potentially signaling a shift in the market trend. Jake Wujastyk, a prominent market analyst, has particularly pointed out the emergence of an inverse head and shoulders pattern on Bitcoin’s daily candle chart.

This pattern, coupled with Bitcoin’s closing price above a significant “volume shelf” signals an imminent upward trajectory for Bitcoin.

Bitcoin Surge On The Horizon

In technical analysis, an inverse head and shoulders pattern is traditionally interpreted as a bullish signal. It is characterized by two lower peaks (shoulders) on either side of a far-down valley (head). The completion of this pattern occurs when the price breaks above the resistance level, known as the “neckline.”

In Bitcoin’s case, this neckline also aligns with a ‘volume shelf,’ as Wujastyk indicates, a price level where many contracts have previously been traded, indicating strong support or resistance.

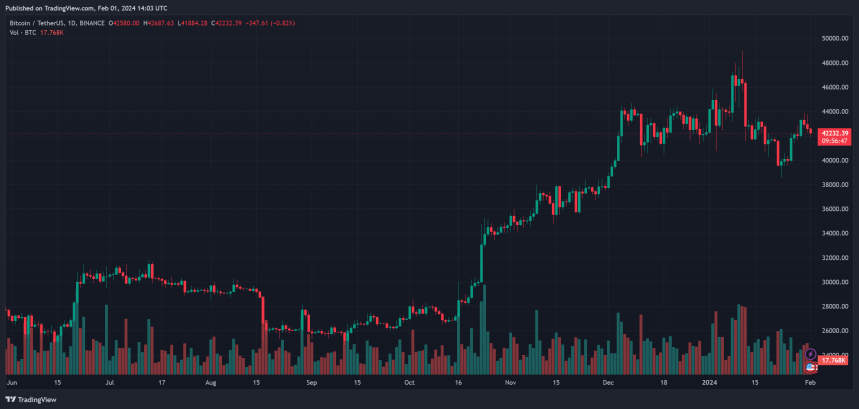
As Bitcoin’s price currently sits above the critical level of $43,000 up by 4.7% in the past week, it suggests a growing momentum among buyers, hinting at a potential uptrend. At the time of writing, Bitcoin has seen a 2.1% increase in its price over the past 24 hours, reaching $43,144.

Bitcoin (BTC) price chart on TradingView.com

This price movement occurs against a backdrop of fluctuating daily trading volumes, which have decreased from over $25 billion to below $20 billion in a day.

Notably, this pattern’s emergence is particularly noteworthy as Bitcoin options are set to expire, with 22,000 BTC options nearing their expiry date. These options have a Put Call Ratio of 0.66, a Maxpain point of $42,000, and a notional value of $960 million, as per data from Greekslive.

For context, the Put Call Ratio is a key indicator in options trading, representing the number of put options relative to call options. A lower ratio suggests a bullish sentiment, as it indicates more call options (bets on the price rising) are being traded compared to put options (bets on the price falling).

Market Trends And BTC Halving Anticipation

The broader crypto market, including Ethereum (ETH) options, is also approaching expiration. 230,000 ETH options are set to expire, with a Put Call Ratio of 0.33, a Maxpain point of $2,300, and a notional value of $530 million. These figures suggest a more bullish outlook for Ethereum compared to Bitcoin.

Furthermore, according to GreekLive, the market has seen subdued activity recently, with both realized volatility (RV) and implied volatility (IV) trending lower for major cryptocurrencies.

However, introducing Bitcoin spot exchange-traded funds (ETFs) is beginning to attract incremental capital to the crypto market, compensating for the slowdown in grayscale sell-off. Meanwhile, the anticipation around Bitcoin’s halving event, scheduled for April 2024, is creating a buzz in the market.

A recent survey by Bitget indicates a bullish sentiment among investors regarding the upcoming Bitcoin halving. 84% of respondents globally believe that Bitcoin will exceed its all-time high of $69,000 in the next bull run.

Predictions for Bitcoin’s price during the halving are varied, with over half expecting it to be between $30,000 and $60,000, while about 30% foresee it is surpassing $60,000.

Featured image from Unsplash, Chart from TradingView
These Are The Four Key Bitcoin Price Levels To Watch, Reveals Analyst

An analyst has revealed the four key Bitcoin price levels that could be to keep an eye on, as they may have an influence on the spot price’s trajectory.

These Are The Four Key Price Points For Bitcoin

In a new post on X, CryptoQuant Netherlands community manager Maartunn has shared four key price levels for Bitcoin. Three of these levels involve some kind of variation of the “realized price” on-chain indicator.

The realized price keeps track of the price at which the average investor on the network acquired their coins. In other words, the metric measures the average cost basis of the asset’s user base.

When the spot price of the cryptocurrency is greater than the realized price, it means that the average holder in the sector can be assumed to be carrying some profits right now. On the other hand, the price being under the indicator implies the market as a whole is underwater some net amount at the moment.

Naturally, the price is exactly equal to the metric, suggesting the average holder is just breaking even on their investment currently. Historically, this is the condition that has been of particular importance for the coin, as such retests can flip the profit-loss situation of the investors.

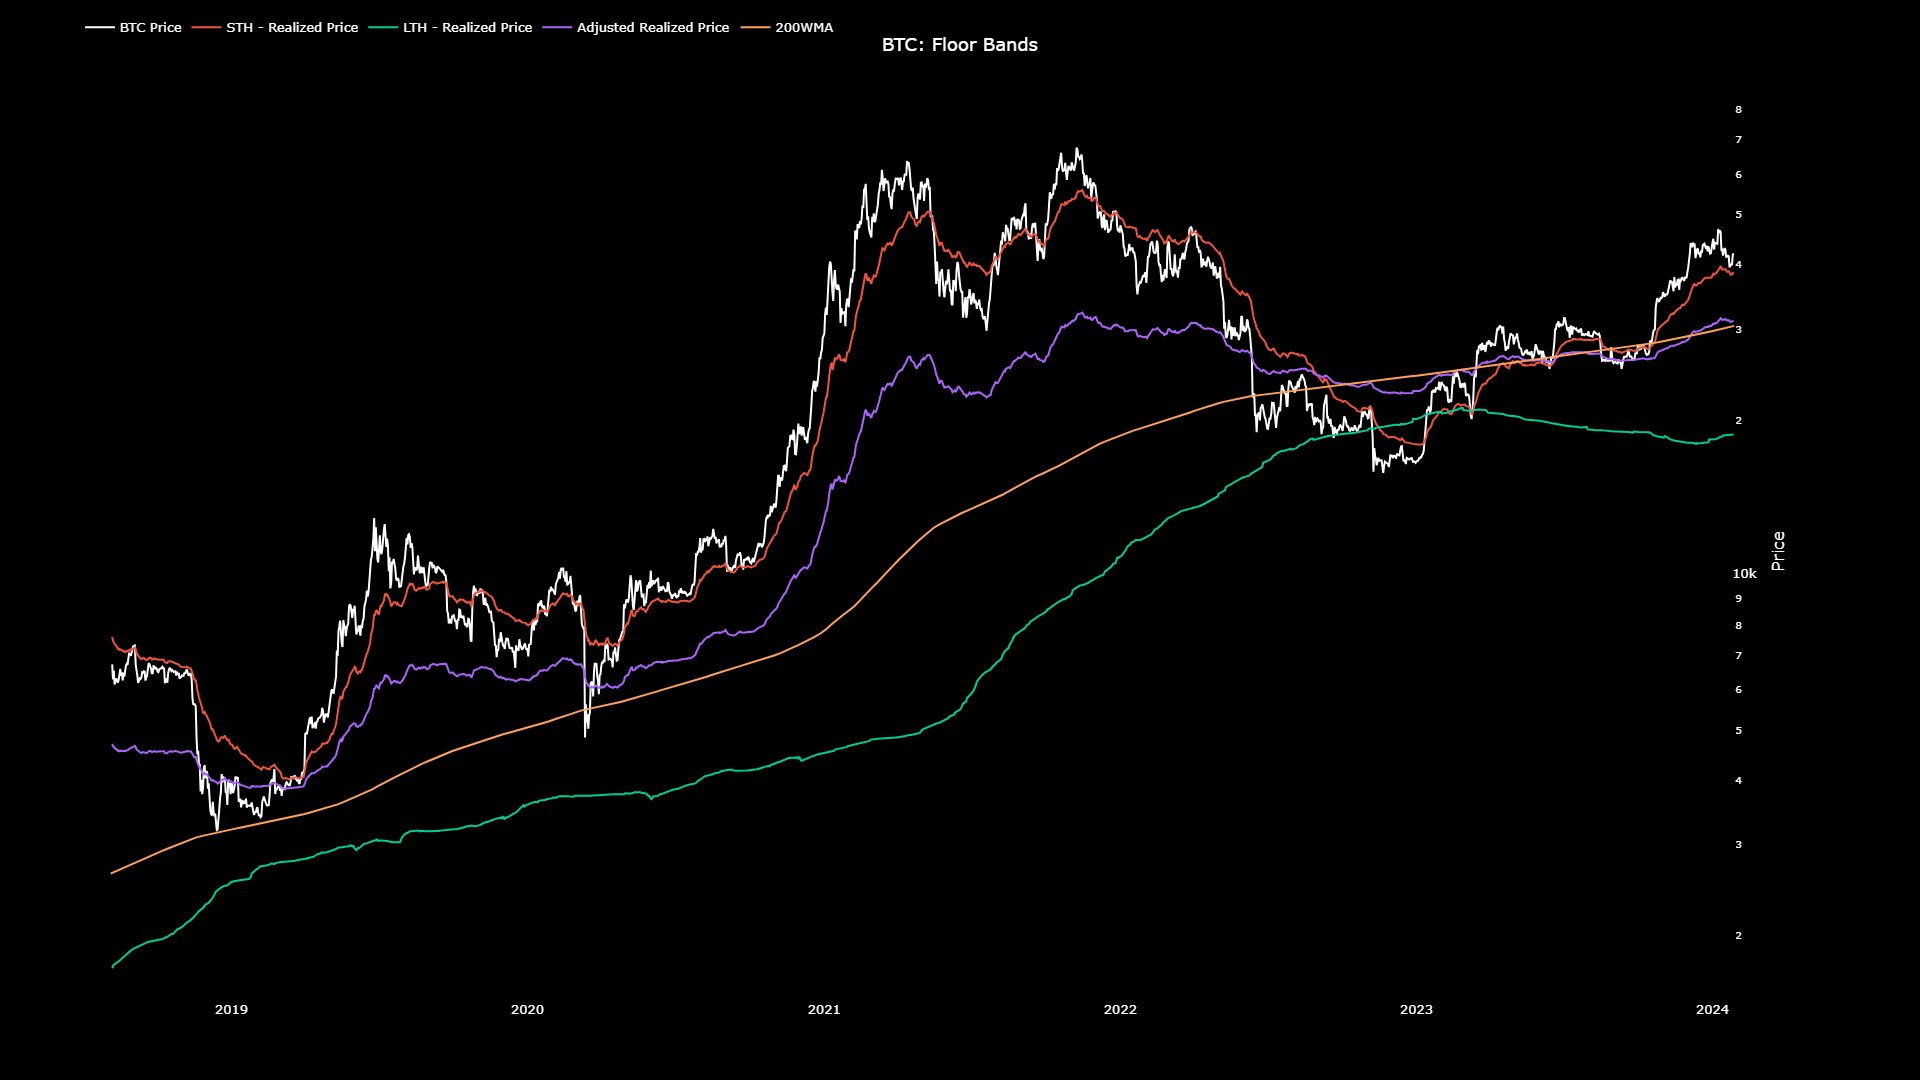
Now, here is the chart shared by Maartunn that reveals the trend in the four key Bitcoin price points in question over the last few years:

Bitcoin Realized Price

In the above graph, the red colored line (which also happens to have the highest value out of these right now) corresponds to the realized price of the “short-term holders” (STHs).

The STHs refer to the investors who bought their coins within the last 155 days. At present, the average cost basis of this cohort stands at $38,750. In bullish periods, this level has often been a point of major support for the asset, and Bitcoin came quite close to retesting it during its latest drawdown.

Opposite to the STHs are the “long-term holders” (LTHs), whose realized price is shown by the green curve in the chart. The indicator’s value is only $18,740 for this cohort currently, implying that these HODLers are carrying high amounts of profits.

The purple line in the graph represents the “adjusted realized price,” which is a metric that provides a baseline for the market in general. Bitcoin found its bottom back in September when it retested this level. Currently, the indicator’s value stands at $31,190.

Close to this line right now is the fourth and final price level pointed out by the analyst, the 200-week moving average (MA), which is at $30,500. 200 weeks is approximately how long the popular 4-year Bitcoin cycle lasts for, so this MA can help reveal the cycle baseline momentum for the coin.

Maartunn, in particular, finds this 200-week MA and the adjusted realized price to be the most intriguing levels out of the four listed here.

BTC Price

Bitcoin had made a visit under the $42,000 level yesterday, but it appears the asset has already bounced back, as it’s now trading above $43,000 again.

Bitcoin Price Chart

Here Are The Largest Institutional Buyers Of Bitcoin This Week

The Spot Bitcoin ETFs have lived up to the hype, as these funds have ramped up institutional adoption of the flagship cryptocurrency, Bitcoin. This is further evident in a recent analysis that captured how much Bitcoin BlackRock and other issuers amassed in this week alone. 

Spot Bitcoin ETF Issuers Purchased Over 19,908 BTC This Week

Data from the on-chain analytics platform Lookonchain shows that the Spot Bitcoin ETF issuers combined to purchase over 19,908 BTC ($860 million) this week. Meanwhile, it is worth mentioning that Lookonchain’s data didn’t capture WisdomTree’s BTC purchases in its analysis, suggesting that the figure could be way higher when the asset manager’s purchases are also factored in. 

Further data obtained from Arkham Intelligence provided insights into how much Bitcoin Wisdom Tree obtained for its Bitcoin fund this week. 74 BTC is shown to have gone into the asset manager’s wallet address for its Spot Bitcoin ETF. The addition of these crypto tokens means that all Spot Bitcoin ETF issuers combined to purchase almost 20,000 BTC this week alone. 

Interestingly, Bitcoin ETFs were recently reported to hold 3.3% of Bitcoin’s circulating supply, underscoring their success since launching. Data from Lookonchain shows that these ETFs currently hold over 657,000 BTC (excluding WisdomTree). 

Matt Hougan, Bitwise’s Chief Investment Officer (CIO), also revealed how these funds have seen flows of $1.7 billion after their first 14 trading days. This is more impressive as he made a comparison to Gold ETFs, which saw $1.3 billion in a similar time frame. In another X post, he mentioned how these Spot Bitcoin ETFs have taken $700 million in net inflows this week alone.

Bitcoin price chart from Tradingview.com (Institutional investors)

BlackRock Finally Trumps Grayscale

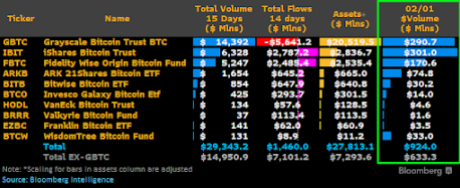
Bloomberg analyst James Seyffart mentioned in an X post that BlackRock’s IBIT looks to have become the first ETF to trade more than Grayscale’s GBTC in a single day. Before now, Grayscale had continued to record the most daily trading volume, although IBIT had come close on a couple of occasions. 

From the data that Seyffart shared, IBIT looks to have recorded $301 million in trading volume on February 1, while GBTC saw $290 in trading volume. However, he further stated that the total trading on the day “was kind of a dud,” with all Spot Bitcoin ETFs combined recording $924 million in trading volume.

Institutional Bitcoin buyers

Interestingly, that happened to be the first day that the daily volume for Spot Bitcoin ETFs was under $1 billion. The Bloomberg analyst didn’t, however, give any opinion as to what could have caused this relatively sub-par performance. 

Analyst Predicts Shocking Bitcoin Price By Year-End Based On ETF Inflows

In an analysis released via X, Thomas Young, managing partner at RUMJog Enterprises, is projecting a staggering upward trajectory for Bitcoin’s price by the end of the year, basing his predictions on the influence of Bitcoin Exchange-Traded Funds (ETFs) inflows. As NewsBTC reported, Grayscale’s GBTC outflows have slowed down significantly recently, resulting in constant net inflows over the past five consecutive days,ranging from $14.8 million to $247.1 million.

The 118 Multiplier Concept

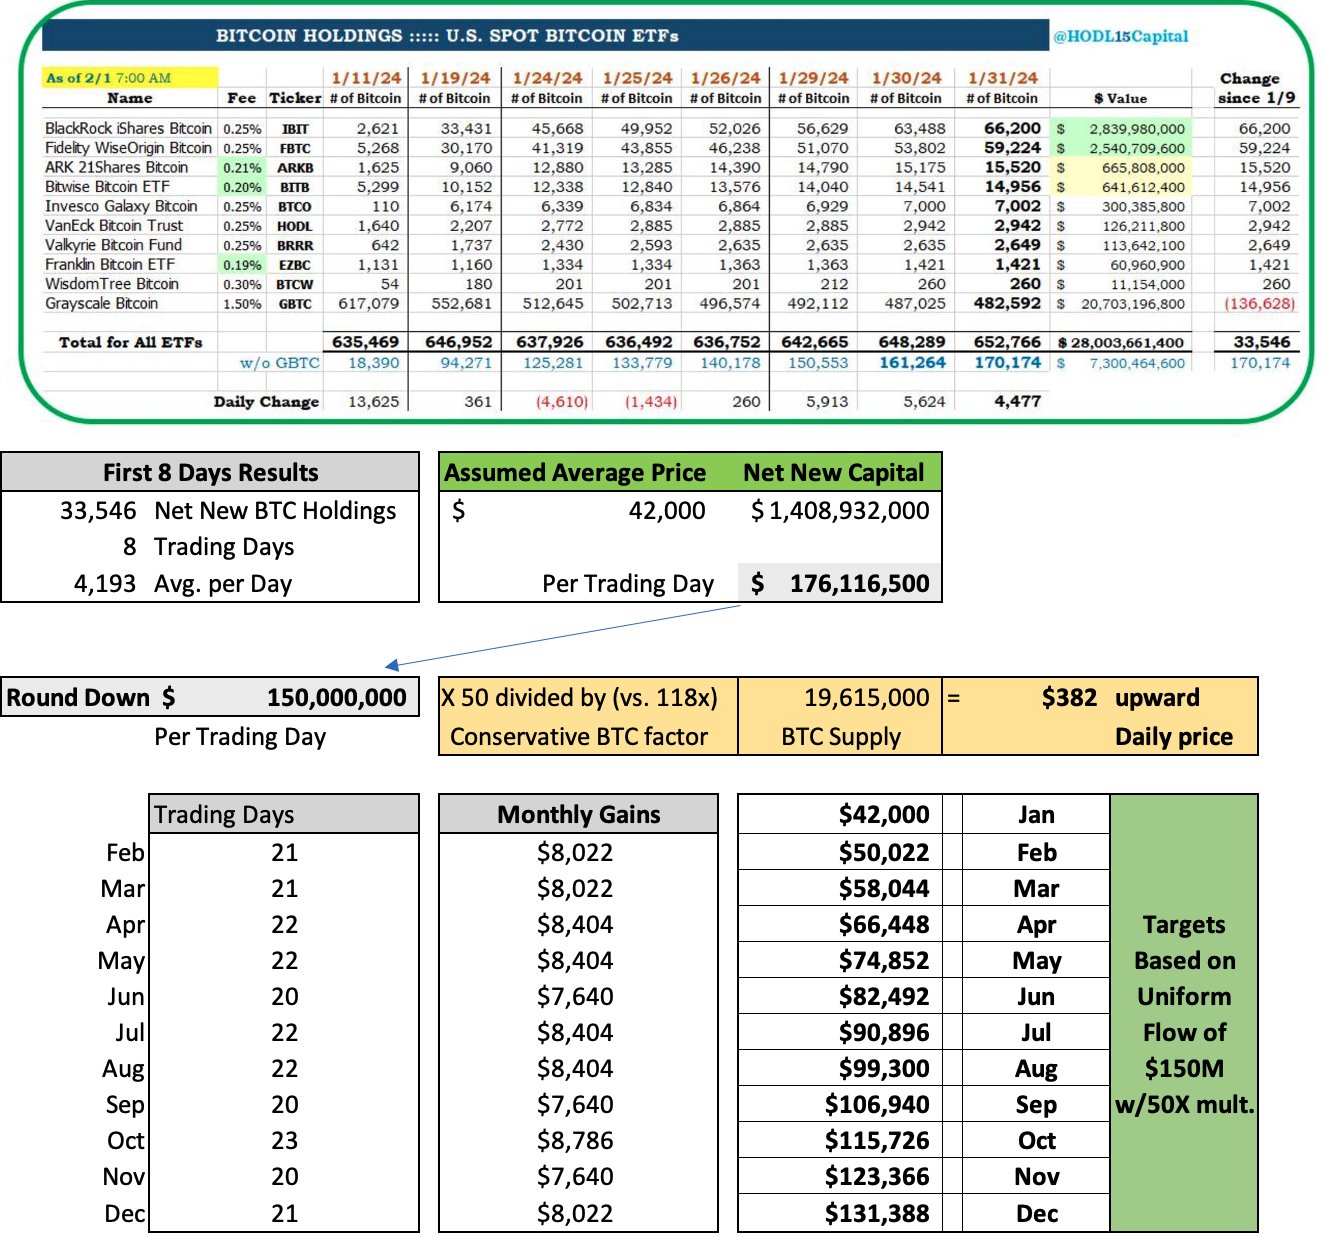
The crux of Young’s analysis hinges on the concept of the ‘118 multiplier’, a metric introduced by Bank of America in March 2021. This multiplier posited that an investment influx of approximately $92 to $93 million was needed to move Bitcoin’s price by 1%. At that time, Bitcoin’s market capitalization was approximately $1.09 trillion, corresponding to a unit price of around $58,332.

Young’s forecast revisits and modifies this concept, emphasizing its non-static nature. He notes, “The Multiplier is a result of several interacting variables, including the volume and velocity of capital inflow, the readily tradable supply of Bitcoin, and external factors affecting risk metrics in the broader market.” Thus, the 118x multiplier is suggested to be a dynamic, rather than a fixed, indicator.

Drawing on data from HODL15Capital, Young observes a consistent growth in Bitcoin ETFs, averaging an influx of 4,193 BTC per day. This translates to approximately $176 million of net new capital daily. For forecasting purposes, Young adjusts this figure to $150 million daily, spread uniformly across the trading days of each month (typically 20-23 days).

Bitcoin Price Could Reach $131,000 By EOY

Applying a more conservative multiplier of 50x, as opposed to the original 118x or 100x, Young calculates an estimated monthly upward price pressure of $8,000 per Bitcoin. This calculation leads to a year-end price target of at least $131,000 for Bitcoin. Young states, “This $131K represents the lower bound of the forecast, acknowledging that actual capital flow may not be uniform and other factors could increase the multiplier.”

The adjusted analysis also takes into account the irregularities observed in January, particularly the one-time selling of GBTC. Young revised the January data to provide a more accurate representation of the trend for the remainder of the year. He suggests, “A rule of thumb: the daily average BTC gain across all ETFs times $2 gives a conservative estimate of the ETF growth’s price effect.”

Based on this model, Young’s monthly Bitcoin price predictions, assuming ETF inflows continue at the rate observed in the first 15 days, are as follows:

  • January: $42,000
  • February: $50,022
  • March: $58,044
  • April: $66,448
  • May: $74,852
  • June: $82,492
  • July: $90,896
  • August: $99,300
  • September: $106,940
  • October: $115,726
  • November: $123,366
  • December: $131,388

Bitcoin price prediction based on ETF inflows

This meticulous analysis from Young not only highlights the potential impact of ETF inflows on Bitcoin’s price but also underscores the complexity and dynamic nature of cryptocurrency markets. However, other events that affect supply and demand dynamics, such as the next BTC halving, as well as macroeconomic developments (Fed rate cuts), among others, are other factors that make price predictions incredibly difficult.

At press time, BTC traded at $43,021.

Bitcoin price

Market Survey Signals Bull Run: Investors Predict Bitcoin To Surpass $69,000 Post Halving

A recent survey conducted by Bitget has shed light on investors’ optimistic outlook towards the upcoming Bitcoin (BTC) halving event scheduled for April 2024. Notably, the survey indicates that most respondents anticipate Bitcoin surpassing its all-time high (ATH) of $69,000 during the next bull run. 

The study also highlights diverse predictions for Bitcoin’s price during the halving and provides insights into investment intentions across different regions.

Bullish Sentiment Soars

According to the survey, an overwhelming 84% of respondents globally predict Bitcoin will exceed its previous ATH of $69,000 in the next bull run. This sentiment is particularly strong in Latin America, East Asia, and South East Asia. However, European regions exhibit more conservative expectations.

The survey reveals diverse predictions for Bitcoin’s price during the halving. While more than half of the respondents anticipate a price range between $30,000 and $60,000, around 30% believe that BTC’s price will surpass $60,000. The optimism is especially pronounced in markets like Latin America.

Moreover, approximately 70% of respondents expressed plans to increase their crypto investments, indicating robust confidence in the potential of the crypto market. 

The study highlights a stronger inclination to increase investments in regions like the Middle East/North Africa (MENA) and East Europe. In contrast, South East and East Asia present a more mixed investment outlook.

The survey reveals interesting regional variations in sentiment and expectations. Western European investors exhibit a “short-term cautious, long-term optimistic” sentiment, while Western Europe shows a relatively conservative outlook during the halving period. 

Gracy Chen, Managing Director of Bitget, emphasizes the significance of the survey results in understanding the evolving landscape of cryptocurrency investment, stating: 

We are pleased to see such positive sentiment emerging as market conditions continue recovering. At Bitget, we firmly believe in Bitcoin’s potential to establish itself as a truly global store of value.

Bitcoin Halving Cycles

Renowned crypto analyst Rekt Capital has delved into the historical patterns surrounding Bitcoin halving events, shedding light on the typically occurring five phases. 

  • Pre-Halving Period:
    The pre-halving period refers to the approximately 77 days leading up to the Bitcoin halving event in April 2024. Historically, this period has presented attractive opportunities for investors, as deeper retraces tend to generate excellent returns in the months following the halving. 
  • Pre-Halving Rally:
    According to Rekt, a pre-halving rally typically occurs approximately 60 days before the halving. Investors “buy the hype” in anticipation of the halving, aiming to “sell the news” and realize profits. Short-term traders and speculators capitalize on the hype-driven rally before selling their positions. The subsequent selling pressure contributes to a retrace known as the pre-halving retrace.
  • Pre-Halving Retrace:
    The pre-halving retrace occurs a couple of weeks before the actual halving event. In 2016, this retrace reached a depth of -38%, while in 2020, it was -20%. Interestingly, Rekt emphasizes that this phase can last for several weeks, leading some investors to question whether the halving will act as a bullish catalyst for Bitcoin’s price.
  • Re-Accumulation:
    Following the pre-halving retrace, a period of re-accumulation typically takes place, lasting up to 150 days or approximately five months. During this phase, Bitcoin experiences consolidation as investors reposition and accumulate more assets. 
  • Parabolic Uptrend:
    Once Bitcoin breaks out of the re-accumulation phase, it enters a parabolic uptrend characterized by accelerated growth and a journey toward new all-time highs. This phase represents the culmination of the halving cycle, where Bitcoin’s price experiences significant upward momentum.

Bitcoin

Featured image from Shutterstock, chart from TradingView.com

Bitcoin Price Could See “Liftoff” if It’s Able to Hold One Crucial Level

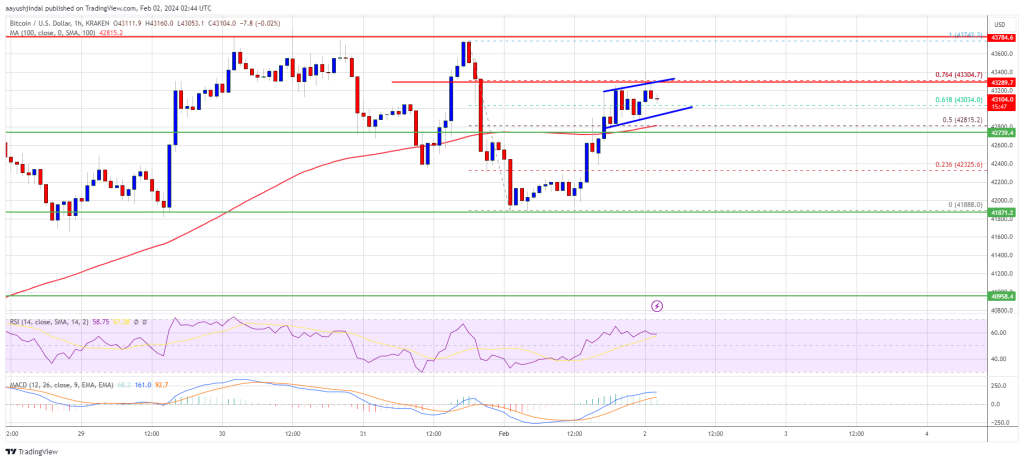
Bitcoin price is attempting a fresh increase from the $42,000 support. BTC could gain bullish momentum if it clears the $43,300 resistance zone.

  • Bitcoin price is attempting a fresh increase above the $42,750 resistance zone.
  • The price is trading above $42,800 and the 100 hourly Simple moving average.
  • There is a short-term rising channel forming with support near $42,950 on the hourly chart of the BTC/USD pair (data feed from Kraken).
  • The pair could continue to rise unless there is a close below the $42,350 support zone.

Bitcoin Price Remains Supported

Bitcoin price formed a base above the $42,000 level and started a steady increase. BTC was able to climb above the $42,200 and $42,500 resistance levels.

There was a move above the 50% Fib retracement level of the downward wave from the $43,740 swing high to the $41,888 low. The bulls were able push the price above the $43,000 resistance. There is now a short-term rising channel forming with support near $42,950 on the hourly chart of the BTC/USD pair.

Bitcoin is now trading above $42,800 and the 100 hourly Simple moving average. Immediate resistance is near the $43,300 level. It is near the 76.4% Fib retracement level of the downward wave from the $43,740 swing high to the $41,888 low.

The next key resistance could be $43,750, above which the price could start a decent increase. The next stop for the bulls may perhaps be $44,000.

Bitcoin Price

Source: BTCUSD on TradingView.com

A clear move above the $44,000 resistance could send the price toward the $44,200 resistance. The next resistance is now forming near the $44,500 level. A close above the $44,500 level could push the price further higher. The next major resistance sits at $45,000.

Another Decline In BTC?

If Bitcoin fails to rise above the $43,300 resistance zone, it could start another decline. Immediate support on the downside is near the $43,000 level and the channel trend line.

The first major support is $42,800 and the 100 hourly SMA. The main support could be $42,350. If there is a close below $42,350, the price could gain bearish momentum. In the stated case, the price could dive toward the $41,800 support.

Technical indicators:

Hourly MACD – The MACD is now gaining pace in the bullish zone.

Hourly RSI (Relative Strength Index) – The RSI for BTC/USD is now above the 50 level.

Major Support Levels – $42,800, followed by $42,350.

Major Resistance Levels – $43,300, $43,800, and $44,500.

Bitcoin Buzz: Accumulation Trend Peaks At A 3-Year High – What’s Driving The Surge?

According to data shared by renowned crypto analyst Ali, Bitcoin has recently witnessed a significant development in its investment dynamics, marking a notable shift in the crypto market.

In a post on X published earlier today, Ali disclosed that Bitcoin is experiencing a substantial accumulation streak, which has not been seen in nearly three years.

According to the analyst, this surge in the Accumulation Trend Score indicates the growing confidence among larger entities in the cryptocurrency market.

Ali’s shared data further reveals that the Accumulation Trend Score for Bitcoin has consistently hovered near the peak level of 1 over the past four months. This sustained high score signals an active and ongoing accumulation by big investors.

A Surge In Large-Scale BTC Holdings

Further complimenting this near 3-year accumulation trend streak, Ali’s recent data revealed that the Bitcoin market has welcomed approximately 67 new “whales.” These entities, each holding over 1,000 BTC, represent a 4.50% increase in this category of investors within two weeks.

This increase in whale activity coincided with a period where Bitcoin experienced a notable dip, falling below the critical $39,000 threshold. Ali noted: “While some shivered with fear during the recent price correction, Bitcoin whales were accumulating more BTC.”

This downturn was primarily attributed to a significant outflow from Grayscale, amounting to over $5 billion since the Bitcoin Spot ETF was approved by the US Securities and Exchange Commission (SEC).

However, as this outflow has cooled off, Bitcoin has shown signs of recovery, trading above the $42,500 mark and registering a 6.1% increase in the past week.

Bitcoin (BTC) price chart on TradingView.com

Bitcoin Poised For 40% Surge?

Shifting the focus to the broader financial landscape, Arthur Hayes, founder of BitMEX, has offered an analysis of current economic conditions and their potential impact on Bitcoin. His commentary is particularly relevant in light of recent challenges faced by New York Community Bancorp (NYCB) and the banking sector.

The bank’s significant stock decline, driven by unexpected losses and a substantial increase in loan loss reserves, has raised concerns about the stability and exposure of US regional banks, especially in the real estate sector.

Hayes’s remarks point to a possible near-future scenario where the Federal Reserve might have to intervene by reinstating the Bank Term Funding Program (BTFP) or similar measures to stabilize the banking sector.

He parallels the current situation and the March 2023 banking crisis, suggesting that similar market turbulence could lead to a brief dip in Bitcoin’s value, followed by a significant rally.

Hayes postulates that such developments could see Bitcoin, often regarded as a digital gold or safe-haven asset, experience a surge in value similar to the 40% increase witnessed during the previous banking crisis.

Featured image from Unsplash, Chart from TradingView
BitMEX Co-Founder Backs Solana Amidst Fears of Another US Bank Collapse

In a post on X, Arthur Hayes, the co-founder of the derivatives crypto exchange BitMEX, said it might be time for traders to double down on Solana (SOL) and altcoins in general. Hayes’s comments come at a time of heightened volatility in the broader crypto market, with Bitcoin (BTC) struggling to regain its footing and altcoins, including Ethereum (ETH), posting mixed results.

Time To Switch To Solana?

The co-founder noted that it could be time to get back on the Solana “train.” With this preview, Hayes is convinced that Solana and other altcoins could outperform Bitcoin in the days ahead.

The outlook could be anchored on the possibility of altcoins and Bitcoin rising in the coming sessions. Specifically, Hayes warns that a “few” major banks in the United States could “bite the dust.” 

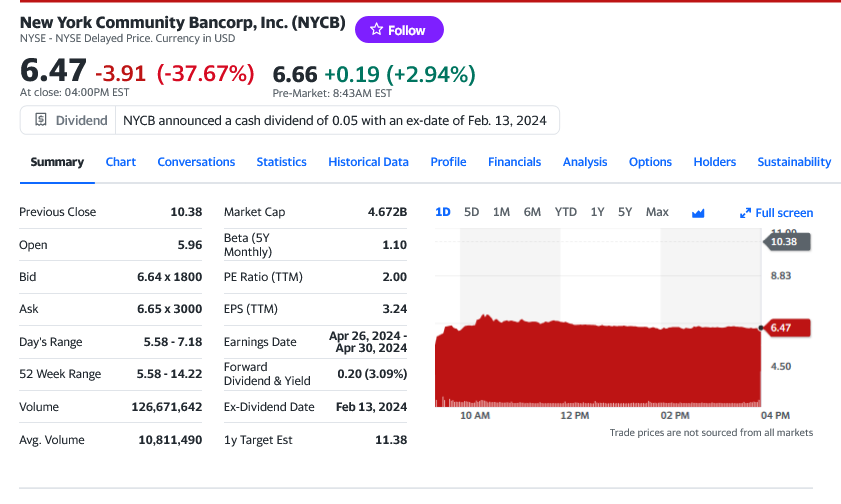
This comment also comes at a critical position in the United States banking landscape. On January 31, market analysts noted that NY Community Bancorp’s stock price plummeted 45% following a surprise quarterly loss and dividend reduction. 

NY Community Bancorp share price plunge | Source: Yahoo Finance

NY Community Bancorp is crucial in the United States regional banking sector. It also acquired assets from Signature Bank when it collapsed in March 2023. 

Analysts say the bank’s decision to expand harmed its balance sheet. The acquisition of Signature Bank increased its regulatory capital requirements, impacting its dividends and provisions, as seen in its latest earnings report.

A Bank Crisis Is A Boon For Bitcoin, Altcoins

While Hayes’ comments are likely to fuel further speculation about the potential for another banking crisis in the United States, it is not immediately clear whether this might spark a crypto rally. 

However, reading from past events, if indeed a major bank in the United States collapses and files for bankruptcy in the next few days, Bitcoin will likely rally. In March 2023, following the collapse of Signature Bank, among others, Bitcoin initiated a crypto rally that saw Ethereum and Solana record gains.

Considering the significant shift in Solana investor sentiment over the past few months, it is likely that SOL might snap back to trend. In that case, the altcoin might break above $125, extending 2023 gains. 

Solana price trending sideways on the daily chart | Source: SOLUSDT on Binance, TradingView

When writing, SOL is pinned below $100 and under pressure. The local resistance is at $105. A break out might lift the coin towards $125 in a buy trend continuation pattern.

BitMEX Whales Buy Bitcoin: What History Says Will Happen Next

On-chain data shows the Bitcoin price has followed a particular pattern when the BitMEX whales have made large withdrawals.

Bitcoin Exchange Netflow For BitMEX Has Seen A Red Spike Recently

As an analyst in a CryptoQuant Quicktake post pointed out, the cryptocurrency exchange BitMEX has recently observed significant withdrawals from the whales.

The indicator of interest here is the “exchange netflow,” which tracks the amount of Bitcoin entering or leaving any exchange’s wallets. The metric’s value is calculated by subtracting the outflows from the inflows.

When the value of this metric is positive, it means that the inflows outweigh the outflows right now, implying that the investors are depositing a net number of coins to the platform.

Generally, one of the main reasons holders want to transfer their BTC to exchanges is for selling-related purposes, as this trend can have a bearish impact on the asset’s price.

On the other hand, the negative indicator implies net withdrawals are taking place on the exchange. Such a trend can suggest either some fresh buying is occurring or some existing investors are simply transferring the BTC they already own towards self-custody.

In either case, the holders withdrawing from the exchange’s custody can be a bullish sign for the cryptocurrency, implying that these investors potentially plan to hold onto their coins for extended periods.

Now, here is a chart that shows the trend in the Bitcoin exchange netflow for the BitMEX platform over the last few months:

Bitcoin Exchange Netflow

As displayed in the above graph, the Bitcoin exchange netflow for BitMEX has registered large negative values just recently. The investors have withdrawn about 4,000 BTC (equivalent to $168.3 million at the current exchange rate) from the platform during this net outflow spree.

The quant has explained that the price of the cryptocurrency and this metric have followed a specific pattern whenever this trend has occurred. Below is a zoomed-out indicator chart showing the previous instances where negative spikes took form.

quicktake-image

“When a significant volume of Bitcoins is observed leaving BitMEX, one of the leading cryptocurrency trading platforms, it often signals the formation of local bottoms in the price of Bitcoin (BTC),” notes the analyst.

The graph shows that large net withdrawals also occurred on the exchange right before the current rally in the cryptocurrency’s price began in October of last year.

It’s possible that these historical negative spikes in the indicator corresponded to buying from these BitMEX whales, which helped the price bottom out and turned around.

Given this historical pattern, the latest net withdrawals may have a similar effect to some degree on the coin. The quant cautions, however, that “it is essential to closely monitor these trends, as large inflows into the exchange can have the opposite effect, potentially leading to a decrease in BTC price.”

BTC Price

Bitcoin has erased its recent recovery as the asset’s price has returned to the $42,000 mark now.

Bitcoin Price Chart

Bitcoin To $5 Million? S2F Model Predicts When This Will Happen

Using historical and future Bitcoin halving events, the Bitcoin Stock to Flow (S2F) live data chart model has pointed toward a BTC surge to unprecedented highs during the 2028 to 2032 halvings. 

Bitcoin To Hit $5 Million After 2028 Halving

Crypto analyst Bit Harington recently shared insights in a post on X (formerly Twitter) about the potential surges in the price of Bitcoin during the next halving stages. Using data from the Bitcoin S2F chart, Harington predicted the price of Bitcoin would reach $500,000 by the fourth halving, which is taking place in April. 

His predictions were based on the distinctive trend observed in BTC’s price, where the first to third halving phases exhibited a consistent 10x price increase for each successive halving. 

Responding to the post, the creator of the S2F model, Plan B, made a bold prediction, suggesting that the average price of Bitcoin during the 2028 and 2032 halving events could potentially reach an impressive $5 million. 

The cryptocurrency has consistently experienced bullish rallies following each halving event, from the first Bitcoin halving in November 2012 to the third in May 2020. Due to this, many investors and crypto analysts foresee a similar surge in BTC’s price during 2024 halving. 

These expectations could be attributed to the events that typically occur during a Bitcoin halving event. In each halving phase, BTC mining rewards are cut in half, and the supply of the token is reduced, thereby inducing scarcity and increasing the token’s value. 

While these price projections about Bitcoin are made to keep investors alert, it’s important to note that they remain speculations, and models like S2F can be subject to wide margins of error. 

Bitcoin price chart from Tradingview.com (BTC)

Analyst Reveals Key Factors To Consider In 2024 Halving

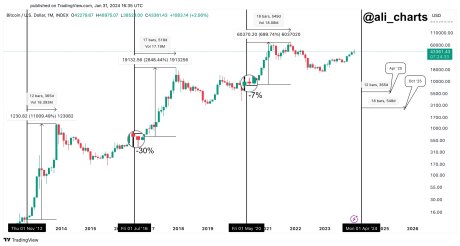
Another crypto analyst, Ali Martinez, has disclosed four crucial factors to keep in mind as the 2024 April Bitcoin halving approaches. Martinez highlighted the significance of the post-halving price corrections in the 2016 and 2020 Bitcoin halving, emphasizing that BTC declined by 30% to 70% within a month after the halving phases. 

He also mentioned BTC’s post-halving rallies, where the cryptocurrency experienced significant surges to 700%, 2,850%, and 11,000%, respectively, during the 2012, 2016, and 2020 halving events. The crypto analyst delved into bull market durations after each halving, which lasted about a year or more.

He concluded his analysis by predicting that the next Bitcoin market top would occur around April or October 2025. At the time of writing, the price of BTC was $42,110, according to CoinMarketCap. 

Bitcoin Set For ‘Dullest Rally’ With A Twist, Whale Forecasts

Bitcoin has been unable to retain its bullish momentum and seems likely to extend its current downside trend. However, the long run remains positive, and the next months could see BTC reach its all-time high, but in a different fashion than in previous rallies, according to a large investor.

As of this writing, Bitcoin trades at $42,000 with a 1% loss in the last 24 hours. Over the previous week, the cryptocurrency still records a 5% profit.

bitcoin btc btcusdt

Bitcoin Whales Makes Bullish Forecast

According to a pseudonym Bitcoin Whale that goes by “Joe007” on social media X, the cryptocurrency is poised for a bull run. The institutions trading the US spot Bitcoin Exchange Traded Fund (ETF) will drive this bullish momentum.

In that sense, these institutions are likely to suck the volatility out of Bitcoin by pushing to trade similar to traditional assets. Thus, Joe007 claims that this cycle’s rally will lack the excitement of 2017 and 2021 when BTC hit $20,000 and $69,000, respectively, creating euphoria amongst investors.

The Bitcoin whale stated:

I think we’re about to witness the most boring rally in Bitcoin history. No retail-driven parabolic swings that excite degens/noobs and produce headlines. Rather a slow relentless drive higher by professional accumulators taking out layer after layer of paper handed holders.

The whale dismissed the possibility when asked if traditional institutions could fail in “taming” BTC due to the “systemic crises” in the space. In addition, Joe007 dismissed the possibility of the cryptocurrency not running higher in the long run.

The only thing that could stand between Bitcoin and a rally is a “low probability” scenario where the traditional finance sector experiences a similar crash to 2008. The BTC whale added:

(…) unless there is a sudden complete tradfi meltdown (2008-style or worse). Then I can see Bitcoin being dragged into a general panic-crash, at least initially. Certainly possible but hard to assign realistic probability.

BTC Price In The Short Term

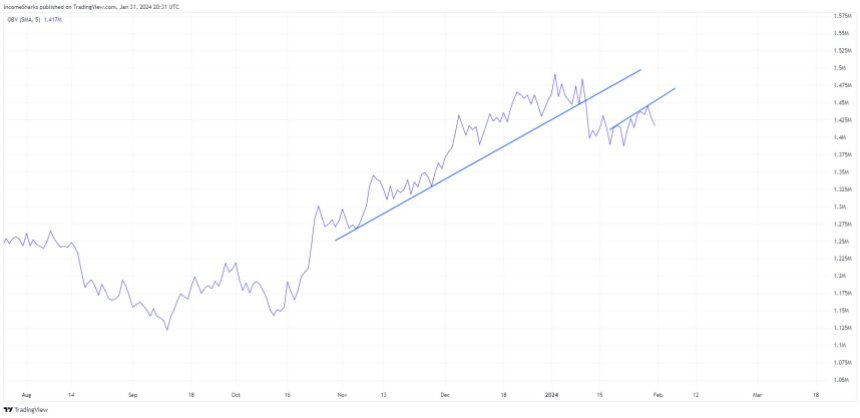
On low timeframes, an analyst pointed at the Daily On Balance Volume (OBV), which suggests further downside for BTC. The chart below shows that this metric broke out of a trending channel during Bitcoin’s recent crash.

bitcoin price btc btcusdt

The OBV was rejected out of a critical level and seems poised to trend to the upside along with the price of BTC. The analyst stated:

Daily OBV still looks like it wants more downside. Looks like this might have been a lower high that we just put in.

Cover image from Unsplash, chart from Tradingview

Bitcoin Halving Prep: Analyst Outlines Key Points Ahead Of Event

Anticipations for the upcoming Bitcoin halving event are high in the cryptocurrency community, with hopes of BTC witnessing a massive rally post-event. Nonetheless, several key factors should be considered prior to the halving.

Important Considerations Ahead Of The Impending Bitcoin Halving

Ali Martinez, a famous cryptocurrency analyst has revealed the major key points investors need to watch out for ahead of Bitcoin halving. The analyst shared his opinions on the subject through the social media platform X (formerly Twitter).

In the X post, Martinez pointed out just four important factors to consider as the event drew near. The upcoming halving, expected to take place by April this year, will be the fourth time it has been done.

One of the first and key areas highlighted by Martinez to spot is the post-Bitcoin halving corrections. Martinez stated that within a month following the 2020 and 2026 halvings, BTC saw substantial corrections, which preceded this price surge.

Bitcoin

He explained that within a month after the 2016 event, the price of Bitcoin fell by 30%. He also said a similar scenario played out in the 2020 halving, which saw price plummet about 7%.

The Bitcoin halving has always been viewed as a bullish development that leads to a significant rise in the price of BTC. This is primarily due to the fact that as demand increases, the quantity of fresh BTC coming into the market declines.

For the second key point to look out for, Martinez has underscored massive post-halving rallies. According to him, there is typically a sharp increase in the price of Bitcoin after the post-halving drop.

In particular, the expert asserted that after the halvings in 2012, 2016, and 2020, the price of Bitcoin surged by 11,000%, 2,850%, and 700%, respectively. Due to this, many experts anticipate that BTC’s price will reach a new all-time high after the event is concluded.

Significant Change In The Market

Martinez’s third crucial aspect to consider is the bull market durations. As is widely known, every previous halving event often ushers in a bull market.

He then shared a calculative time of how long the market rallied during all the previous halving. Martinez stated that the 2012, 2016, and 2020 bull market lasted for 365 days, 518 days, and 549 days, respectively. 

Meanwhile, the last part pointed out by the expert is the next market top. He believes that Bitcoin will get to a new peak by April or October 2025. Martinez anticipates this to take place if only the upcoming event follows historical patterns. So, he has urged the crypto community to be vigilant and observe these patterns.

As of now, BTC is trading a little above $42,000, showing a decrease of almost 2% in the past 24 hours. Its trading volume has increased by 14% today, while its market cap is down by 1.90%.

Bitcoin