BNB Smart Chain Shines In Q1: Triple-Digit Surges In Key Metrics

The Binance Smart Chain (BNB Chain), developed by the world’s largest cryptocurrency exchange by trading volume, Binance, experienced significant growth and performance in the first quarter (Q1) of 2024. 

As highlighted in a recent report by Messari, Binance Smart Chain has surged in market cap, revenue, average daily active addresses, decentralized finance (DeFi), total value locked (TVL), and average daily decentralized exchange (DEX) volume. 

BNB Outperforms Bitcoin In Q1 2024

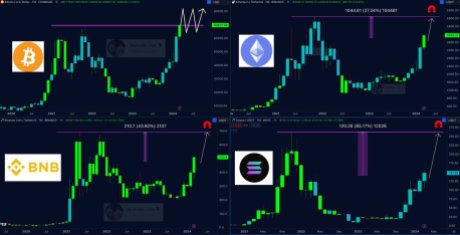
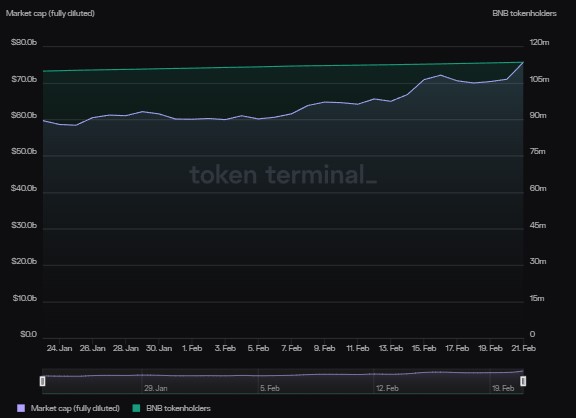
During Q1 2024, BNB Smart Chain demonstrated notable market cap growth, soaring by 89% quarter-over-quarter (QoQ). It reached a market cap of $92.5 billion, securing the third position among all tokens, excluding stablecoins. Only Ethereum (ETH) and Bitcoin (BTC) surpassed BNB in market cap. 

Interestingly, the report notes that BNB’s performance surpassed that of Bitcoin, which saw a 65% increase in outstanding market capitalization over the same period.

BNB

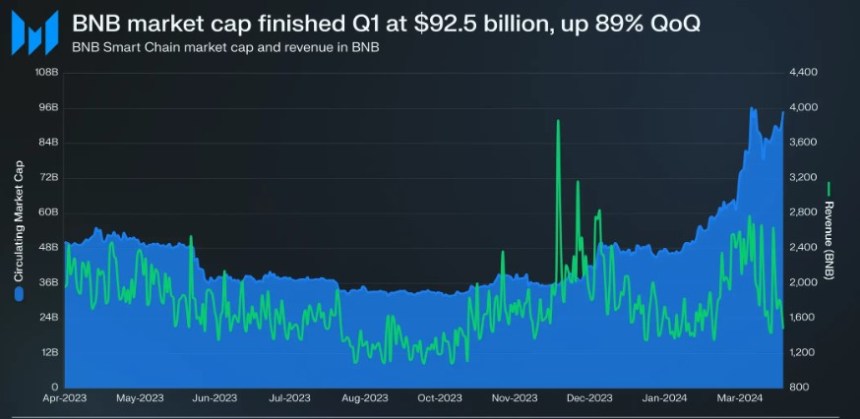
Revenue generated by the Binance Smart Chain experienced a substantial boost in Q1. The network collected $66.8 million in revenue, marking a 70% QoQ increase. 

According to Messari, this surge in revenue was primarily driven by the appreciation of BNB’s price. Notably, Q1’s revenue exceeded that of any quarter in 2023. DeFi transactions, particularly gas fees, were significant in revenue contributions, accounting for 46% of the total.

Despite a slight decrease in average daily transactions, BNB Smart Chain experienced a 27% year-over-year (YoY) increase, demonstrating sustained growth in network activity. 

Average daily active addresses surged by 26% QoQ, reaching 1.3 million. Several protocols on the BNB Smart Chain witnessed increased transaction volumes and active addresses, with Tether’s USDT and decentralized exchange (DEX) PancakeSwap leading the way.

DEX Trading Volume Explodes

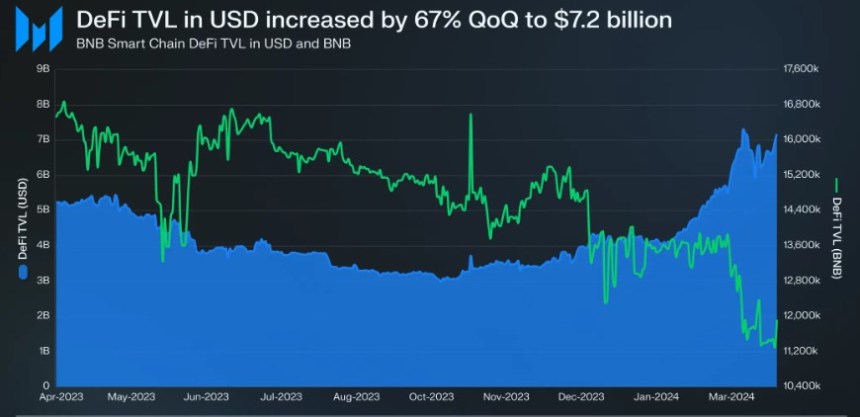
BNB Smart Chain’s DeFi TVL, denominated in USD, experienced a 67% QoQ surge, reaching $7.2 billion. This growth positioned the Binance Smart Chain as the third-highest chain regarding DeFi TVL, denominated in USD. 

However, when denominated in BNB, TVL decreased slightly by 12%. This indicates that the surge in USD value was primarily driven by BNB price appreciation and capital inflows.

BNB

Decentralized exchanges on the Binance Smart Chain witnessed a staggering 193% QoQ increase in average daily trading volume. The total DEX volume for Q1 reached $1.1 billion, with PancakeSwap emerging as the dominant DEX on the platform. 

PancakeSwap’s average daily DEX volume surged by 140% QoQ, surpassing other competitors and solidifying its position as the preferred DEX on the BNB Smart Chain.

Overall, Binance Smart Chain’s performance in the first quarter of 2024 showed significant growth across various parameters, reinforcing its position as an important blockchain platform. 

BNB

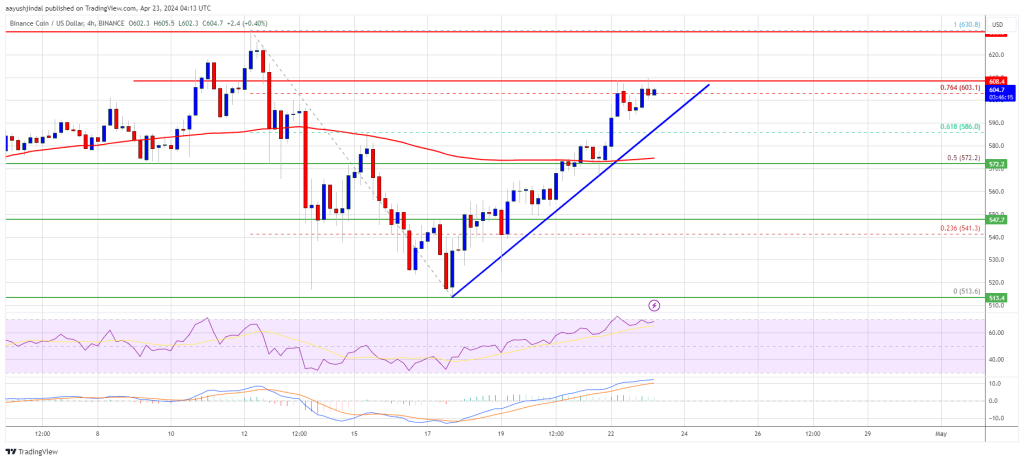
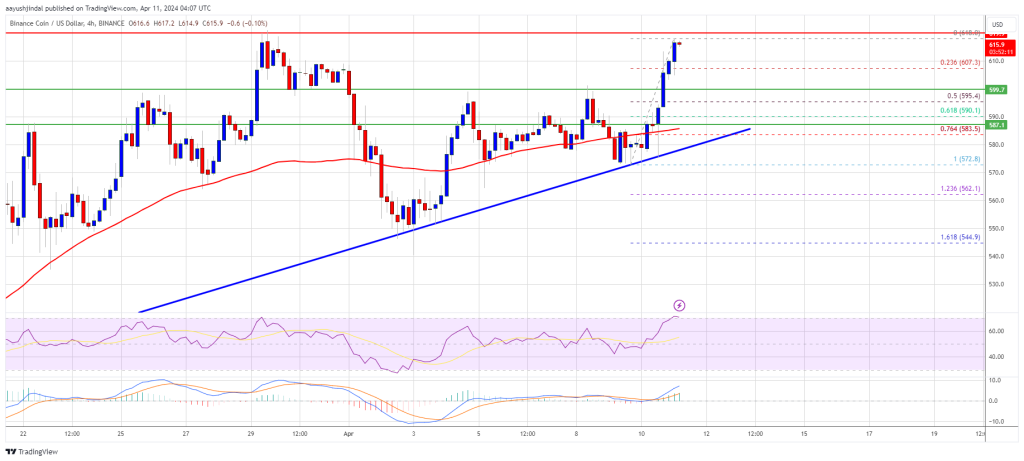
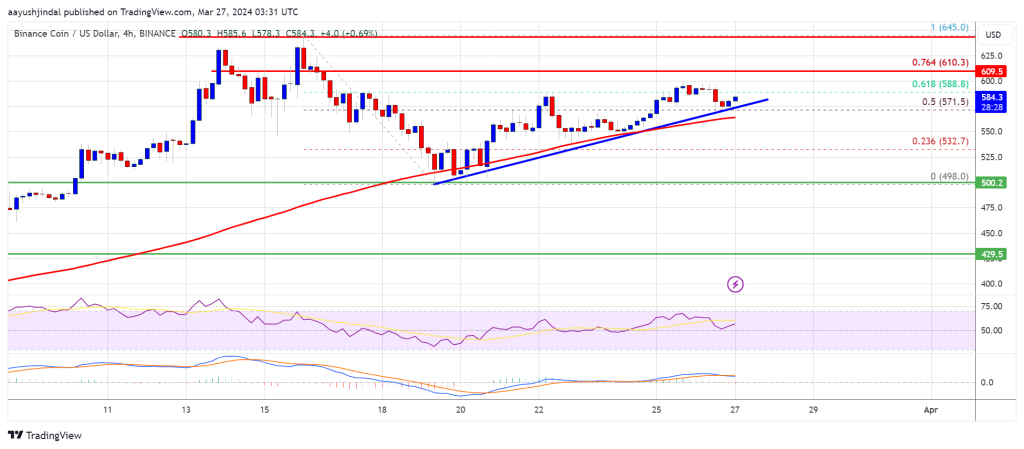
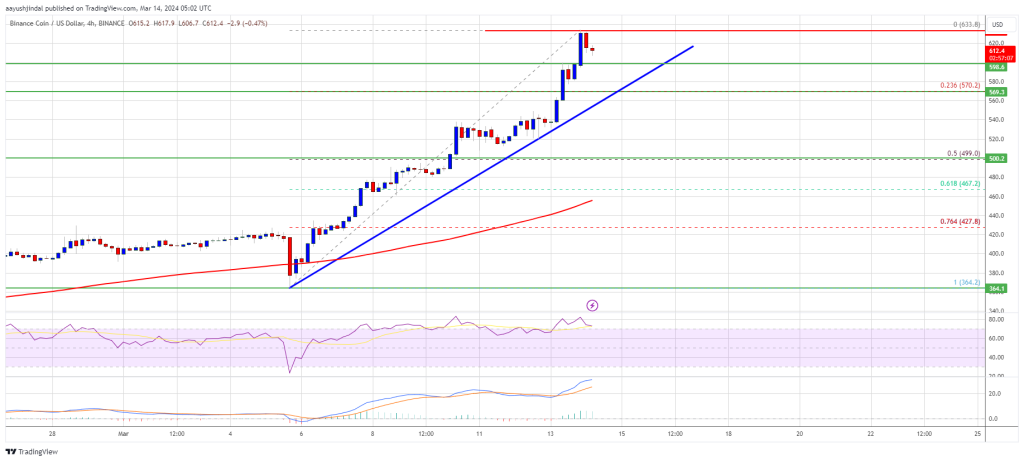
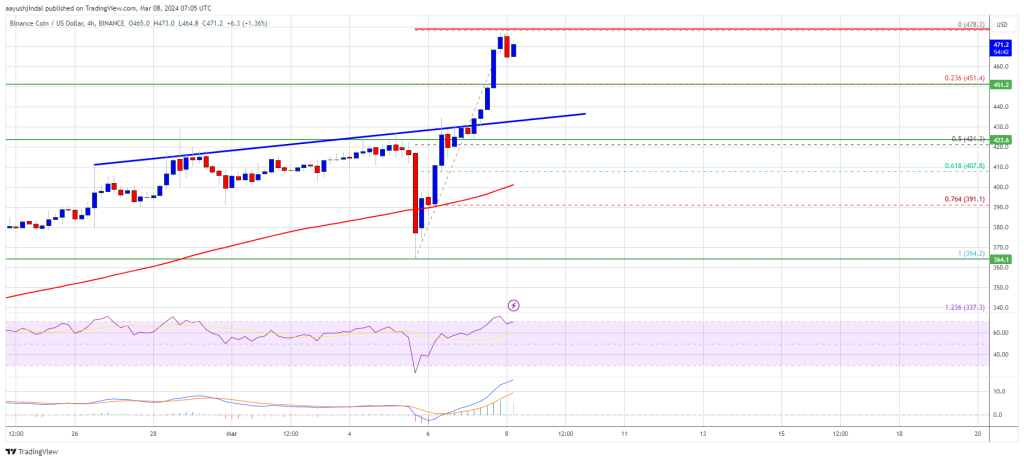
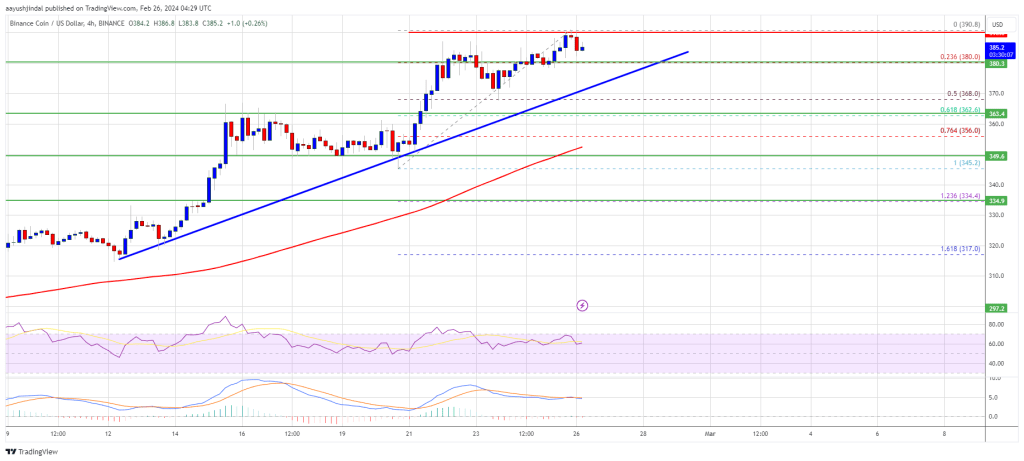
The exchange’s native token, Binance Coin, is currently trading at $607, reflecting a 2% price increase over the past 24 hours and a 10% increase over the past 7 days. 

These positive price movements bring the token closer to its all-time high of $686, reached in May 2021.

Featured image from Shutterstock, chart from TradingView.com

BNB Price Reclaims $600 and Bulls Could Now Aim For New 2024 High

BNB price is attempting a fresh increase from the $550 zone. The price cleared the $600 resistance and might extend its increase above $630.

  • BNB price started a fresh increase after it cleared the $550 resistance zone.
  • The price is now trading above $580 and the 100 simple moving average (4 hours).
  • There is a key bullish trend line forming with support at $592 on the 4-hour chart of the BNB/USD pair (data source from Binance).
  • The pair could gain bullish momentum if it clears the $608-$610 resistance zone.

BNB Price Gains Strength

After forming a base above the $520 level, BNB price started a fresh increase. There was a steady increase above the $550 and $565 resistance levels, like Ethereum and Bitcoin.

The bulls pushed the price above the $580 pivot level and the 61.8% Fib retracement level of the downward wave from the $630 swing high to the $512 low. More importantly, the price is now trading above $580 and the 100 simple moving average (4 hours).

It is consolidating just above the 76.4% Fib retracement level of the downward wave from the $630 swing high to the $512 low. There is also a key bullish trend line forming with support at $592 on the 4-hour chart of the BNB/USD pair.

BNB Price

Source: BNBUSD on TradingView.com

Immediate resistance is near the $608 level. The next resistance sits near the $630 level. A clear move above the $630 zone could send the price further higher. In the stated case, BNB price could test $650. A close above the $650 resistance might set the pace for a larger increase toward the $680 resistance. Any more gains might call for a test of the $720 level in the coming days.

Are Dips Supported?

If BNB fails to clear the $608 resistance, it could start a downside correction. Initial support on the downside is near the $592 level and the trend line.

The next major support is near the $585 level. The main support sits at $570. If there is a downside break below the $570 support, the price could drop toward the $550 support. Any more losses could initiate a larger decline toward the $532 level.

Technical Indicators

4-Hours MACD – The MACD for BNB/USD is gaining pace in the bullish zone.

4-Hours RSI (Relative Strength Index) – The RSI for BNB/USD is currently above the 50 level.

Major Support Levels – $592, $585, and $570.

Major Resistance Levels – $608, $630, and $650.

BNB Resilience: Holding Firm At $560 – What’s Next?

The price of BNB hasn’t fallen below its previous low, and it’s showing some strong signs of heading up. After a spell of moving downward, the Binance Smart Chain’s native token is aiming for an upward bounce back towards its earlier high.

Technical Indicators Point Toward Sustained Uptrend For BNB

To figure out where the BNB price might be headed next, several indicators can be used to examine the chart:

BNB

4-Hour MACD: A technical look at the MACD indicator from the 4-hour timeframe, the MACD histograms are trending above the zero line, and both the MACD line and the Signal line have crossed and are heading towards the MACD zero line, indicating a bullish trend. This can be seen in the above image.

RSI 4-hour Timeframe: The formation of the Relative Strength Index (RSI) in the below image also suggests an upward movement as the RSI signal line is seen trending above the 50% level. This indicates that buyers are still very active in the market therefore overpowering the strength of sellers.

4-hour alligator: A look at the alligator indicator from the 4-hour time frame shows that BNB is trading above the alligator lines as the alligator lip and teeth have both successfully crossed above the alligator jaw, suggesting that the price might be starting a new rally.

BNB

At the time of writing, the price of BNB was up by 1.35% and was trading around $561 in the last 24 hours. BNB price is showing bullish signs and also forming a base above the $508.1 support level. Also, the price is trading above the bearish trend line and below the 100 Simple Moving Average (SMA) on the 4-hour chart.

Final Thoughts

From the previous downward movement, the price of BNB has managed to create one major resistance level of $635 and one major support level of $508. Currently, BNB is moving toward this resistance level and if it breaks above this level, the price might go even further to create a new high. 

On the other hand, if the price fails to break above this major resistance, it will reverse and start a downward movement toward its previous support and if it manages to break below this support level, the price might move further downward thereby starting a new downward trend.

BNB

BNB Price May Have Another Chance For A Bullish Streak: Here’s How

BNB price is attempting a fresh increase from the $515 zone. The price could gain bullish momentum if it clears the $572 resistance zone.

  • BNB price started a fresh increase after it found support near the $515 zone.
  • The price is now trading below $555 and the 100 simple moving average (4 hours).
  • There was a break above a key bearish trend line with resistance at $540 on the 4-hour chart of the BNB/USD pair (data source from Binance).
  • The pair could gain bullish momentum if it clears the $572 resistance zone.

BNB Price Faces Hurdles

After a downside correction below $550, BNB price found support near the $515 zone. A low was formed at $513.6 and the price started a recovery wave, like Ethereum and Bitcoin.

There was a move above the $525 and $530 resistance levels. The bulls pushed the price above the $540 pivot level and the 23.6% Fib retracement level of the downward move from the $630 swing high to the $513 low. There was also a break above a key bearish trend line with resistance at $540 on the 4-hour chart of the BNB/USD pair.

The price is still trading below $550 and the 100 simple moving average (4 hours). Immediate resistance is near the $555 level. The next resistance sits near the $572 level or the 50% Fib retracement level of the downward move from the $630 swing high to the $513 low.

BNB Price

Source: BNBUSD on TradingView.com

A clear move above the $572 zone could send the price further higher. In the stated case, BNB price could test $600. A close above the $600 resistance might set the pace for a larger increase toward the $630 resistance. Any more gains might call for a test of the $650 level in the coming days.

Another Decline?

If BNB fails to clear the $572 resistance, it could start another decline. Initial support on the downside is near the $532 level.

The next major support is near the $520 level. The main support sits at $515. If there is a downside break below the $515 support, the price could drop toward the $500 support. Any more losses could initiate a larger decline toward the $465 level.

Technical Indicators

4-Hours MACD – The MACD for BNB/USD is losing pace in the bullish zone.

4-Hours RSI (Relative Strength Index) – The RSI for BNB/USD is currently below the 50 level.

Major Support Levels – $532, $520, and $515.

Major Resistance Levels – $555, $572, and $600.

BNB Price Regains Strength As The Bulls Aim For $650

BNB price is attempting a fresh increase from the $575 zone. The price is up over 5% and the bulls seem to be aiming for a move above $620.

  • BNB price started a fresh increase after it found support near the $575 zone.
  • The price is now trading above $600 and the 100 simple moving average (4 hours).
  • There is a key bullish trend line forming with support at $587 on the 4-hour chart of the BNB/USD pair (data source from Binance).
  • The pair could gain bullish momentum if it clears the $620 resistance zone.

BNB Price Could Surge 15%

After a downside correction below $600, BNB price found support near the $575 zone. A low was formed at $572.8 and the price started a fresh increase, unlike Ethereum and Bitcoin.

There was a move above the $595 and $600 resistance levels. The bulls pushed the price above the $605 pivot level. It is up over 5% and showing many positive signs above the 23.6% Fib retracement level of the recent increase from the $572.8 swing low to the $618.0 high.

The price is now trading above $600 and the 100 simple moving average (4 hours). There is also a key bullish trend line forming with support at $587 on the 4-hour chart of the BNB/USD pair.

BNB Price

Source: BNBUSD on TradingView.com

Immediate resistance is near the $618 level. The next resistance sits near the $620 level. A clear move above the $620 zone could send the price further higher. In the stated case, BNB price could test $632. A close above the $632 resistance might set the pace for a larger increase toward the $650 resistance. Any more gains might call for a test of the $700 level in the coming days.

Another Decline?

If BNB fails to clear the $620 resistance, it could start a downside correction. Initial support on the downside is near the $600 level.

The next major support is near the $590 level and the trend line or the 61.8% Fib retracement level of the recent increase from the $572.8 swing low to the $618.0 high. The main support sits at $575. If there is a downside break below the $575 support, the price could drop toward the $562 support. Any more losses could initiate a larger decline toward the $550 level.

Technical Indicators

4-Hours MACD – The MACD for BNB/USD is gaining pace in the bullish zone.

4-Hours RSI (Relative Strength Index) – The RSI for BNB/USD is currently above the 50 level.

Major Support Levels – $600, $585, and $575.

Major Resistance Levels – $620, $632, and $650.

Trouble Ahead? Binance Coin Futures Market Under Pressure With Negative Funding Rates

The outlook for Binance Coin (BNB) has turned cloudy, with both futures market data and technical indicators flashing bearish signals. Based on our analysis of Coinglass data, negative funding rates and declining open interest in BNB futures contracts paint a picture of growing pessimism among traders.

A negative funding rate suggests that more traders are holding short positions, anticipating a decline in the price of the asset. This sentiment was confirmed on April 1st, when BNB’s funding rate dipped into negative territory at -0.012%.

Binance Coin Funding Rate And Open Interest Down

Further fueling the bearish narrative, BNB’s futures open interest has also witnessed a slight decline of 0.15%. Open interest reflects the total amount of outstanding futures contracts that haven’t been settled yet.

A decrease in open interest suggests traders are exiting their positions without opening new ones, potentially signaling waning confidence in the market.

Funding rates are a crucial mechanism in perpetual futures contracts that keep the contract price aligned with the spot price. When the contract price trades higher than the spot price, long position holders pay a fee to shorts, resulting in positive funding rates.

Conversely, negative funding rates materialize when the contract price dips below the spot price, indicating that short sellers are currently paying fees to longs.

More Traders Close Their Positions

As negative sentiments mount, this open interest is expected to plummet further. This would imply that more traders are closing their positions and not opening new ones, suggesting a potential price drop for BNB.

The bearish sentiment isn’t confined to the futures market. The Moving Average Convergence Divergence (MACD), another technical indicator, is suggesting a possible resurgence in selling pressure.

There’s an indication that the MACD line might cross below the signal line, typically interpreted as a bearish sign signaling the return of sellers to the market. It’s noteworthy that since March 18th, the MACD lines for BNB have been positioned for a downtrend.

BNB Price Retreat In The Offing?

Considering both the futures market and technical analysis, there’s a potential for a short-term decline in BNB’s price. However, it’s important to acknowledge that market sentiment can shift rapidly, and technical indicators aren’t infallible predictors of future price movements.

At the time of writing, BNB was trading at $587, up 6% in the last 24 hours, data from CoinMarketCap shows.

Meanwhile, a closer look at BNB’s technical indicators on the 24-hour chart reveals another trend.

The Directional Movement Index (DMI), used to gauge trend strength, displayed a bearish crossover where the negative directional index sits above the positive directional index. This positioning suggests that bearish momentum is currently dominating the market.

Analysts commonly interpret this particular crossover as an imperative signal prompting traders to consider exiting long positions and initiating short positions.

This strategic move aligns with the prevailing trend indicated by the DMI, reinforcing the notion of a prevailing bearish sentiment within the market ecosystem.

Featured image from Pexels, chart from TradingView

BNB Price Rally In Jeopardy? Decoding Key Hurdles To Fresh Increase

BNB price is attempting a fresh increase from the $545 zone. The price could gain bullish momentum if it clears the $585 and $590 resistance levels.

  • BNB price started a fresh increase after it found support near the $545 zone.
  • The price is now trading above $560 and the 100 simple moving average (4 hours).
  • There is a key contracting triangle forming with resistance near $585 on the 4-hour chart of the BNB/USD pair (data source from Binance).
  • The pair could attempt a fresh rally if it clears the $590 resistance zone.

BNB Price Eyes Fresh Surge

After a downside correction from $620, BNB price found support near the $545 zone. A low was formed at $546.1 and the price started a fresh increase, unlike Ethereum and Bitcoin.

There was a move above the $560 and $565 resistance levels. The bulls pushed the price above the 23.6% Fib retracement level of the downward move from the $619 swing high to the $546 low. The price is now trading above $560 and the 100 simple moving average (4 hours).

Immediate resistance is near the $585 level. There is also a key contracting triangle forming with resistance near $585 on the 4-hour chart of the BNB/USD pair. It is close to the 50% Fib retracement level of the downward move from the $619 swing high to the $546 low.

BNB Price

Source: BNBUSD on TradingView.com

The next resistance sits near the $590 level. A clear move above the $590 zone could send the price further higher. In the stated case, BNB price could test $620. A close above the $620 resistance might set the pace for a larger increase toward the $640 resistance. Any more gains might call for a test of the $700 level in the coming days.

Another Decline?

If BNB fails to clear the $590 resistance, it could start another decline. Initial support on the downside is near the $555 level and the trend line.

The next major support is near the $545 level. The main support sits at $532. If there is a downside break below the $532 support, the price could drop toward the $500 support. Any more losses could initiate a larger decline toward the $465 level.

Technical Indicators

4-Hours MACD – The MACD for BNB/USD is gaining pace in the bullish zone.

4-Hours RSI (Relative Strength Index) – The RSI for BNB/USD is currently above the 50 level.

Major Support Levels – $555, $545, and $532.

Major Resistance Levels – $585, $590, and $620.

BNB Price Could Resume Upside Unless The Bulls Fail At $610

BNB price is attempting a fresh increase from the $500 zone. The price could gain bullish momentum if it clears the $588 and $610 resistance levels.

  • BNB price started a fresh increase above the $520 and $540 levels.
  • The price is now trading above $575 and the 100 simple moving average (4 hours).
  • There is a key bullish trend line forming with support near $580 on the 4-hour chart of the BNB/USD pair (data source from Binance).
  • The pair could attempt a fresh rally if it clears the $610 resistance zone.

BNB Price Eyes Fresh Surge

After a downside correction from $645, BNB price found support near the $500 zone. A low was formed at $498 and the price started a fresh increase, like Ethereum and Bitcoin.

There was a move above the $520 and $550 resistance levels. The bulls pushed the price above the 50% Fib retracement level of the downward move from the $645 swing high to the $498 low. The price is now trading above $575 and the 100 simple moving average (4 hours).

There is also a key bullish trend line forming with support near $580 on the 4-hour chart of the BNB/USD pair. Immediate resistance is near the $588 level. It is close to the 61.8% Fib retracement level of the downward move from the $645 swing high to the $498 low.

BNB Price

Source: BNBUSD on TradingView.com

The next resistance sits near the $610 level. A clear move above the $610 zone could send the price further higher. In the stated case, BNB price could test $645. A close above the $645 resistance might set the pace for a larger increase toward the $680 resistance. Any more gains might call for a test of the $700 level in the coming days.

Another Decline?

If BNB fails to clear the $610 resistance, it could start another decline. Initial support on the downside is near the $580 level and the trend line.

The next major support is near the $560 level. The main support sits at $540. If there is a downside break below the $540 support, the price could drop toward the $500 support. Any more losses could initiate a larger decline toward the $450 level.

Technical Indicators

4-Hours MACD – The MACD for BNB/USD is gaining pace in the bullish zone.

4-Hours RSI (Relative Strength Index) – The RSI for BNB/USD is currently above the 50 level.

Major Support Levels – $580, $560, and $540.

Major Resistance Levels – $598, $610, and $640.

BNB Price Could Restart Rally If It Is Able To Hold This Key Support

BNB price rallied further above $600 before it faced sellers. The price corrected gains and now testing an important support at $500.

  • BNB price started a downside correction from the $645 resistance zone.
  • The price is now trading near $515 and the 100 simple moving average (4 hours).
  • There is a key bearish trend line forming with resistance near $520 on the 4-hour chart of the BNB/USD pair (data source from Binance).
  • The pair could attempt a fresh increase if it stays above the $500 support zone.

BNB Price Holds Support

In the last BNB price prediction, we discussed the chances of more gains above the $550 resistance zone. The price continued to rise and broke many hurdles near the $580 level.

BNB even outperformed Bitcoin and Ethereum with a move above the $600 resistance. Finally, it faced resistance near the $645 zone. A high was formed near $645 and the price recently started a downside correction. There was a move below the $600 level.

The price declined below the 23.6% Fib retracement level of the upward move from the $365 swing low to the $645 high. The price is now trading near $515 and the 100 simple moving average (4 hours). Immediate resistance is near the $520 level.

There is also a key bearish trend line forming with resistance near $520 on the 4-hour chart of the BNB/USD pair. The next resistance sits near the $550 level. A clear move above the $550 zone could send the price further higher.

BNB Price

Source: BNBUSD on TradingView.com

In the stated case, BNB price could test $580. A close above the $580 resistance might set the pace for a larger increase toward the $600 resistance. Any more gains might call for a test of the $645 level in the coming days.

More Losses?

If BNB fails to clear the $520 resistance, it could continue to move down. Initial support on the downside is near the $500 level or the 50% Fib retracement level of the upward move from the $365 swing low to the $645 high.

The next major support is near the $470 level. The main support sits at $430. If there is a downside break below the $430 support, the price could drop toward the $400 support. Any more losses could initiate a larger decline toward the $350 level.

Technical Indicators

4-Hours MACD – The MACD for BNB/USD is gaining pace in the bearish zone.

4-Hours RSI (Relative Strength Index) – The RSI for BNB/USD is currently below the 50 level.

Major Support Levels – $500, $470, and $430.

Major Resistance Levels – $520, $550, and $580.

Altcoins Fall: Will Ethereum And Solana Bulls Surpass Expectations?

After a six-week run, altcoins are cooling off, leading some to fear the worst. However, in a post on X, one crypto analyst urges calm, saying the dip is a normal part of any bull market and may even present opportunities for discerning traders and investors.

Altcoins bullish wave | Source: Analyst via X

Altcoins Drop, Follow Bitcoin

After posting solid gains and rallying to as high as $73,800 on March 13, Bitcoin edged lower on March 14 and continues under pressure when writing. Considering the positive correlation between Bitcoin and altcoins, leading altcoins like Ethereum, XRP, Cardano, and Solana retraced slightly. 

Related Reading: Bitcoin Crash Triggered By Failed $1 Billion Hedge Fund Spread Trade: Expert

When writing, Ethereum is far from the $4,090 recorded last week. At the same time, the Solana uptrend has slowed, with $200 proving elusive for optimistic traders. Meanwhile, XRP, despite the high optimism when prices roared higher on March 11, is struggling for momentum and is currently trending lower.

While the altcoin has been drawn down, the total crypto market cap drop and fear creep in have caused the analyst to remain bullish. Despite the correction, the altcoin uptrend remains, and most coins, including Ethereum, Solana, and Cardano, could post more gains. 

Ethereum, Solana, and BNB Fundamentals Are Solid

To illustrate, the crypto community remains upbeat because of Dencun and its potential to enhance Ethereum and the broader layer-2 ecosystem. Ethereum rollup platforms, including Base and Optimism, that have activated Dencun features have seen decentralized applications (dapps) launching on their platforms benefit. 

Uniswap Labs, the team behind Uniswap, a leading decentralized exchange, reported that transaction fees on users trading on Optimism have fallen even further after activating Dencun. This reduction in fees may be a catalyst to drive more activity on-chain, propping up prices.

On the other hand, Solana bulls are upbeat. Since September 2023, SOL has been on a sharp uptrend. At spot rates, the coin roared to register fresh 2024 highs. 

Solana price trending upward on the daily chart | Source: SOLUSDT on Binance, TradingView

With this performance, Solana outperforms Bitcoin and other altcoins, including ETH. CoinMarketCap data shows that SOL has risen by 15% in the past week, closely trailing BNB, the native currency of the BNB Chain ecosystem.

Analysts are looking at the upcoming Firedancer upgrade to fortify Solana’s infrastructure further and increase reliability. Meanwhile, regulatory developments in the United States are evolving positively, propping up altcoins, mainly BNB. 

Overall, the crypto uptrend remains even with prices cooling off. More importantly, even with falling prices, sentiment remains bullish. In the past week, CoinMarketCap data shows that the Crypto Fear and Greed Index is at “extreme greed” territory.

Solana Chasing BNB Chain, Race To 5% Market Dominance Heats Up

The dominance war is on. CoinMarketCap data shows that Solana and BNB Chain, two popular smart contracts platforms after Ethereum, are emerging as strong contenders.

In a post on X, one crypto analyst notes that SOL and BNB, the native currencies of Solana and BNB Chain, respectively, have been growing, subsequently expanding the market caps of their respective platforms. However, even with this price uptick, it has yet to attain the 5% level, a target for proponents of the two platforms. 

Solana versus BNB Chain dominance | Source: Analyst on X

Will Solana Flip BNB To Fourth?

When the analyst shared the screenshot on March 14, BNB Chain, powered by Binance Coin (BNB), held a slight lead with a 3.34% dominance, while Solana trailed behind at 2.72%. 

However, Solana has been on a tear. Not only is the coin outperforming Bitcoin and Ethereum, but it has been expanding rapidly, faster than BNB in the past few trading weeks. When writing, CoinMarketCap data shows that SOL is trading above $170, a multi-month high.

Moreover, it is up 11% on the last trading day and 20% in the previous trading week. At this valuation, SOL’s market cap is up 12% to over $75 billion, cementing its position at fifth, trailing BNB.

Solana price trending upward versus BNB | Source: SOLBNB on Binance via TradingView

On the other hand, BNB remains at fourth, behind USDT–the most liquid stablecoin whose market cap stands at over $103 billion. BNB is up 2% the previous day but double digits in the past week of trading. Overall, the lack of inactivity, especially on the last trading day, means its total market cap, at over $90 billion, is stable, only adding 2% on the last day.

When comparing the performances of Solana and BNB, the former has the upper hand. For example, from September 2023, SOL gained over 200% versus BNB. BNB pared losses from January, but the revival in Solana, considering the success of meme coins, means SOL might extend gains in the future. 

Solana Rally On FTX’s Bankruptcy Case Proceedings, BNB Shakes Off Regulatory Woes

As the competition intensifies, the future remains uncertain. It’s unclear whether SOL will overtake BNB to claim the second most dominant smart contract spot after Ethereum.

However, at the time of writing, what’s certain is that the spike in on-chain activity on Solana and the unfolding events around the FTX bankruptcy case could bolster SOL prices. Therefore, it’s highly probable that Solana’s dominance might catch up with BNB as the race to the 5% level intensifies. 

In November 2023, Binance settled with United States regulators, including the Securities and Exchange Commission (SEC), agreeing to pay a $4.3 billion fine. As part of the deal, their co-founder, Changpeng Zhao, also had to resign as CEO. While BNB prices initially plunged, the token recovered steadily from the $300 level. 

BNB Price Breaks $600, Why Bulls Could Now Aim New ATH

BNB price is gaining bullish momentum above the $550 resistance. The price is showing positive signs and might extend its rally above $650.

  • BNB price is up over 15% and it broke the $600 resistance zone.
  • The price is now trading above $580 and the 100 simple moving average (4 hours).
  • There is a key bullish trend line forming with support at $598 on the 4-hour chart of the BNB/USD pair (data source from Binance).
  • The pair could continue to rise toward the $650 resistance zone or even $700.

BNB Price Extends Rally

In the last BNB price prediction, we discussed the chances of more gains above the $500 resistance zone. The price continued to rise and broke many hurdles near the $550 level.

BNB is now outperforming Bitcoin and Ethereum with a move above the $580 resistance. It is up over 10% today and trading above $600. A high was formed near $633 and the price is now consolidating gains. It is trading above the 23.6% Fib retracement level of the upward move from the $364 swing low to the $633 high.

The price is now trading above $600 and the 100 simple moving average (4 hours). Immediate resistance is near the $625 level. The next resistance sits near the $635 level. A clear move above the $635 zone could send the price further higher.

BNB Price

Source: BNBUSD on TradingView.com

In the stated case, BNB price could test $650. A close above the $650 resistance might set the pace for a larger increase toward the $700 resistance. Any more gains might call for a test of the $780 level in the coming days.

Dips Limited?

If BNB fails to clear the $635 resistance, it could start a downside correction. Initial support on the downside is near the $600 level and the trend line.

The next major support is near the $570 level. The main support sits at $500 or the 50% Fib retracement level of the upward move from the $364 swing low to the $633 high. If there is a downside break below the $500 support, the price could drop toward the $450 support. Any more losses could initiate a larger decline toward the $420 level.

Technical Indicators

4-Hours MACD – The MACD for BNB/USD is gaining pace in the bullish zone.

4-Hours RSI (Relative Strength Index) – The RSI for BNB/USD is currently above the 50 level.

Major Support Levels – $600, $570, and $500.

Major Resistance Levels – $635, $650, and $700.

BNB Price Soars As Binance Smart Chain Implements “BEP 336” Upgrade, Inspired By Ethereum’s Dencun

Binance Smart Chain (BSC), commonly known as BNB Chain, has announced the “BEP 336 upgrade”, inspired by Ethereum’s Dencun upgrade (EIP 4844), which aims to optimize data storage and processing on the blockchain.

The upgrade is expected to significantly reduce transaction costs, improve network performance, and drive the price of Binance Coin (BNB) towards its previous all-time high (ATH) of $686, reached in May 2021.

BNB Smart Chain Cost-Effective Data Solution

According to the protocol’s announcement, BEP 336 introduces an innovative concept called “Blob-Carrying Transactions” (BlobTx) that will change how large data blocks are handled. 

These temporary and cost-effective memory segments, known as blobs, can capture data blocks as large as 128 KB. By streamlining the transaction verification process, the network only needs to verify that the attached blob contains the correct data rather than verifying each transaction within a block.

The introduction of blob transactions within the BSC, which is particularly beneficial for opBNB – the layer 2 network of the BNB ecosystem – offers several advantages. Blobs reduce network space consumption, resulting in lower storage costs and more affordable gas fees for users, similar to Etherem’s Dencun upgrade. This storage strategy allows for efficient data handling while managing blockchain bloat, ensuring data integrity and availability throughout its lifetime on the chain.

BEP 336 also includes two additional components. The Blob Market establishes a fee market for blobs, ensuring regulated storage and transmission costs based on network demand. The Precompile Contract adds a layer of security by verifying that the data in a blob matches the reference in the blob-bearing transaction.

While BEP 336 draws inspiration from Ethereum’s EIP 4844, it is tailored to meet BSC’s unique requirements. Notably, BSC’s design mandates that blobs be managed exclusively by the BSC client, distinguishing it from Ethereum’s approach. Moreover, BSC implements a dynamic gas pricing mechanism for blobs, ensuring reasonable transaction costs with minimum and maximum thresholds.

BEP 336 Integration With Phased Roadmap

BSC has outlined a phased roadmap for the integration of BEP 336. Beginning with the Testnet launch in April, developers can test and interact with the upgrade in a “controlled environment” to address potential issues. 

The subsequent Magnet phase in May will focus on further testing and optimization to ensure the “robustness” and “scalability” of BEP 336. Finally, in June, the mainnet hard fork will mark the official deployment of BEP 336 on the BSC mainnet, ushering in a new era of efficiency and cost-effectiveness for the network.

According to the announcement, the benefits of BEP 336 are expected to impact developers and users within the BSC ecosystem significantly. Gas fees will be reduced considerably as certain data types no longer require permanent storage, making transactions more affordable. 

The temporary storage mechanism will keep the blockchain lean and bloat-free, enhancing overall network performance. With lower costs and improved efficiency, BEP 336 aims to make the BSC ecosystem more accessible to a wider audience, including developers and newcomers to blockchain technology.

BNB

The announcement has boosted Binance Coin’s (BNB) price by over 8%, resulting in a current trading price of $588, just 15% below its all-time high of $686. 

In case of further price gains, the next resistance walls for the BNB price are placed at the $600 level and the $608 mark, which could prevent the token from further price appreciation in its mission to reach its current ATH. 

Featured image from Shutterstock, chart from TradingView.com

BNB On The Rise: Analysts Predict Easy Path To New ATH As It Nears $600

Binance Coin (BNB) has been on a bullish run despite the regulatory scrutiny that Binance has faced over the last several months. The token registered an impressive 13.7% price surge after almost reaching $600, and analysts predict that a new all-time high (ATH) might be coming in the next couple of months.

Is The Cost Clear For A New ATH?

As the crypto market rallies, Bitcoin continues to hit ATH after ATH, and altcoins’ prices keep regaining the levels of the previous bullish run. BNB has not been the exception; it surged over 13.7% in the last 24 hours and is near a crucial support level that could propel the token even higher during this cycle.

The price increase could be attributed to market dynamics and BTC’s performance. However, the recent announcement of ether.fi (ETHFI)’s introduction to the Binance Launchpool also seems to fuel the price since it will allow users to farm ETHFI by staking their BNB.

Crypto analyst Altcoin Sherpa shared his forecast for the token as the price was nearing $600. The analyst considers that, given the current BNB’s performances, the path to the previous ATH level is clear: “This one goes to ATH easily, and this was kind of obvious IMO.”

In the post, the analyst shared a chart that displays BNB’s performance since its ATH of $686.3, which is currently only 13.51% away. The token has registered mostly green candles every week since 2024 and only weekly green candles since February.

In the past month, BNB’s price went from oscillating between the $300-$320 price range to hovering between $520-$590, representing an increase of over 80%.

Despite the sunny forecast, Altcoin Sherpa doesn’t rule out cloudy days. The analyst expects pullbacks along the way but foresees BNB breaking the ATH “soundly” in the next couple of months.

Similarly, pseudonym crypto trader and analyst Captain Faibik highlighted that the token has gained over 120% since his ATH timeline prediction at the end of 2023. In late December, the trader forecasted that BNB would reach a new ATH in the first half of 2024, and the current performance seemingly reaffirms this stance.

BNB Price Performance

Despite the recent legal scrutiny faced by Binance, BNB has been able to sustain its recovery path. According to the crypto hedge fund Split Capital, the token has added more than $50 billion in market capitalization since the exchange settled with the Department of Justice (DOJ) for $4 billion in November.

BNB’s market cap of $91.22 billion represents a 10% increase in the last 24 hours. By this metric, the token is the fourth largest cryptocurrency in the market. Similarly, its trading volume significantly increased by 50% on the last day.

Earlier today, the price reached $599.8, just cents away from hitting the $600 price range, according to CoinMarketCap data. At the time of writing, BNB has been trading at $595.6, a price surge of 38.6% in the last seven days.

BNB, BNBUSDT; Binance, Bitcoin

Analyst Predicts Bitcoin Super Cycle, Sets Price Target At $80,000

Bitcoin, the world’s largest cryptocurrency asset, has finally entered a new price threshold, surpassing its previous all-time high (ATH) of $69,000, accomplished nearly three ago.

Following the latest milestone, crypto enthusiasts and experts are very bullish on the digital asset, predicting further upward movement to unprecedented heights in the upcoming months.

Bitcoin Super Cycle Area Set At $80,0000

Cryptocurrency analyst Doctor Profit has shared a positive forecast for BTC with the crypto community on the social media platform X. His analysis, tagged “Big Sunday Report,” delves into the next step that BTC is expected to take amid the general market optimism.

Doctor Profit’s projection is based on Technical Analysis (TA), Life-Cycle-Assessment (LCA), and Psychological analysis. Drawing attention to a previous forecast, Doctor Profit stated that a breakout above $48,500 would send the price “all the way to the old ATH very quickly.”

Interestingly, this took place in a matter of weeks, at a swift pace. He highlighted that the breakout, which sent Bitcoin to exactly $60,000 as predicted weeks earlier, signaled the start of the “Golden bull phase.”

Bitcoin

According to the analyst, any movement in the range of “$48,500 to $70,000” right now is considered to be in the golden bull market. Meanwhile, “anything above $72,000” marks the beginning of the “Super Cycle Phase,” indicated by “significant green candle returns and surges.”

The expert is confident that before the asset goes higher, it will maintain a “movement inside the golden bull and super cycle.” Specifically, these sideways movements will go on for a while, primarily between “$60,000 (Golden Bull area) and $80,000 (Super Cycle area).”

Doctor Profit noted that the movement is not because Bitcoin seems weak or needs to be corrected. Instead, its rally was very swift making it difficult for big market cap altcoins to keep up with the crypto asset.

Despite Bitcoin reaching a new peak, major altcoins like ETH, BNB, or SOL still have not been able to record significant inflows, suggesting a pending activation of a robust altcoin market.

BTC To Move In Four Phase In This Bull Cycle

So far, Doctor Profit expects Bitcoin to move in four distinct phases in this upcoming bull run. The experts underlined the first aspect, “signifying the conclusion of the bear market,” was between $16,000 and $25,000.

He explains that the next phase, the “pre-bull market,” comprises two aspects. According to the analyst, the initial pre-bull step opened up “between $25,000 and $38,500,” while the second stretched between “$38,000 to $48,000.”

Meanwhile, from “$48,000 to $70,000 is when the golden bull phase began.” This, he expects, to lead to the Super Cycle area that will “last from $72,500 to unprecedented levels.”

Currently, the price of Bitcoin has increased by over 3% in the last 24 hours, trading at $72,139. Its trading volume and market cap are also showing strength, rising by 78% and 3% respectively.

Bitcoin

BNB Price Zooms 10%, Here Are Next Possible Barriers For Bulls

BNB price is gaining bullish momentum above the $450 resistance. The price is signaling a strong uptrend and might soon surpass the $500 resistance.

  • BNB price is showing bullish signs above the $450 resistance level.
  • The price is now trading above $465 and the 100 simple moving average (4 hours).
  • There was a break above a connecting trend line with resistance at $430 on the 4-hour chart of the BNB/USD pair (data source from Binance).
  • The pair could continue to rise toward the $500 resistance zone or even $520.

BNB Price Extends Rally

In the last BNB price prediction, we discussed the chances of more gains above the $400 resistance zone. The bulls did remain active and were able to push the price above the $400 level.

BNB is now outperforming Bitcoin and Ethereum with a move above the $450 resistance. There was a break above a connecting trend line with resistance at $430 on the 4-hour chart of the BNB/USD pair. It is up over 10% today and trading above $470.

A high was formed near $478 and the price is now consolidating gains. It is trading above the 23.6% Fib retracement level of the upward move from the $364 swing low to the $478 high.

The price is now trading above $465 and the 100 simple moving average (4 hours). Immediate resistance is near the $475 level. The next resistance sits near the $488 level. A clear move above the $488 zone could send the price further higher.

BNB Price

Source: BNBUSD on TradingView.com

In the stated case, BNB price could test $500. A close above the $500 resistance might set the pace for a larger increase toward the $520 resistance. Any more gains might call for a test of the $542 level in the coming days.

Dips Supported?

If BNB fails to clear the $475 resistance, it could start a downside correction. Initial support on the downside is near the $4620 level.

The next major support is near the $450 level. The main support sits at $420 or the 50% Fib retracement level of the upward move from the $364 swing low to the $478 high. If there is a downside break below the $420 support, the price could drop toward the $400 support. Any more losses could initiate a larger decline toward the $380 level.

Technical Indicators

4-Hours MACD – The MACD for BNB/USD is gaining pace in the bullish zone.

4-Hours RSI (Relative Strength Index) – The RSI for BNB/USD is currently above the 50 level.

Major Support Levels – $460, $450, and $420.

Major Resistance Levels – $475, $500, and $520.

BNB Barrels Past $400, As Binance TVL Nears $5 Billion – Details

Recently, the Binance Smart Chain emerged as the top Layer 1 platform with the biggest number of BNB users. There has also been a noticeable increase in its volume.

The optimistic outlook for the cryptocurrency market as a whole has also contributed to BNB’s success. With a market capitalization of around $2.30 trillion, Bitcoin’s latest ascent beyond $63,000 suggests that investor confidence has increased.

BNB Approaches $5 Billion TVL

Total Value Locked (TVL) for BNB Chain increased steadily this year and is currently close to $5 billion. It’s crucial to remember that the current upward trend in BNB is what’s responsible for the TVL spike.

According to data from DefiLlama, this represents a notable rise over the $3.50 billion reported at the beginning of the year and illustrates the growing presence of decentralized finance (DeFi) protocols on the chain.

With 425 million unique users, BNB chain held the top spot at the time of publication, according to Crypto Rank data, which displayed the total number of unique users across the top 15 networks.

On-chain volume on BNB Chain saw a notable spike this week, peaking at about $1.4 billion. According to DefiLlama, this is the greatest volume seen in 2024 and the second-highest day volume on the chain in more than a year. An increase in activity suggests that users are more engaged and that the ecosystem has room to develop.

BNB Breaches $400 Level

The price of BNB has recently increased to levels not seen in months, which is quite notable. The coin has moved into previously unobserved price ranges as of April 2022.

The 24-hour period chart analysis showed that BNB ended trading on a high note. Though there has been a slight decline of less than 1% as of this writing, BNB is still trading at $405.

The excitement around the web3 game project Portal’s airdrop farming campaign is partly responsible for the recent increase in BNB’s price. Users were able to take part in Portal’s PORTAL token airdrop thanks to Binance’s Launchpool integration, which increased interest and engagement in the BNB Chain ecosystem.

Meanwhile, bulls will retake control and be ready to challenge the market’s upper resistance level of $420 this week if the price moves over the resistance level of $401. If the price stays there, the BNB coin will be ready to try testing its upper limit of $435 in the following weeks.

The notable variation in pricing is observed despite Binance being subjected to one of the most serious criminal penalties in the history of the United States. Following the consent of a judge, the exchange reached a plea agreement amounting to $4.3 billion, which pertained to allegations associated with violations of anti-money laundering regulations and penalties.

Featured image from Pexels, chart from TradingView

Justin Sun Moves $100M To Binance, Stacking Ethereum?

Justin Sun, the co-founder of Tron–a smart contracting platform for deploying decentralized applications (dapps), is once again moving and shuffling millions of dollars. According to Lookonchain data on February 29, Sun reportedly transferred 100 million USDT to Binance, days after moving huge sums earlier this week.

Justin Sun moves $100 million USDT to Binance | Source: Lookonchain via X

Justin Sun Holds Millions Of ETH: Will The Co-founder Buy More?

From February 12 to 24, a wallet associated with Sun acquired 168,369 ETH for an average price of $2,894. This purchase, valued at roughly $580.5 million, currently holds an unrealized profit of around $95 million. Profitability could increase considering the sharp demand for crypto, especially top coins like Bitcoin and Ethereum, in recent days.

Ethereum price trending upward on February 29 | Source: ETHUSDT on Binance, TradingView

The Ethereum price chart shows that ETH has been on a clear uptrend, rising from around $2,200 in early February to over $3,450 when writing. At this pace, and considering the institutional interest in potent crypto assets, including ETH, the odds of the second most valuable coin stretching gains will be highly likely.

As Bitcoin inches closer to $70,000, the probability of Ethereum also tracking higher toward its all-time high of around $5,000 will be elevated.

Since ETH already owns a big stash of coins, there is speculation that the co-founder will double down, buying even more coins. The crypto community will continue watching the address until this happens and there is solid on-chain data to support the purchase.

Spot Ethereum ETFs And The Dencun Upgrade Are Key Updates

So far, optimism is high, especially among the broader altcoin community. As Bitcoin races to register new all-time highs pumped by institutional billions, eyes will be on the United States Securities and Exchange Commission (SEC). There are multiple applications for a spot Ethereum exchange-traded fund (ETF). 

The agency has not provided a definitive timeline for approving or rejecting the derivative product. There is regulatory uncertainty around the status of ETH, a significant headwind that might delay or even prevent the timely authorization of this product.

Still, the community is looking forward to the next communication in May. If the spot Ethereum ETF is a go, the coin will likely rally to new all-time highs, following Bitcoin.

However, before then, eyes are on the expected implementation of Dencun. The upgrade addresses challenges facing Ethereum, including scalability. Through Dencun, Ethereum developers hope to lay the base for further throughput enhancements in the coming years.

With higher throughput, transaction fees drop, overly improving user experience. This upgrade might go a long way in cementing Ethereum’s role in crypto, wading off stiff competition from Solana and others, including the BNB Chain.

BNB Price Starts Its Journey Toward $500, Why Dips Turned Attractive

BNB price is gaining bullish momentum above the $350 resistance. The price looks set for more gains above the $400 resistance in the near term.

  • BNB price is showing bullish signs above the $365 resistance level.
  • The price is now trading above $375 and the 100 simple moving average (4 hours).
  • There is a key bullish trend line forming with support at $380 on the 4-hour chart of the BNB/USD pair (data source from Binance).
  • The pair could continue to rise toward the $400 resistance zone or even $422.

BNB Price Extends Increase

In the last BNB price prediction, we discussed the chances of more gains above the $365 resistance zone. The bulls did remain active and were able to push the price above the $375 level.

BNB outperformed Bitcoin and Ethereum with a move above the $380 resistance. A high was formed near $390 and the price is now consolidating gains. It is trading above the 23.6% Fib retracement level of the upward move from the $345 swing low to the $390 high.

The price is now trading above $375 and the 100 simple moving average (4 hours). There is also a key bullish trend line forming with support at $380 on the 4-hour chart of the BNB/USD pair.

BNB Price

Source: BNBUSD on TradingView.com

Immediate resistance is near the $390 level. The next resistance sits near the $392 level. A clear move above the $392 zone could send the price further higher. In the stated case, BNB price could test $400. A close above the $400 resistance might set the pace for a larger increase toward the $422 resistance. Any more gains might call for a test of the $500 level in the coming weeks.

Dips Supported?

If BNB fails to clear the $390 resistance, it could start a downside correction. Initial support on the downside is near the $380 level and the trend line.

The next major support is near the $362 level or the 61.8% Fib retracement level of the upward move from the $345 swing low to the $390 high. The main support sits at $350. If there is a downside break below the $350 support, the price could drop toward the $335 support. Any more losses could initiate a larger decline toward the $315 level.

Technical Indicators

4-Hours MACD – The MACD for BNB/USD is gaining pace in the bullish zone.

4-Hours RSI (Relative Strength Index) – The RSI for BNB/USD is currently above the 50 level.

Major Support Levels – $380, $362, and $350.

Major Resistance Levels – $390, $400, and $422.

Aave Joins Binance’s BNB Chain Ecosystem – Here’s How Users Benefit

In a significant development for the Binance Smart Chain (BSC) ecosystem, Aave (AAVE), one of the largest decentralized finance (DeFi) market protocols, has announced its integration with BNB Smart Chain. Aave joins prominent projects such as Uniswap, Ambit Finance, PancakeSwap, and Lista DAO.

BNB Chain Welcomes Aave

According to the announcement, this latest development opens up new opportunities for BNB Chain users, giving them access to what the protocol calls “top-tier lending platforms” and enhanced liquidity.

With the launch of First Digital USD (FDUSD), users can now leverage “robust” liquidity, allowing them to explore different applications and opportunities in the Binance ecosystem.

BNB

On the other hand, Aave users can now benefit from BNB Chain’s fees and the ability to integrate with one of the largest DeFi ecosystems, fostering increased collaboration between the two communities. The announcement also noted the following about the Aave integration:

This not only complements but strategically aligns with BNB Chain’s 2024 outlook. Focused on mass adoption, high-frequency DeFi applications, and network efficiency improvements, the ecosystem is set for an exciting evolution.

2024 Goals

Looking ahead, BNB Chain has set numerous goals for 2024. The introduction of opBNB – the Layer 2 (L2) scaling solution for the BNB Smart Chain – aims to achieve a transaction processing capacity of 10,000 transactions per second (TPS) by doubling the gas limit to 200 M/s.

Enhanced security measures accompany this increase in capacity through multi-proof mechanisms. In addition, implementing Ethereum’s EIP4844 and Greenfield’s data availability upgrades will reduce gas fees by 5-10 times, providing users with a more cost-effective experience.

In a move called “BNB Chain Fusion,” the BNB Beacon Chain will be merged with the BSC, further enhancing the efficiency and security of the network. The expansion of the number of validators, which will increase from 40 to 100 by 2024, is also expected to contribute to the stability of the network.

Market Cap And Token Holders On The Rise

According to Token Terminal data, the BNB chain has experienced significant growth, evidenced by several key metrics.

One notable metric is the fully diluted market cap, which stands at $75.71 billion, representing a significant increase of 23.9% over the past 30 days, highlighting the confidence in the protocol. 

The circulating market cap, another crucial indicator, currently sits at $54.73 billion, showing a solid 11.6% growth over the same 30-day period. 

BNB

On the other hand, the number of BNB token holders has shown a positive trend, reaching 113.51 million, with a significant increase of 3.5% in the last 30 days, demonstrating interest in the ecosystem.

Featured image from Shutterstock, chart from TradingView.com