Trading Guru John Bollinger Forecasts Bitcoin Breakout, $50,000 On The Horizon?

John Bollinger, a legendary Bitcoin (BTC) trader known for creating the Bollinger Bands strategy, has recently shared an optimistic view on Bitcoin’s future.

Bitcoin Poised For Further Surge?

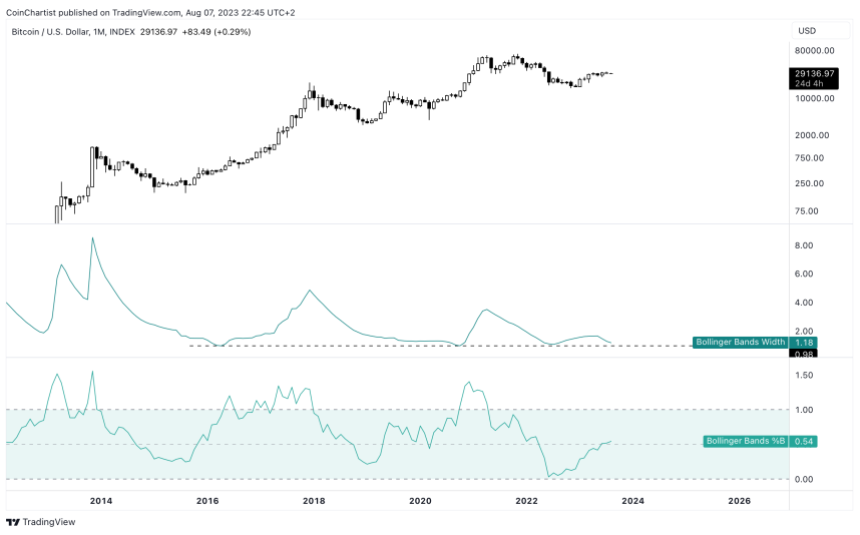
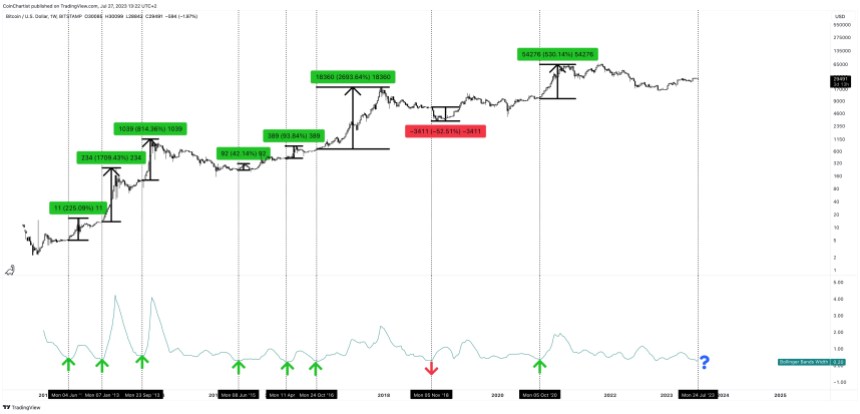
In a post on X, John suggest that Bitcoin’s price is likely to “break higher” from its current levels. This prediction is based on his analysis using the Bollinger Bands chart, a popular technical analysis tool he developed. For context, Bollinger Bands are a type of statistical chart characterizing the prices and volatility of an asset over time.

They consist of a set of three lines: the middle line typically represents the simple moving average of the asset’s price, and the other two lines are plotted at a standard deviation above and below the average. This tool helps traders to assess market conditions and potential price movements.

Bollinger’s prediction using this methodology indicates a positive outlook for Bitcoin, especially significant in light of the recent market turbulence.

Bitcoin (BTC) price chart on TradingView

Bitcoin’s Recovery And $50,000 Price Target

So far, Bitcoin’s journey in the crypto market has been marked by resilience, as evidenced by its recovery from a notably down turn in the market that resulted in the asset to trade in the $40,000 region.

Currently trading above the $43,000 mark, Bitcoin has shown a 3% growth in the past 7 days. This rebound is particularly noteworthy following a bearish report from Matrixport concerning a rejection of spot Bitcoin exchange traded funds (ETFs) by the US Securities and Exchange Commission (SEC).

Joining Bollinger in bullish predictions is Dan Gambardello, another well-respected analyst in the crypto space. Gambardello has projected an upward breakout for Bitcoin, potentially leading the digital currency to reach the $50,000 mark in the short-term and $60,000 in the long term.

This projection is tied to the anticipation of a spot Bitcoin ETF approval, which could serve as a significant catalyst for Bitcoin’s price movement. Gambardello explains that this upward trend would represent a historical breakthrough for Bitcoin, especially in terms of breaking through the lower highs of its Fibonacci level.

Notably, it is evident that the predictions from both Bollinger and Gambardello hinge significantly on the US SEC decision regarding the approval of a spot Bitcoin ETF. While optimism prevails, Gambardello has also cautioned that a rejection could lead to a decline in Bitcoin’s price, potentially dropping below $40,000 to find support around $37,000.

Featured image from Unsplash, Chart from TradingView

Bitcoin’s Bullish Leap: Trading Guru John Bollinger Weighs In On BTC Ongoing Rally

John Bollinger, known for his expertise in market analysis, has recently shared his insights on Bitcoin’s current market trajectory, noting that the premier cryptocurrency is exhibiting “signs of strength.” This observation comes when Bitcoin consistently sets new highs amid the ongoing bull run.

The asset has experienced a surge, climbing above $44,000, representing a 4.5% increase over the past 24 hours. It now appears to be aiming for the next resistance level.

Bitcoin Shows Signs Of Strength

John Bollinger, the creator of the renowned Bollinger Bands, a popular technical analysis tool, has applied his methodology to gauge Bitcoin’s market movement. Bollinger Bands are typically used to measure the volatility of a financial instrument.

They consist of a middle band, a simple moving average flanked by two standard deviation lines. These bands adjust with market conditions, widening during volatile periods and contracting during calmer times.

Bollinger’s recent analysis highlights that Bitcoin trades outside its daily and weekly Bollinger Bands. This is particularly noteworthy as it suggests a strong continuation of the current bullish trend without any signs of divergence.

On November 21, a two-bar reversal pattern was noted at the middle Bollinger Band, further reinforcing the strength in Bitcoin’s price action.

Bitcoin’s Price Action: Interpreting The Signs

Bitcoin’s bullish momentum continues unabated, with a near 5% surge in the past 24 hours, pushing past the $44,000 threshold. Interestingly, the cryptocurrency shows no signs of deceleration or immediate pullback.

However, technical analysis on a larger scale suggests that Bitcoin might be approaching a significant retracement zone. On the one-week timeframe, an order block is present between the $48,000 and $50,000 regions.

Bitcoin (BTC) price chart on TradingView

An order block is essentially a zone where significant buying or selling occurred in the past, leading to a substantial price movement. When the price revisits these blocks, they often act as key levels for potential reversals or trend continuation.

Should Bitcoin climb to this region, a retracement might be on the cards. However, invalidating this order block and continuing its rally might set the stage for a reversal, possibly when it reaches the breaker block around the $60,000 region.

Bitcoin (BTC) price chart on TradingView

A breaker block is a specific price zone where the market has previously shown a substantial reversal, breaking through a level of resistance or support. These blocks are often seen as potential areas where the price might experience significant movements or change direction. If Bitcoin taps into this breaker block, it could indicate another pivotal moment in its price trajectory.

Featured image from Unsplash, Chart from TradingView

Trading Guru John Bollinger Warns Of Buying Litecoin, Here’s Why

In his latest analysis, legendary trader John Bollinger has expressed concerns over Litecoin’s performance, particularly in comparison to Bitcoin. Bollinger, known for developing the popular technical analysis tool Bollinger Bands, highlighted a worrying pattern in the Litecoin market.

He remarked, “I was asked for an analysis of LTCBTC. The thing that concerns me the most is its underperformance vs Bitcoin. From a price perspective the controlling LTCUSD feature is the 2 bar reversal at the lower Bollinger Band which is typically considered a bearish signal by traders.”

Litecoin price analysis by John Bollinger

Bollinger’s Bearish Litecoin Prediction Explained

The chart of the LTC/USD pair provided by Bollinger on November 28, 2023, shows Litecoin’s price action in relation to its Bollinger Bands on both a daily and weekly scale. The price is currently hovering around $69.566, which is significantly lower than the upper Bollinger Band, suggesting a lack of bullish momentum.

The Bands form by plotting a range of standard deviations above and below a simple moving average, commonly enveloping the price action. In this chart, the daily vs. weekly candles chart shows that the LTC/USD price is struggling beneath the midpoint of these bands, which is a bearish indication. The price currently near $69.566 is substantially below the upper band level of around $90, which represents a potential resistance level.

The Bollinger Bands (BB) on the chart are set with a 20-period moving average with a 2 standard deviation range. Bollinger’s analysis points to a ‘2 bar reversal’ pattern at the lower band. This pattern emerges when a bar reaches a high above the preceding bar but then closes below the close of that same previous bar, hinting at a possible reversal from the uptrend. Such a pattern took place near the lower band, indicating that any effort to drive the price higher meets with resistance, and the prevailing selling pressure is taking hold.

The Bollinger %B indicator is also crucial here as it compares the price of Litecoin to the range defined by the Bollinger Bands. A %B value below 0.5 indicates that Litecoin’s price sits nearer to the lower band than to the upper band, potentially signaling weakness. The chart shows the indicator failing to cross the 0.5 level after a plunge toward 0, signifying that the price frequently touches or falls below the lower band.

LTC Price Under Pressure

The Bollinger Band Width (BBW) serves as another indicator, measuring volatility by assessing the Bollinger Bands’ width. A narrowing of the Bands, as seen in the latter part of the chart, suggests a decrease in volatility and often precedes a significant price movement. In this context, the BBW’s narrowing on the Litecoin chart might indicate that the market is tensing, possibly gearing up for an impending breakout or breakdown.

When Bollinger mentions Litecoin’s underperformance relative to Bitcoin, it’s important to note that Bitcoin often leads the crypto market trend. If Litecoin is not keeping up with Bitcoin’s movements, it could suggest a lack of confidence or interest from traders in altcoins (as the current rise in Bitcoin dominance shows) and Litecoin specifically.

In summary, Bollinger’s technical analysis indicates that Litecoin is in a precarious position. The price action at the lower Bollinger Band, the bearish ‘2 bar reversal’ pattern, the sub-0.5 Bollinger %B values, and the narrowing BBW all suggest that Litecoin may continue to see downward pressure in the near term.

At press time, Litecoin traded at $70.05. The 1-day chart of LTC/USD shows that the altcoin fell below the key support of the 0.236 Fibonacci retracement level at $69.98 two days ago. A retest is currently taking place, a daily close above this is of utmost importance for the Litecoin price.

Litecoin price

Why Low Volatility Bitcoin Could Last A Lot Longer

Much has been said in recent weeks regarding how uncharacteristically calm Bitcoin has been. On weekly timeframes, volatility measures are at their lowest ever.

Unfortunately, despite the record-setting lull, directionless sideways price action could continue for a lot longer.

Record-Breaking Low Volatility State Could Continue Longer

Bitcoin price is at a standstill compared to its usually explosive self. It’s remained locked in a tight trading range, to the point where even a $300 move to either side might feel like a major breakout.

Few points throughout history on lower timeframes have ever been this quiet. This is according to the weekly Bollinger Bands and Bollinger Band Width readings.

Extreme tightening in the Bollinger Bands suggests what’s a called a Squeeze setup — a situation where following a low volatility phase of narrowing, the bands then expand and release a wave of volatility. It could be a lot longer until that happens, however.

Bitcoin low volatility

Examining Monthly Bollinger Band Width

While the weekly is at record tightness, using the very same tool on the monthly timeframe, shows that that there could be a lot further to go.

The Bollinger Band Width isn’t as low as it has been prior to past bull runs — notably to the lows of early 2016 and late 2020. This could suggest the possibility of months more sideways before a meaningful breakout to new all-time highs or a collapse back to lows.

None of this says much about direction thus far, but %B might hint at a move to the upside. The tool is plotted depending on price’s percentage relation to the upper, middle, and lower Bollinger Bands. As long as %B remains above 0.5 it means price is above the Bollinger Band basis — which is a 20-month simple moving average

Although we don’t know which direction Bitcoin ultimately moves, we do know that one thing is for certain: volatility will return in a major way. It’s just a matter of when, and how long we have to wait.

Bitcoin Bollinger Bands Are The Tightest Ever, What Happens Next?

Last week, the 1W Bollinger Bands in Bitcoin reached its tightest level ever. The volatility measuring tool typically doesn’t give any indication of direction, however.

Using historical data, we’ve taken all previous instances of extreme lows and the resulting direction — up and down — and discovered the success rate of the signal.

Bollinger Band Width Reaches Historical Lows: What Does It Mean?

The Bollinger Bands are a complete trading system, designed by John Bollinger in the 1980s — an avid Bitcoin speculator. The tool uses a 20-period simple moving average (SMA) and two bands set at two standard deviations of the SMA.

As such, the “Bands” expand and contract based on volatility — a measure of how aggressively price moves within a time period. When the Bands tighten to extremes, it indicates a period of low volatility. This setup is called a Squeeze, which ultimately releases pent up energy and results in a large move. When price action picks up, the bands expand to represent the return of volatility.

According to Bollinger Band Width, a related tool designed to tell analysts how tight the bands on an easier to visually compare basis, the Bollinger Bands in BTCUSD are the tightest in the history of crypto. Notably, Ethereum and the TOTAL crypto market cap are also historically tight.

The technical indicator, however, doesn’t say anything about direction, only that something big is on the way. In the past, Bitcoin has broken out in either direction. But how many of these times were up? And how far did it climb?

Bitcoin Bollinger Bands

Bitcoin Breakout Performance Analyzed: Average 669% ROI When Volatility Returns

Past performance is never a guarantee of future results, but from historical price data we can better understand the behavior in BTCUSD after such low volatility phases.

Of the nine total instances the Bitcoin weekly Bollinger Bands got this tight, the top cryptocurrency by market cap rallied upward after upon breakout seven times. The average upward movement across all seven times is 872%. In contrast, the two down moves resulted in an average crash of 40%.<

Bitcoin falling 40% from here would take it back to $17,500 per coin, while a 872% move higher would take BTCUSD to over $280,000 per coin. The average of up and down moves resulted in a grand total of 669%, which would take the number one cryptocurrency to over $220,000. Considering the rule of diminishing returns, such a strong move is unlikely. However, the data speaks to the magnitude of the move that could occur, once volatility returns.

Time To Pay Attention: Bitcoin Reaches “Logical” Level

Bitcoin price is experiencing one of its more significant corrections since the trend began to change directions. 

According to the creator of the Bollinger Bands, it’s once again “time to pay attention” — this time because BTCUSD has pulled back to a “logical” level. 

Bitcoin Begins Pullback To Logical Level

Bitcoin reached almost double from current bear market lows, nearly convincing the crypto community a new bullish trend had begun. With BTCUSD now down more than 10% from local highs, fear is already back on the air in a major way. 

Bulls are now all but silent, after just recently declaring the bull market has returned. Bears are already celebrating the correction as continuation of the bearish trend getting underway.

More tactical technicians, like John Bollinger, simply believe it’s “time to pay attention,” and haven’t yet taken a side. The quote has become a bit of a catchphrase for the creator of the Bollinger Bands. But what exactly is he talking about?

BTCUSD_2023-04-21_15-33-50

All About The Bollinger Bands

The Bollinger Bands are a volatility measuring tool. The tool’s creator recently pointed out an expansion after a lengthy phase or narrowing. This behavior is referred to as a “squeeze” and suggests an uptick in volatility is ahead. Which is precisely what we are witnessing now. 

Volatility is the measure of price dispersion across a timeframe, and after very little movement, BTCUSD is like a rollercoaster once again. Ups and downs are par for the course.

The Bollinger Bands are made up of a 20-period simple moving average (SMA), to where price pulled back to and has now broken below. The upper and lower bands are set at two standard deviations of the SMA.

The next logical level to look for support would be the lower band, located at around $27,000. Once Bitcoin hits the level it could continue downward with strength or snap back to the top of the band. 

One thing is for sure, the tool predicting volatility was accurate. Now it’s time to pay attention.

Worst Quarterly Bitcoin Crash In A Decade Closes Above Key Support

Last week, when the June monthly candle came to a close in Bitcoin, it also signaled the end to the second quarter of the year and its first half. The top cryptocurrency suffered its worst quarterly decline since 2011, but it ultimately held above a key support level.

Here is a closer look at the quarterly support level currently holding in BTCUSD and how it has put in nearly ever major bottom in the past.

Bitcoin Crash Falls To Level Where Bear Markets Bottom

Throughout the 2018 bear market, a primary narrative giving hope to bag holders, was the fact that institutions would eventually get into Bitcoin and it would make all the difference. Institutions did find their way into crypto eventually, leaving many of them at risk of insolvency.

Larger institutions are known to take positions by quarter, and with two abysmal quarters in a row of performance in crypto, institutions could be ready to get back in.

Related Reading | Bitcoin Monthly Tags Lower Bollinger Band, Tool’s Creator Hints At Bottom

The recent selloff took Bitcoin price a lot lower than many would have expected – to the tune of more than 50%, making it the worst quarterly close in a decade. It also landed dead smack on the middle-Bollinger Band.

BTCUSD quarterly closes above the middle-SMA | Source: BTCUSD on TradingView.com
How To Read The Bollinger Bands And What Comes Next

The Bollinger Bands are a volatility measuring tool, designed by John Bollinger in the 1980s. The middle-Bollinger Band is a 20-period moving average, with the upper and lower bands set at 2 standard deviations.

Based on statistics, most price action takes place within the upper and lower bands. Passing above or below the SMA is considered a buy or sell signal.

Each bear market in the past has touched down on this same SMA ahead of the 2016 and 2017 bull run, and then again ahead of the 2020 bull run. Bitcoin price is back at this line again, touching it for the second quarter in a row.

BTCUSD monthly touches down on the lower Bollinger Band | Source: BTCUSD on TradingView.com

Falling through the SMA would be unprecedented in the history of Bitcoin. But Bitcoin has been doing unprecedented things recently. For example, the same tool above shows the first ever touch of the lower Bollinger Band on monthly timeframes.

Related Reading | Bitcoin Weekly RSI Sets Record For Most Oversold In History, What Comes Next?

In theory, price is considered low relative to the history of the asset when prices are at the lower end of the bands, while the opposite is true when an asset is touching the upper bands. By this take, Bitcoin price is potentially at the lowest point ever relative to monthly and quarterly price action.

Could this mean an unprecedented recovery is soon on the way, or could Bitcoin ultimately lose the SMA and a more catastrophic move results?

Follow @TonySpilotroBTC on Twitter or join the TonyTradesBTC Telegram for exclusive daily market insights and technical analysis education. Please note: Content is educational and should not be considered investment advice.

Featured image from iStockPhoto, Charts from TradingView.com

Bitcoin Monthly Tags Lower Bollinger Band, Tool’s Creator Hints At Bottom

Bitcoin price action on monthly timeframes has made a historic move to the touch the lower Bollinger Band – a popular technical indicator and volatility measuring tool.

Although he warns there isn’t yet a sign that a bottom is in, the tool’s creator says where price action tapped is a “logical” level for such a bottom to occur.

Unprecedented Bitcoin Price Action Taps Monthly Bollinger Band For First Time In History

Expectations for Bitcoin price in 2022 were closer to $100,000 per coin and above. Yet the top cryptocurrency today is trading close to its former 2017 all-time high at $20,000.

But unprecedented macro conditions has caused unprecedented price action in Bitcoin and other cryptocurrencies. Never in the past has the top cryptocurrency by market cap retested its former all-time high this way.

Related Reading | Bitcoin Weekly RSI Sets Record For Most Oversold In History, What Comes Next?

And never did Bitcoin price on monthly timeframes ever reach the lower Bollinger Band. But that’s exactly what happened this past month when crypto market contagion spread and brought asset prices down considerably.

BTCUSD monthly touches down on the lower Bollinger Band | Source: BTCUSD on TradingView.com

Touching the lower Bollinger Band, however, could be a logical place for a bottom according to the tool’s creator.

Time To Pay Attention: John Bollinger Points Out Logical Level For Potential Bottom

The Bollinger Bands are a technical analysis tool that can help to measure and predict volatility, or find areas of potential resistance and support. It was created in the 1980s by John Bollinger, who today is a frequent Bitcoin speculator. It relies on a 20-period simple moving average and a dynamic upper and lower band set each at two standard deviations.

Mr. Bollinger pointed out the touch of the lower Bollinger Band in a new tweet, where he suggests the area would be a “logical” level to bottom. Bollinger did warn, however, that there still aren’t signs of such bottoming yet.

In the past, Bollinger was able to call out the April 2021 peak by spotting a “three pushes to a high” bearish reversal pattern with striking accuracy. The analyst says his tools later confirmed what he says was an “M-type” double top.

Picture perfect double (M-type) top in BTCUSD on the monthly chart complete with confirmation by BandWidth and %b leads to a tag of the lower Bollinger Band. No sign of one yet, but this would be a logical place to put in a bottom.https://t.co/KsDyQsCO1F

— John Bollinger (@bbands) June 27, 2022

Bollinger also shared in his chart a look at ancillary indicator, B%, which also has set historical lows. Monthly Bollinger Band Width can be used to measure volatility, and still has room to fall compared to past cycles.

Related Reading | Is Bitcoin Like Buying Google Early? Check Out The Shocking Comparison

Does Bitcoin price have more room to fall also? Or will a bottom form in this “logical” zone as the tool’s creator calls attention to? Either way, it seems to be “time to pay attention.”

Follow @TonySpilotroBTC on Twitter or join the TonyTradesBTC Telegram for exclusive daily market insights and technical analysis education. Please note: Content is educational and should not be considered investment advice.

Featured image from iStockPhoto, Charts from TradingView.com

Blast From The Past Bitcoin Fractal Could Suggest A Record Reversal Is Near

Mark Twain said that history doesn’t repeat, but it often rhymes. Such a scenario could be about to play out in Bitcoin, according to a potential fractal that mimics the setup before a previous record-breaking rally.

While the conditions aren’t quite the same for an exact repeat, there could be enough for the price action now and then to rhyme just enough. Let’s take a closer look.

Record-Breaking Bitcoin Price Fractal Found, But Is It Valid?

Markets are cyclical and patterns repeat in those markets so often, they can be used to predict the future. Most of the statistically proven technical patterns include some type of geometric shape such as triangles and rectangles.

But not all setups are so clear. Repeating patterns called fractals can appear, mimicking the price action of past moments. When fractals appear, they aren’t a perfect repeat of the situation before, but can yield similar results.

Related Reading | Could Kazakhstan Turmoil Cause Another Bitcoin Hash Crash?

The fractal in question is a setup from October 25, 2019 – in the past dubbed the “Xi pump” or “China pump.” Bitcoin price had swept support after more than a month of grinding against it, only to sharply reverse.

Not only did price action reverse, the resulting short squeeze and FOMO led to a record-breaking 44% climb in a matter of 48 to 72 hours. It was the third-largest single-day rise in the cryptocurrency’s history.

Price action mimics a fractal from October 2019 | Source: BTCUSD on TradingView.com
Will The Death Cross Breathe New Life Into Crypto Bulls?

The fractal above is eerily similar to the price action during the October 2019 downtrend. The peaks and troughs match well enough, as pictured above.

What is more potentially telling, is the fact the same setup is brewing when Bollinger Bands are turned on. 12-hour BTCUSD timeframes show a similar pattern, then a very similar close outside of the lower Bollinger Band. After a pause and a pair of doji, Bitcoin price reversed and reversed hard.

The Bollinger Bands could snap BTC back to $60K | Source: BTCUSD on TradingView.com

If the pattern were to repeat or even rhyme, there is potential for a historic, record-breaking reversal. The last time the setup happened in October 2019, there was a 44% climb in the days that followed.

Related Reading | 2022: The Year The Secular Bitcoin Bull Run Could End

Another 44% climb would take Bitcoin back above $61,000 per coin and it could happen in just days. Fractals, however, aren’t valid, statistically proven patterns with any probability behind them. They simply can appear to look like past price action, but completely fail to yield the same results.

Could Bitcoin pump into the death cross again? | Source: BTCUSD on TradingView.com

Finally, there is a looming “death cross” on the daily, which also appeared around the same time as the so-called China pump. A death cross happens when the a short-term moving average – the 50-day MA – crosses below a long-term moving average – the 200-day MA.

Despite all the similarities, the fractal above should be taken with a grain of salt – salt that may end up in the wounds of bears should this pattern play out.

Follow @TonySpilotroBTC on Twitter or join the TonyTradesBTC Telegram for exclusive daily market insights and technical analysis education. Please note: Content is educational and should not be considered investment advice.

Featured image from iStockPhoto, Charts from TradingView.com

Why Bitcoin Could Slingshot Back To Lows Before Gaining Momentum

Bitcoin price is making its best attempt yet to climb back above $40,000 since the big crash in May. Thus far, the phrase “sell in May and go away” has worked like a charm, and it could take longer before buying coins back again is a profitable strategy.

That’s because the top cryptocurrency is struggling to hold above the middle-Bollinger Band, and if it can’t hold, it could result in another retest of the bottom of the band. Another retest could finally push the price per coin below support, making a clean sweep before a reversal.

Deja Vu: Why A Historic Move Could Be On The Horizon

For anyone who was around the crypto market during 2019, it feels like deja vu. At above $10,000, it wasn’t uncommon to see traders claiming the next stop was $100,000 or more. They were wrong, and Bitcoin crashed.

When it did, and sentiment shifted bearish, the cryptocurrency reversed with the third most profitable day on record. Anyone familiar with the October 2019 “China pump” knows that things can turn around fast, even when they seem at their worst.

Related Reading | Time To Pay Attention: Bitcoin Indicator Behavior Mimics Historic Rally

Indicators are primed in the same way and so is sentiment, and the latest rally following a morning star reversal and dragonfly doji serve up plenty of bullish signals.

Why then, are the Bollinger Bands warning of one more potential collapse – matching the China pump a lot more closely than the current price action.

bitcoin bollinger bands

Could Bitcoin sweep lows one more time? | Source: BTCUSD on TradingView.com

Bitcoin Price Could Slingshot Lower Before A Bounce Back To Highs

The Bollinger Bands created by John Bollinger are a versatile technical analysis tool that measures volatility, highlights support and resistance, and much more. When the bands tighten or squeeze, it is a sign a massive move is coming ahead, and so far the tool is signaling something shocking should soon happen. But when?

Related Reading | Bitcoin Daily Dragonfly Doji Gives Bulls Hope Of Sharp Reversal

Not quite yet, if the middle-Bollinger Band – a simple moving average – is lost as support. During the prelude to the historic China pump, the middle-BB was lost not once but twice.

bitcoin repeat wiWw1sIs

Indicators also match the last time Bitcoin got so confusing | Source: BTCUSD on TradingView.com

Bollinger Band Width is at similar lows, but should hang there a while long. BB% could sweep the current low like it did in 2019 before slingshotting back upward.

Finally, the LMACD is also exhibiting a very similar pattern and if another bearish crossover happens, it could be a massive trap like the last time around. But for now, beware of one more sweep of lows before a reversal.

Featured image from Deposit Photos, Charts from TradingView.com

Time To Pay Attention: Bitcoin Indicator Behavior Mimics Historic Rally

Bitcoin price keeps sinking, but has kept mostly sideways leaving bears unable to break support to new lows. With the trading range at a pivotal point, as one trading legend often says it is “time to pay attention.”

The reason for the focus, is because what started as a fractal in price action, is now causing similar behavior in the Bollinger Bands that led to one of the most powerful pumps in Bitcoin history. Is that what’s next with bearish sentiment at such critical heights currently?

Pause In Downtrend Leaves Traders Confused, Market In Fear

Markets are cyclical and oftentimes sentiment lags behind price action. The recent uptrend in cryptocurrencies came to a pause when things were at their best – just as Coinbase Global went public, and prices were at all-time highs.

Related Reading | Market Timing: Why Bitcoin Could Sweep Lows Before A Bounce

It wasn’t until more than 50% from the price per BTC was shed before investors started to become bearish on Bitcoin. Over the last several weeks since the big drop in May, a symmetrical triangle has been forming but it might not play out the way text book technical analysis would suggest.

bollinger bands bitcoin

The Bollinger Bands closely match the "China pump" from 2019 | Source: BTCUSD on TradingView.com

Sentiment is at extreme fear and a technical indicator that can be used to forecasts bounces, the Bollinger Bands, looks a lot like the last time the market reached a pause in a new downtrend like this.

At that time, the creator of the tool, John Bollinger, warned it was now “time to pay attention” as trickery could soon reveal, and reveal it did.

Bitcoin “Squeeze” Could Lead To Epic Pump

With sentiment at the very worst and a sweep of lows now checked off the list, Bitcoin price could pump back higher to either retest or reclaim previous highs.

Price action has repeatedly wicked into the lower Bollinger Band without a big break, suggesting that this latest test of the lower band is a bear trap setup called the “Gimmee Bar” discovered by Joe Ross.

bitcoin bollinger bands gimmee bar

Several wicks into the lower BB suggest a bear trap | Source: BTCUSD on TradingView.com

In 2019, the top cryptocurrency couldn’t recover the lost level, but the bull market is a lot different this time around. Holding the level here would result in the first major bull market correction of the rally continues from here.

Related Reading | Bitcoin Bulls And Bears Alike Beware Of Potential Pump And Dump Fractal

If the level cannot be reclaimed, much like the China pump of late 2019 failed and led to new lows, so too will any unfinished recovery from here. Regardless of what happens, it is worth paying extra close attention the next several days until Bitcoin price choses a new direction.

Featured image from iStockPhoto, Charts from TradingView.com

Five Signs That The Bitcoin Bottom Is In

Bitcoin price was slashed in half during the month of May, leaving today as the last day for bulls to make a stand and undo the worst monthly on record.

Even if the blood stain is left behind on the price chart for good, that doesn’t mean bulls still can’t pull off an upset and push prices higher. Here are five signs that Bitcoin price has bottomed out, or will be soon.

The Signals Showing The Bitcoin Bottom Is Near

Just as extreme bullish sentiment and exuberance around mid-April was the local top of the 2021 rally so far, the current level could also act as the bottom now that sentiment has shift to the polar opposite.

A hidden bull div has formed on daily support | Source: BTCUSD on TradingView.com

Contrarian investors and traders suggest buying the fear or blood in the streets, but that’s still not the reason to think the bottom is in.

Related Reading | Building The Case That The Bitcoin Bottom Is In

Rather, technicals on nearly all timeframes point to a reversal in the making. The first ever cryptocurrency is forming a bullish divergence (above) while at daily support. The bounce happened once the Relative Strength Index hit oversold levels.

The logarithmic MACD shows momentum is turning upward | Source: BTCUSD on TradingView.com

The daily LMACD is also turning upward, showing that bulls are attempting to regain momentum on daily timeframes after a month of mayhem.

Moving up to a higher timeframe, Bitcoin price has also bounced at a rising trendline of RSI support on the three-day chart (below).

Bitcoin bounced off a high timeframe RSI support trend line | Source: BTCUSD on TradingView.com

But Wait, There’s More Reasons To Be Bullish On BTC

If that’s not enough to believe there’s a low-timeframe reversal in the making, on higher timeframes there’s still many more reasons to be bullish.

Related Reading | Don’t Have A Cow: Bart Simpson Is Back In Bitcoin

The rarely-looked-at two-week timeframe shows that Bitcoin fell to the middle-SMA on the Bollinger Bands. During the last bull market, the line was never lost. In fact, touching it resulted in the finally impulse upward.

The two-week middle-BB was retested only once during the last bull run | Source: BTCUSD on TradingView.com

The recent push down also caused Bitcoin’s most profitable buy signal to indicate “capitulation” in BTC miners. Past bull markets saw more than 8,000% and 3,500% after the last buy signal appeared per cycle.

The most profitable buy signal in crypto is about to trigger | Source: BTCUSD on TradingView.com

Nearly every time the signal appears, more upside is on the way. So why would this time be any different?

With so many signals stacking up, chances that the cryptocurrency is near the bottom are becoming more likely. Drawdowns post buy signal are still common, however, the potential reward has historically always outweighed the risk in terms of ROI versus loss.

Featured image from iStockPhoto, Charts from TradingView.com