Why The Crypto Market Tides Are Turning In Favor Of Altcoins

For the last two years in the crypto market, it has paid off to be in Bitcoin versus altcoins. However, a new BTC dominance chart shows why the tides are about to turn in favor of altcoins.

Bitcoin Crypto Market Dominance Remains Above 50%

At this very moment, Bitcoin, the top cryptocurrency by market cap, represents more than 50% of the entire crypto market. On one hand, this makes sense given its regulatory acceptance, first-mover advantage, and significant brand power. On the other hand, there are tens of thousands of altcoins out there and yet BTC is still dominant.

But even Bitcoin dominance goes through cyclical boom and bust phases where it loses its dominance to the rest of the crypto market. This is typically called “altcoin season.” The last one to occur was back in late 2020 into 2021, and it lasted only several months. Before that, the rally that coined the term altcoin season took place all of 2017.

With three to four years in between the 2017 rally, the calendar turning toward 2024 puts us yet another year closer to the next altcoin season. This is evident by price action and technical oscillators following sine waves.

Bitcoin dominance altcoins altcoin season

 Riding The Wave To The Next Altcoin Season

According to Investopedia, a sine wave is an S-shaped geometric waveform that oscillates periodically above and below zero. Sine waves can be used in technical analysis to help identify cyclical patterns in technical indicators and oscillators.

In the chart above, the sine wave suggests that indicators are ready to begin rolling over, with the wave overlaid matching the 1M Stochastic almost perfectly. Aside from some chop, the sine waves have followed the ebb and flow back and forth between Bitcoin and altcoin dominance for going on a decade.

If the tool accurately demonstrates the path ahead for Bitcoin dominance, the next altcoin season could be on the way soon enough. Bitcoin is approaching $40,000 and is becoming increasingly expensive for retail investors, who aren’t even paying attention yet to the crypto market.

When they do realize how expensive Bitcoin is again, right under their noses, retail investors will search for the “next Bitcoin” frantically, sparking the next altcoin season. The last time these phases occurred, Bitcoin was passing $10,000 in 2017, and $20,000 in 2020. Now in 2023, will $40,000 be the trigger for alts to finally outperform?

Altcoin Season In Limbo As Bitcoin Dominance Bounces Off Key Support

Market observers are closely eyeing the tussle between Bitcoin and its altcoin counterparts. Bitcoin’s dominance, a critical indicator of its market influence relative to the entire crypto market, has reached a pivotal crossroads. This juncture holds the potential to determine whether this year’s trend of Bitcoin outperforming altcoins will persist or if the heralded “altcoin season” is on the horizon.

Bitcoin Dominance (BTC.D) stands as a percentage value that calculates Bitcoin’s market capitalization against the entire global crypto market capitalization. This metric has garnered substantial attention due to its role in reflecting shifts in market sentiment.

Since May 2021, Bitcoin dominance has oscillated within a range of 39% to 49%. However, early June this year marked a breakout from this range, with BTC.D briefly surging above 52% before retracing toward the 49% level in recent weeks. A successful retest of this level could trigger new bullish momentum for BTC against altcoins. On the flipside, a drop below this level could trigger a longer-term drop towards 39%, the range-low which would trigger the start of a new altcoin season.

Bitcoin dominance

This Is What Bitcoin And Crypto Experts Predict

Daan de Rover, a prominent Crypto YouTuber, emphasizes the importance of understanding the broader market cycle before predicting an “altcoin season.” He argues that the current phase, being the pre-halving stage of the Bitcoin cycle, might not be the optimal time for altcoin investments.

De Rover highlights that a minor retracement in Bitcoin dominance shouldn’t overshadow the overarching upward trajectory, advising that the right time for significant altcoin investments usually occurs after Bitcoin surpasses its all-time high. “We are currently in the pre-halving stage of the cycle, which is generally not the best time to buy altcoins. Bitcoin dominance might drop by 3%, but this is likely just a minor retracement in a larger upward move.” emphasized the crypto YouTuber.

Benjamin Cowen, the founder of ITC Crypto, sheds light on the shifting sentiment, stating, “In June, many said BTC dominance would never break 49% and that alt season was about to begin. Now those same people are dunking on BTC dominance because it had a pullback to 49%. The altcoin casino will remain open until all the money is gone,” indicating that the altcoin market’s potential is far from exhausted.

Michaël van de Poppe, the CEO and founder of MN Trading, delves into historical patterns to discern the optimal time for investing in altcoins. He suggests that the best opportunity emerges around 8-10 months before a Bitcoin halving, during a period of low market confidence. Van de Poppe indicates that the performance of altcoins often hinges on Bitcoin pairs, asserting that they show interest in the markets and initiate rallies when least anticipated.

Highlighting the cyclical nature of the market, van de Poppe references past instances when altcoin strength followed historical patterns despite market variables. He references examples like Ethereum’s cycle low in September ’19 and October ’15, occurring precisely 252 days before Bitcoin halvings, which heralded altcoin bull runs.

The next two or three weeks will probably decide who is right and whether Bitcoin will continue its dominance or if altcoins will make their move and become the favored asset. Investors should therefore watch BTC.D closely.

Bitcoin Dominance To Regain Control Over Crypto? | BTC.D Analysis October 20, 2022

In this episode of NewsBTC’s daily technical analysis videos, we are analyzing Bitcoin dominance (BTC.D) and how the top cryptocurrency might perform in the near term against altcoins.

Take a look at the video below:

VIDEO: Bitcoin Dominance Versus Altcoins (BTC.D): October 20, 2022

In addition to the video highlights listed below the video, we also analyze BTC.D using the Ichimoku, Average Directional Index, LMACD, and other technical tools.

Bitcoin Outperforms Altcoins During Sideways Phase

On daily timeframes, BTC.D is taking a short pause, but is mostly still bullish according to price action and technical indicators. Dominance is above the Tenkan-sen and Kijun-sen on the Ichimoku, while flipped bullish on the LMACD. The Average Directional Index at the bottom shows that trend strength is weakening on daily timeframes and bulls have the upper hand

Bitcoin is has been outperforming altcoins | Source: ETHUSD on TradingView.com

Related Reading: Bitcoin Price Action Falls Flat | BTCUSD Analysis October 18, 2022

Why Altcoin Season Could Be Over For Some Time

On weekly timeframes using the same tools, we can see that dominance has only just turned bullish against altcoins, and the Average Directional Index is hinting that this trend could soon strengthen. On the Ichimoku, dominance is above the Tenkan-sen, but not the Kijun-sen, making it the next logical target.

Moving to monthly timeframes, Bitcoin dominance is also bullish against alts on the LMACD, and the ADX shows that altcoin season could be cooling off for some time. The Ichimoku isn’t very telling, but much like weekly timeframes, the Kijun-sen above could make for a possible next target.

But the trend could just be beginning | Source: ETHUSD on TradingView.com

Related Reading: A Bullish Week In Bitcoin On The Way? BTCUSD Analysis October 17, 2022

Can Alts Hold Onto 50% Of Crypto Dominance?

Additional trend line TA shows that BTC dominance possibly retested the neckline of a years old inverse head and shoulders pattern, which includes the early 2018 alt season peak that came shortly after Bitcoin topped in December 2017 at $20,000. Shockingly, Bitcoin is trading below that level some five years later.

If Bitcoin dominance does reverse hard against altcoins, the line in the sand to watch for is around 52% dominance. Above there would trigger the first ever monthly buy signal of Bitcoin against altcoins. 

Will BTC recapture 50% of crypto market share? | Source: ETHUSD on TradingView.com

Learn crypto technical analysis yourself with the NewsBTC Trading Course. Click here to access the free educational program.

Follow @TonySpilotroBTC on Twitter or join the TonyTradesBTC Telegram for exclusive daily market insights and technical analysis education. Please note: Content is educational and should not be considered investment advice.

Featured image from iStockPhoto, Charts from TradingView.com

Bitcoin Dominance Rises As Market Turns Red, What Does This Mean For Altcoins?

  • BTC.D rises in price as altcoins suffer a bloody day in crypto. 
  • BTC.D attempts to break out above 8, and 20-day Exponential Moving Averages as altcoins struggle to hold their key support. 
  • The price of BTC.D eyes a rally to 48% as this could mean more pain for altcoins. 

Many altcoins have experienced a relief bounce across the market as Bitcoin Dominance (BTC.D) remains below the 40% marked area allowing altcoins to rally when the market recovers. With Bitcoin Dominance (BTC.D) rising from the ashes, we could see the price of altcoins suffering more pain than expected if the price rallies to 50%.

Bitcoin Dominance is the percentage of total cryptocurrency value that is made up of Bitcoin. Its basic premise is that as BTC’s dominance increases, the value of altcoins decreases.

State Of The Market
State Of The Market | Source: On Coin360.com

After showing relief bounces and the crypto market cap looking ready to rally to a high with the hopes of altcoins joining the party, this was caught short as many altcoins experienced a price decline, with many losing their key support with more change of going lower as the price of BTC.D keeps rising.

Bitcoin Dominance (BTC.D) Price Analysis On The Weekly Chart
Weekly BTC.D Movement | Source: BTC.D On Tradingview.com

Many altcoins have shown so much strength as the rally, with others producing double-digit gains coupled with the fact that BTC.D was down as there is not much Bitcoin effect during price retracement. 

With BTC.D set to break its long downtrend, this could affect the price of altcoins as BTC experiencing a downtrend could affect altcoin performance and the time required for altcoins to bounce from retracement.

BTC.D experienced a rally to a high of 72% as most altcoins were dormant during this period with no real price movement despite BTC experiencing good price movement. BTC.D rising is a disadvantage to most altcoins as this usually affects their movement to the upside and suffer more drops when prices retrace.

Altcoins performance is better when BTC.D value is below the 30% mark area as this helps altcoins to react faster and better to price drop when BTC a price decline. If the price of BTC.D breaks and closes above 41.5%, this could mean altcoins would suffer more pain when BTC retraces in value as the impact on altcoin prices will be more.

Weekly resistance for BTC.D – 41.5%.

Weekly support for BTC.D – 40%.

Price Analysis Of BTC.D On The Daily (1D) Chart

In the daily timeframe, BTC.D faced rejection at the 48% mark as the value declined to 38%, where it formed good support to bounce off that region. The value of BTC.D continued to range in value as it formed an ascending triangle with price breaking out. A break and close above 41.5% would mean altcoins will suffer more price decline when BTC drops in value.

Daily resistance for BTC.D – 43.1%.

Daily support for BTC.D – 38.5%.

Featured Image From zipmex, Charts From Tradingview 

WATCH: Bitcoin Dominance And Altcoin Season 2.0 | BTC.D September 7, 2022

In this episode of NewsBTC’s daily technical analysis videos, we are going to look at Bitcoin dominance and the possible signs of a surprise altcoin season developing during the bearish macro backdrop.

Take a look at the video below:

VIDEO: Bitcoin Dominance Analysis (BTC.D): September 7, 2022

For today’s video, we are going to look at Bitcoin dominance on monthly and weekly timeframes. There is potentially a notable breakdown in progress that – based on its significance – could be telling of something bigger: a possible altcoin season that no one is expecting.

Bitcoin Dominance To Submit To Altcoins

Typically, altcoins only perform well during a bull market. So for BTC.D to be breaking down is very unusual considering the current macro backdrop.

Still, BTC dominance is breaking down from a diagonal trend line on price and the Relative Strength Index. The LMACD is also clearly displaying a struggle between bulls and bears. Or more accurately put, Bitcoin versus altcoins, with altcoins currently taking the lead.

Is an altcoin season about to appear? | Source: CRYPTOCAP-BTC.D on TradingView.com
The Signal From The Last Alt Season Is Back

Moving to weekly timeframes on Bitcoin dominance, trend lines become a little more clear. Price is breaking down from both diagonal and horizontal support of great importance. Comparing the past cycle, we can see a similar setup where dominance could make a lower low, while the RSI forms a higher low and bullish divergence.

On the weekly Ichimoku, Bitcoin dominance has been rejected by the cloud. The previous time price dropped from the cloud, it took BTC dominance from 70% to where we are currently at around 39% market share. 

Will we get a repeat of the last altcoin season? | Source: CRYPTOCAP-BTC.D on TradingView.com

Related Reading: WATCH: Weekend At Bitcoin’s: Will The Dead Crypto Make A Comeback? BTCUSD September 2, 2022

Could This Be A Possible Target For Crypto Market Share?

So, where then could our target possibly be in terms of new lows set in Bitcoin dominance? One potential area, is yet another retest of neckline resistance turned support from the last bottom formation – an inverse head and shoulders. The target would take BTC.D to around 32% dominance.

Could 32% dominance be the potential target? | Source: CRYPTOCAP-BTC.D on TradingView.com
How Ethereum And The Merge Might Influence BTC.D

To further illustrate why this setup could come to fruition, we have flipped BTC.D upside down and compared it with ETHBTC. The primary factor driving a historical altcoin season is the Ethereum Merge.

In the chart below, we can see that Ethereum is very much responsible for much of the current Bitcoin dominance chart formation. This makes sense considering Ethereum is the second largest cryptocurrency by market cap and has the largest impact on this metric outside of Bitcoin itself.

Bitcoin dominance is driven heavily by the ETHBTC pair | Source: CRYPTOCAP-BTC.D on TradingView.com

Learn crypto technical analysis yourself with the NewsBTC Trading Course. Click here to access the free educational program.

Follow @TonySpilotroBTC on Twitter or join the TonyTradesBTC Telegram for exclusive daily market insights and technical analysis education. Please note: Content is educational and should not be considered investment advice.

Featured image from iStockPhoto, Charts from TradingView.com

Bitcoin Dominance Aims At Historic Lows, Unprecedented Altcoin Season Potentially Ahead

While Bitcoin continues to take a beating in terms of dollars, the top cryptocurrency also continues to lose its share over the market cap. In fact, with the most recent support level breached, BTC dominance could be targeting historic lows.

Historic lows in BTC dominance could mean that an altcoin season unlike ever before is potentially ahead. Here’s a closer look at the metric that weighs Bitcoin against the rest of the crypto space and how it could impact altcoin performance.

Bitcoin Continues To Lose Cryptocurrency Market Dominance

At one point, there was only Bitcoin. As the industry grew, a metric was born called BTC dominance that made it more clear how much weight the top coin had compared to the rest of the market.

Prior to 2017, Bitcoin accounted for as much as 95% of the entire cryptocurrency market, but fell to a low of 35% less than a year later during what is considered to be the greatest altcoin season on record.

Related Reading | 2022: The Year The Secular Bitcoin Bull Run Could End

After reaching such extremes in 2018, by 2020, Bitcoin had recovered more than two-thirds of the market cap. Dominance topped out near 70% where it sharply reversed all throughout 2021.

At the close of the 2021 yearly candle, a several year trading range was officially breached. The well defined range is even more visible in the six-month BTC.D chart. And it could create the conditions necessary for an unprecedented altcoin season.

The yearly (left) and six-month (right) BTC.D chart | Source: CRYPTOCAP-BTC.D on TradingView.com
Unprecedented Altcoin Season Could End At 32% Dominance

With a decisive close on high timeframes, lower timeframe patterns could provide clues as to where dominance might bottom out once again.

Related Reading | Bitcoin Falls Flat: Examining A Rare Bull Market Corrective Pattern

The target of a head and shoulders top sent BTC.D to the dashed line, reinvigorating altcoins but still falling short of the mania seen during the 2017/2018 peak.

A descending triangle could target 32% dominance | Source: CRYPTOCAP-BTC.D on TradingView.com

With a potential descending triangle breaking down, the measure rule would make the target of the structure around 32% dominance. The target would suggest a move beyond the former historic low set years ago – and create the atmosphere needed for the aforementioned altcoin season mania.

But it all could come at the expense of Bitcoin and its undisputed reign as the number one cryptocurrency by market cap.

Follow @TonySpilotroBTC on Twitter or join the TonyTradesBTC Telegram for exclusive daily market insights and technical analysis education. Please note: Content is educational and should not be considered investment advice.

Featured image from iStockPhoto, Charts from TradingView.com

Analyzing Altcoin Season And The Impact Of A New Bitcoin All-Time High

Bitcoin price is only striking distance away from potentially setting a new all-time high, or only about a 15% move higher for the new record to be set. As the top-ranked cryptocurrency surprisingly weathers the macro turmoil as of late, altcoins have suffered dramatically and for the most part bled while BTC has been rising.

Alt investors are capitulating, and moving their capital into BTC as to not miss the coming last leg up. But what exactly does this mean for the ongoing altcoin season? Is it over? Or will there be another leg up like there could be in Bitcoin – a move that is becoming increasingly clear by the day?

Alt Season, Bitcoin Dominance, And The Theory Of Five Waves Down

Bitcoin and altcoins have a very unusual relationship, despite being assets of the same class. Top traders such as Nik Patel have spent years working to understand the strange, cyclical behavior between BTC and alts, and have found some success.

After such an explosive altcoin season, the market is convinced that the music has already stopped, asset prices have topped out, and have started to reallocate heavily into the strength of BTC.

Related Reading | How 90-Year Old Market Wizardry Predicted The Bitcoin Breakout

But much like Bitcoin’s recent pullback is close to proving to be little more than a massive bull market shakeout, due to the relationship between alts and BTC, this divergence between the two types of crypto assets could be a similar shakeout.

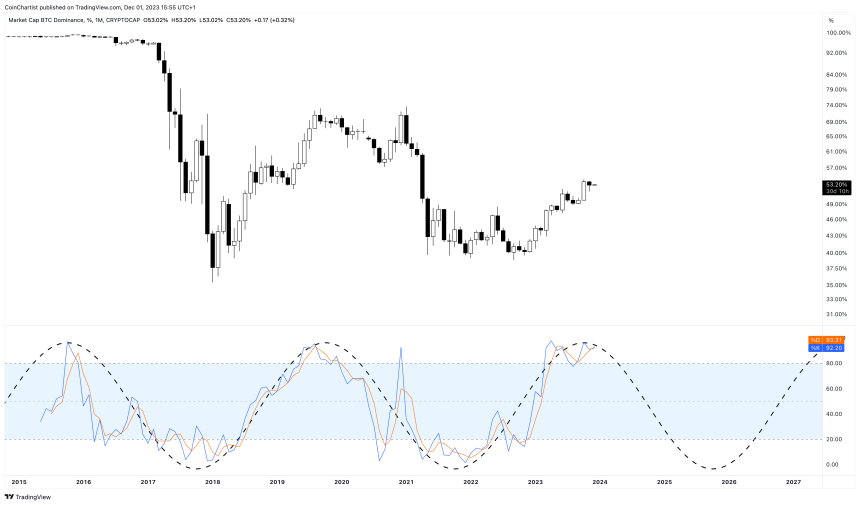
BTC dominance suggests another wave down. | Source: CRYPTOCAP-BTC.D on TradingView.com

Many analysts, such as Elliott Wave International’s Tony Carrion, subscribe to the idea that BTC is about to enter a wave five impulse against the dollar. That would suggest that BTC just completed a wave four, which in the end was a big bear trap. But what if alts are close to finishing a wave four against BTC, with another wave to follow? That’s exactly the picture BTC dominance tells.

Comparing the total altcoin market cap sans BTC against the king itself, shows that alts might shockingly be undervalued by comparison. A similar shakeout in momentum can be seen during the last cycle using the LMACD, pictured below.

Alts are lagging behind BTC in valuation comparatively. | Source: CRYPTOCAP-TOTAL2 on TradingView.com
Which Altcoin Will Survive Best Against BTC When Retail Returns?

Looking at the total crypto market cap and comparing it against Bitcoin price, there are some similarities between the two potential points highlighted by an ascending triangle. The bullish chart pattern if valid would result in a similar up move – taking the cycle to its climax in both Bitcoin and altcoins.

An ascending triangle fractal could launch alts to new highs. | Source: CRYPTOCAP-TOTAL on TradingView.com

With so many altcoins having already performed so well, capital very well could flow into other lagging coins, leading to underperformance in alts that have previously done well.

Related Reading | Astro Crypto: Summer Bitcoin Slump Could Bring Bountiful Fall Harvest

For example, during the last cycle, although both BTC and ETH went on to new highs, it was Litecoin and XRP that performed the best during the last leg up.

Both assets were well below the triangle consolidation during the last cycle, and once again have found themselves lagging severely behind. Is this time different? Not much has changed from cycle to cycle.

Underperforming altcoins could perform the best in the next wave | Source: CRYPTOCAP-TOTAL on TradingView.com

The direction of BTC dominance can be deceiving, as the direction of the chart is down when altcoins are doing well. The rest of the charts, which use the same assets in unique juxtapositions, make for a more compelling argument as to why altcoin season has barely even started yet. And the current divergence between BTC and alts is possible the same type of a shakeout that most of the market just fell for in the BTCUSD trading pair.

The psychology behind this expectation, is that the market has realized it was wrong about BTC, and is selling USD, alts, anything to get back into position. When Bitcoin gets back to new all-time highs and attracts more attention to the market, newcomers will go to alts and not BTC.

The higher the top-ranked cryptocurrency gets toward $100,000 and more, the less likely anyone but institutions or the extremely wealthy can afford it. Altcoins will be the next best bet – especially ones that have no sellers remaining such as those that have underperformed thus far.

This is the best alpha I can offer regarding the future of #Bitcoin price. I do not think we see a lower low, regardless of if we continue to correct. Bears will not get their win before bulls get $100K. All info pulled directly from the source: https://t.co/BhmNxjeE4I pic.twitter.com/WU6snm9aCu

— Tony "The Bull" Spilotro (@tonyspilotroBTC) September 23, 2021

Follow @TonySpilotroBTC on Twitter or via the TonyTradesBTC Telegram. Content is educational and should not be considered investment advice.

Featured image from iStockPhoto, Charts from TradingView.com

Believe It Or Not, Bitcoin Maxis, Altcoin Season Might Not Have Yet Begun

Because Bitcoin is the first ever cryptocurrency, it often has a cult-like following of investors who won’t touch an altcoin no matter the potential ROI or promise behind the technology. But the recent alt season has investors in profit from the bull run converting BTC into other coins in search of better performance.

After such an incredible run by assets like Ethereum, Cardano, Solana, Dogecoin, and several others, and the fact Bitcoin is building momentum, the expectation is now that BTC dominance will soon reverse, and altcoins will see some reckoning as a result. However, according to the Relative Strength Index on monthly BTC.D charts, altcoin season might not yet have even started.

Bitcoin Dominance Takes A Hit, But The Fall Might Just Have Begun

An altcoin season is defined as a period of time when alts outperform Bitcoin by a large margin. The top cryptocurrency’s 200% returns of 2021 are shocking by normal standards, by compared to the run that Dogecoin, Solana, or Cardano have had since the year began, it is a meager milestone at best.

Related Reading | Bitcoin Golden Cross: Everything You Need To Know About The Bullish Signal

Most cryptocurrencies have been beating Bitcoin in both USD growth and on the BTC ratio. Such altcoins are often trending, shooting up in price after a listing or sometimes for no reason at all. All signs point to an altcoin season that has already produced life-changing results.

Except the real altcoin season of this cycle might not yet have even truly started, if the Relative Strength Index is any indication.

Losing this support level could send altcoins into overdrive | Source: BTC.D on TradingView.com
The Level To Watch For The Altcoin Season Finale

Examining the chart above, BTC dominance has yet to reach oversold conditions on the monthly timeframe. Bitcoin itself rising above a reading of 70 on the RSI sent the cryptocurrency into the bullish impulse that took it to $65,000. Falling below 30 is the opposite signal.

During the last cycle, dominance briefly dipped into oversold territory, but didn’t truly go bonkers until the second half of 2017. Altcoin season stayed active full steam until early-to-mid-2018, when the bear market began and Bitcoin became the better store of value.

Altcoins then fell by 95% or more in most cases, with Bitcoin only dropping by around 84% in contrast. The metric then bounced by more than 100% from 35% to 72% dominance in favor of Bitcoin at the very top.

Related Reading | Ethereum “Accumulation” Nears Liftoff Phase: What This Could Mean For BTC

Currently, dominance is hanging around the 41% level, which was the second in a series of peaks marking the double bottom pattern that ended altcoin season the last time. Blasting through it, should send the monthly RSI into overdrive, and ring in the true altcoin season where unimaginable wealth is made.

Other signals that the storm has yet to arrive, is the Bollinger Bands only recently starting to turn down and expand compared to the last cycle, along with the LMACD barely having turned bearish by comparison.

What if I told you, altcoin season might not have even started yet? And what would this mean for #Bitcoin? pic.twitter.com/oUXulufJ4e

— Tony "The Bull" Spilotro (@tonyspilotroBTC) September 16, 2021

Follow @TonySpilotroBTC on Twitter or via the TonyTradesBTC Telegram. Content is educational and should not be considered investment advice.

Featured image from iStockPhoto, Charts from TradingView.com

Why Bitcoin Dominance Could Submit To Altcoin Season Several Months Longer

Bitcoin price is struggling to break through resistance at $50,000, and it could partially be altcoins to blame for the weakness. The most recent technical structure on the highest time frames suggests that not only could alts continue to gain against BTC dominance, altcoin season itself could last a while longer.

Bitcoin Dominance And Technical Analysis Using The Metric

Technical analysis is a subjective art. The practice has enough naysayers as is, but even those that subscribe to the study don’t always believe that all charts are created equally.

For example, there are several industry vets that do not believe BTC dominance – a metric that weighs Bitcoin against the rest of the crypto space in terms of market share – has value as part of crypto analysis.

Related Reading | Total Crypto Market Cap Reenters Monthly RSI Bull Zone

If Ethereum outperforms Bitcoin, for example, dominance might dip as a result. The magnitude of this is enhanced further due to the sheer volume of unique altcoins that exist today. Some even argue that the metric itself was once useful, but less so due to dominance not including the vast world of NFTs or the constant sea of new DeFi projects springing up.

For those that are believers, the recent altcoin season could have been predicted with some degree of accuracy. And if the metric continues to hold weight, altcoin season might have another few months left.

Could altcoins beat Bitcoin at its own game a while longer? | Source: CRYPTOCAP-BTC.D on TradingView.com
Why Altcoins Season Could Last Several Months Longer

BTC dominance has established a massive trading range between 70% and 38% dominance. While altcoin sentiment was at its worst compared to Bitcoin, the range failed to break to the upside, resulting in a swing to the lower boundary of the trading range.

BTC.D stopped short of touching the previous bottom, but is following a pattern from the last cycle that suggests not only will the lower boundary be touched, lows will be swept and perhaps a new range reached.

Related Reading | New To Bitcoin? Learn To Trade Crypto With The NewsBTC Trading Course

Technicals also support a fall into the bear zone – or oversold levels – on the Relative Strength Index. The total crypto market cap has also reentered the bull zone on the RSI, all while Bitcoin struggles with resistance.

The LMACD is still fully red on the histogram and not nearly at the depths, lengths, or oversold levels as the last market cycle. All of the signals combined suggest that altcoins are likely to outperform Bitcoin for another few months.

A monthly candle close below the trading range highlighted in the chart above might be the exit signal that altcoin season is over, and putting any crypto capital back into BTC might become the more profitable venture again. Before it happens, there could be extreme volatility on the dominance chart in a battle that’s brewing between Bitcoin and altcoins.

Follow @TonySpilotroBTC on Twitter or via the TonyTradesBTC Telegram. Content is educational and should not be considered investment advice.

Featured image from iStockPhoto, Charts from TradingView.com

Bitcoin Loses Crucial Support Never Broken During Last Bull Run

With Bitcoin price falling to the low $40,000 range, debate has picked up on if the once trending cryptocurrency’s bull run is now over. There’s no truly telling for sure, however, this time is very different than the last bull market.

Why? Because Bitcoin price just lost a key level that never once saw a weekly close below during the last market cycle. Could this be it for the bullish impulse – long before predictions of $100,000 or more per coin are ever reached?

Crypto Cycle Could Conclude With Key Level Lost From Past Trends

Cryptocurrencies are a highly speculative asset class, regardless if adoption is picking up or not. Sure PayPal is now game, as is Visa and an assortment of others, but the volatile assets have a long road of price discovery ahead.

Although most recent crypto participants only have known “always up” as the direction of the trend, things have recently taken a turn downward.

bitcoin bollinger bands close

BTC has lost the middle Bollinger Band or 20-week SMA  | Source: BTCUSD on TradingView.com

But is this “the top?” It’s hard to say. One thing for certain, however, is that Bitcoin price has now lost the middle Bollinger Band – also the 20-week SMA.

Passing through the mid-BB in and of itself can be a powerful buy or sell signal.

Related Reading | Bitcoin Dominance Dives To Lowest In Years, Altcoin Season Is Finally Here

However, the fact that during the last bull run Bitcoin weekly never closed below it, it could be a sign that the structure of the bull market has been broken. bitcooin bollinger band zoomed bull

Never once was there a meaningful weekly close below the mid-BB  | Source: BTCUSD on TradingView.com

Will Bitcoin Price Snap Back Into A Bull Phase? What To Look For

The Bollinger Bands are a tool created by legendary trader John Bollinger. The tool has a variety of uses, namely measuring the volatility in the price action of assets like Bitcoin.

The technical analysis indicator consists of a 20-session SMA as mentioned, and two standard deviations of that moving average that widen and contract based on volatility.

When they tighten or “squeeze” it can be a sign a massive move is coming. These large moves can begin or continue a trend after a long pause.

bitcoin bollinger bands
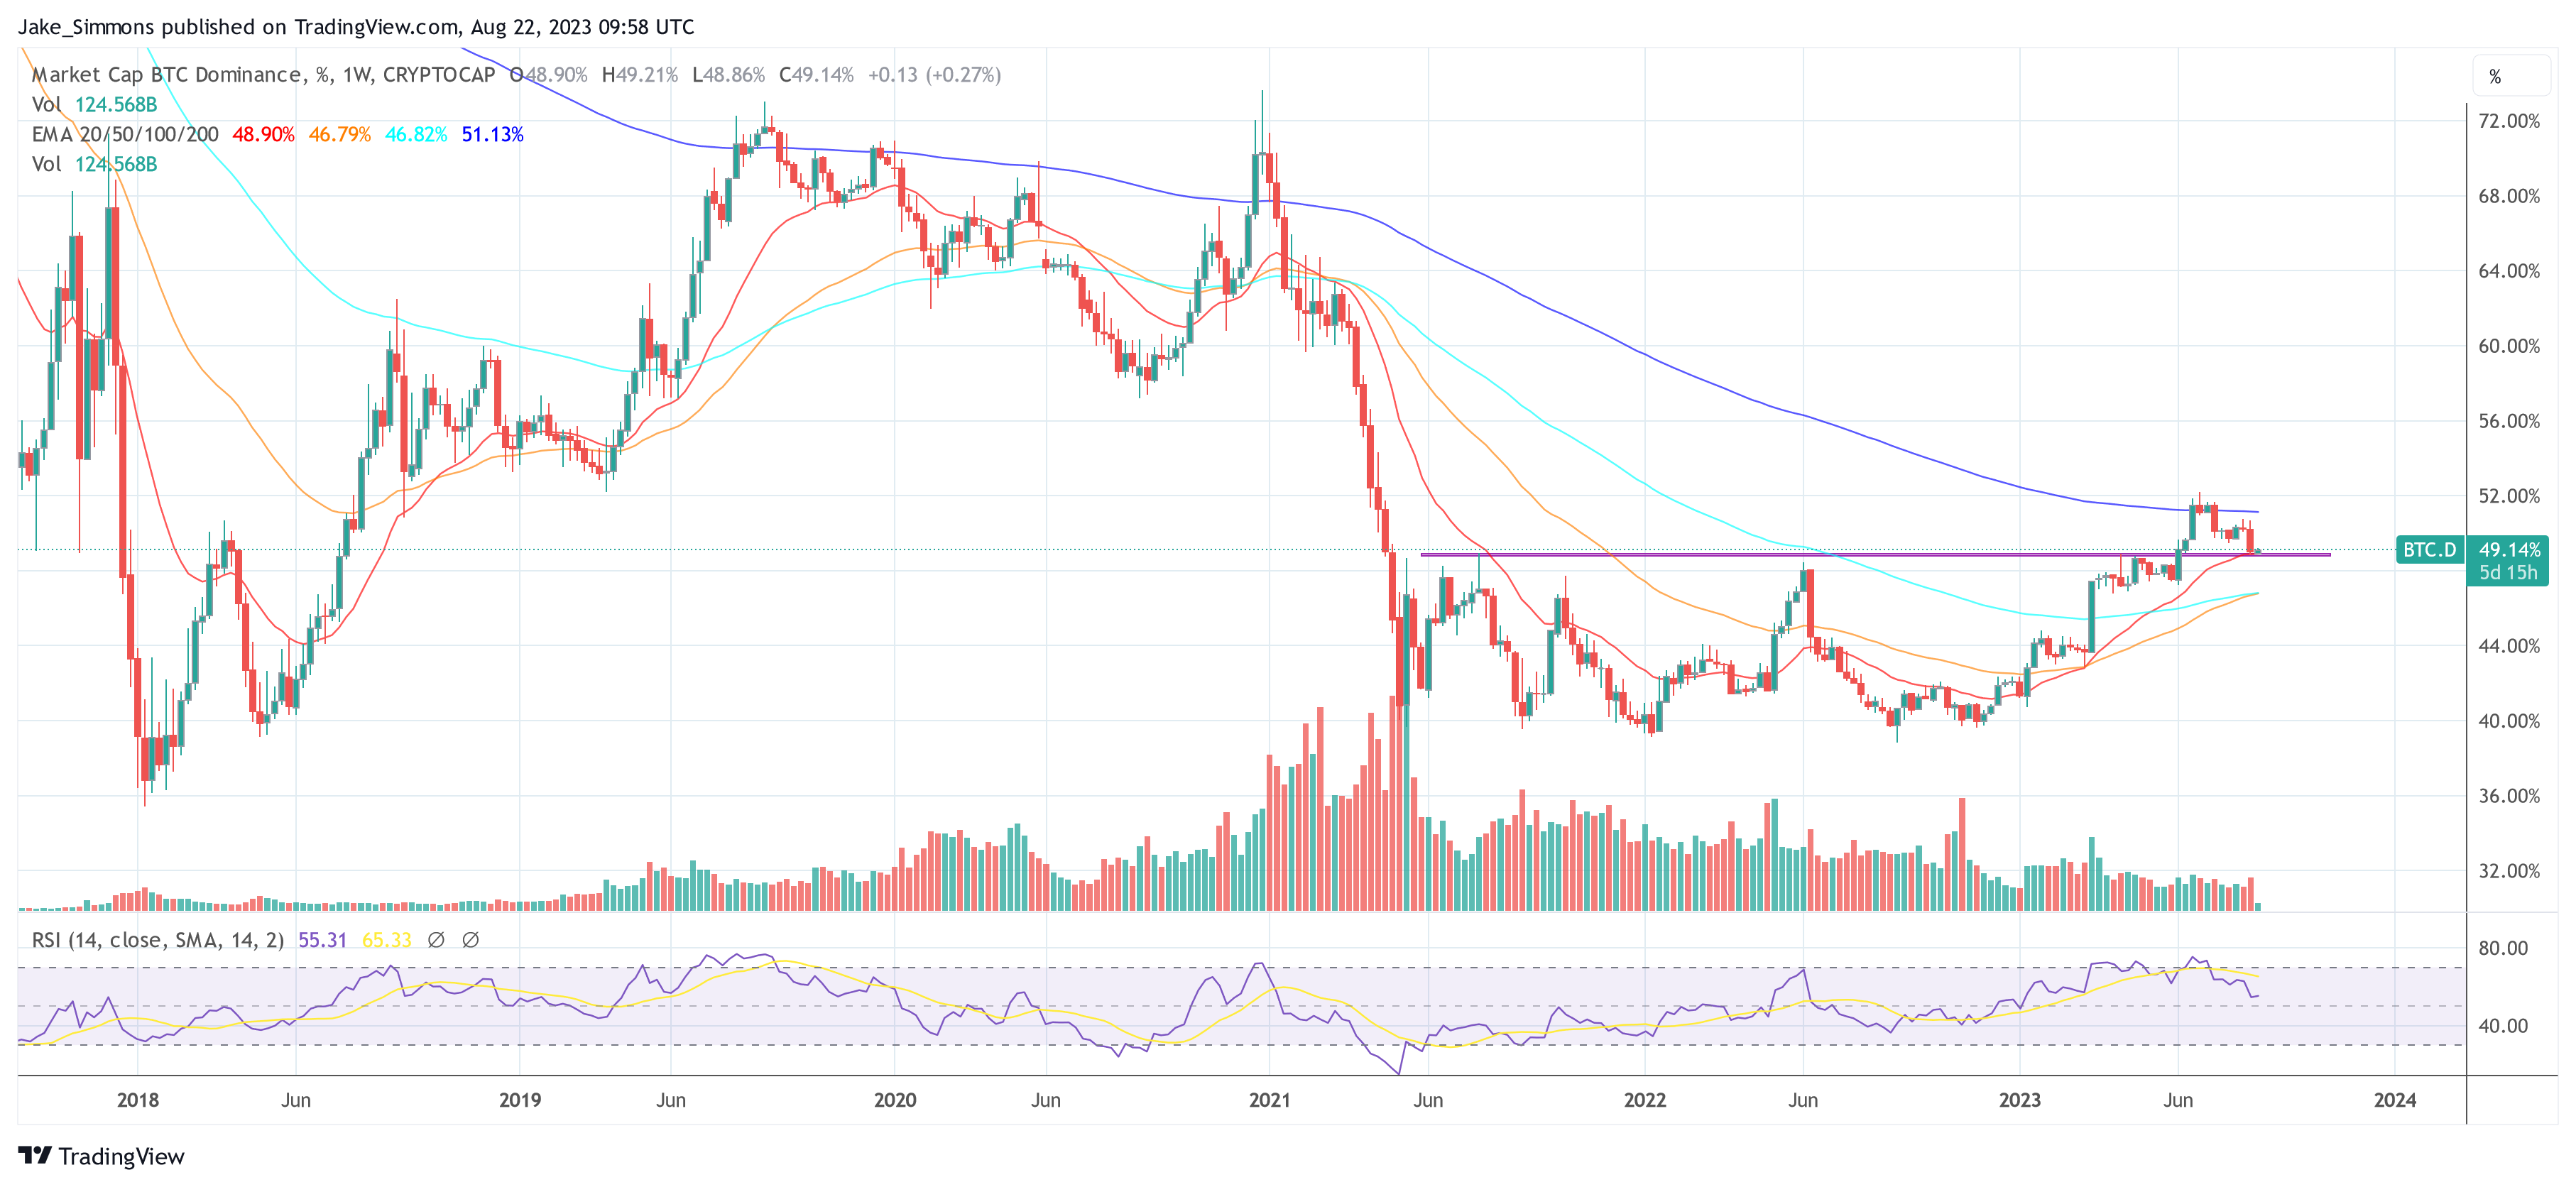
The recent peak has more similarities with 2018 and 2019 than 2017  | Source: BTCUSD on TradingView.com

Bitcoin weekly timeframes have tightened during the recent consolidation phase, and a breakout has started. However, the direction appears to be down according to the middle-Bollinger Band. Passing through the middle-band typically results in several touches of the bottom band to find support.

Like last major “tops” the bottom bands widened to extremes, but when they began to tighten back up, the trend was over. A rounding of the top bands also is a sign of the tools suggesting a break in the bull run.

Related Reading | All About The Bollinger Bands

As for when Bitcoin is ready to turn bullish again, it could be worth waiting for the cryptocurrency to reclaim the middle-BB, which outside of Black Thursday and now, have always been a sign of a bull rally in the making.

With Bitcoin now below the key level, the case for a bear phase, however, is now just as strong.

Featured image from iStockPhotos, Charts from TradingView.com

Bitcoin Dominance Dives To Lowest In Years, Altcoin Season Is Finally Here

Bitcoin price was rejected from above $55,000 and is now back to sinking lower. Meanwhile, altcoins like Ethereum continue to climb complete unaffected by the leading cryptocurrency by market cap.

The recent divergence between the top dog and the rest of altcoins, has resulted in Bitcoin dominance taking a nosedive to levels not seen since 2017 and 2018. Could this be the official start of altcoin season before the market cycle starts all over again?

BTC Dominance Returns To Levels Not Seen Since Last Crypto Bull Market

It has been more than 1000 days that have passed since the last time BTC dominance was below the 50% level, signaling that altcoins had taken over the crypto market.

The past 1000 and then some days have been completely dominated by Bitcoin instead, rising to as high as 73% peak dominance at the end of 2020.

Related Reading | Ethereum Closing In on $2,800 As ETH 2.0 Deposit Contract Hit New ATH

BTC.D, a metric weighing the top cryptocurrency’s market cap against the rest of the space, is now back below 50% and could be ready to set new lows if an altcoin season truly is upon us.

Altcoins capturing much more dominance this time around makes sense, as there are easily several more times the coins that have appeared since, and each market cap individually is ballooning.

bitcoin dominance altcoin season

A weekly close below that box starts altcoin season | Source: CRYPTOCAP-BTC.D on TradingView.com

What Altcoin Season Means For Bitcoin, Ethereum, Litecoin, And Other Top Coins

If altcoin season really is here, there are a few things that crypto investors can expect according to past cycles. Altcoin season’s start doesn’t always mean that Bitcoin’s run is over.

During the 2017 bull run, there were two distinct altcoin seasons, with only one ending the historic crypto market cycle. Altcoins topped much after Bitcoin, which is a scenario that could be coming into play now.

Related Reading | The Rise Of Dogecoin: The Good, Bad, And The Ugly

But with Bitcoin still so bullish, just because altcoin season is here doesn’t mean the bull run for BTC is over. Instead, altcoin capital could flow back into BTC, propelling the top brass crypto asset even higher.

Once the coin then tops out for the grand finale cycle peak, another altcoin season could act as exit liquidity before the cycle ends, and it all starts to repeat again.

The biggest and most respected altcoins like Ethereum and Litecoin would run first, then from majors money will flow into mid-caps, and eventually risk will venture into small-caps for moonshot-type gains.

The most important thing is to get out when it looks like things are about to end, as altcoins tend to collapse by as much as 99% when they run out of steam eventually, and momentum turns downward instead.

Featured image from Pixabay, Charts from TradingView.com

How Bitcoin Dominance Bullish Engulfing Could Signal An End To Altcoin Season

Bitcoin price is diving currently, shaking up the crypto market as a whole. In addition to the correction in the top cryptocurrency by market cap, altcoins have taken an even more severe beating.

With top alts like Ethereum and Litecoin are seeing an even further drop on BTC trading pairs, Bitcoin dominance has formed a bullish engulfing candle just as a key technical indicator reach overheated status. Here’s how that could put an abrupt end to the ongoing altcoin season.

Bitcoin Price Drop Causes Altcoins To Flop

Bitcoin is the first ever cryptocurrency that an entire industry was built from since, and anything that isn’t BTC is considered an altcoin. Ethereum is currently the king of that camp, and is outpacing Bitcoin in performance since its inception.

But due to first move advantage and just how dominant Bitcoin is, it represents more than 50% of the entire crypto market cap. The BTC dominance metric was created to measure the rest of the crypto market and its weight compared to all altcoins.

Related Reading | Following Bitcoin “Reset,” It’s “Off To The Races Again”

BTC dominance has dropped by 18% since end of 2020 highs, leaving a red streak behind. However, during today’s crypto market bloodbath, the metric began to make a comeback and has formed a bullish engulfing candle.

A bullish engulfing candle is a type of Japanese candlestick formation, that typically suggests a short term reversal is in the coming. It forms when after a sharp bearish move, sellers are overwhelmed by a sudden surge in bullish buying. It is then up to bulls to continue the reversal.

bitcoin dominance btc.d reversal bullish engulfing

A bullish engulfing appears as daily RSI reached oversold conditions | Source: CRYPTOCAP-BTC.D on TradingView.com

BTC Dominance Reversal Could Put An End To Alt Season

Coinciding with the bullish engulfing candle pictured above, the daily Relative Strength Index fell sharply into oversold territory. If a reversal plays out in BTC dominance, whatever altcoin season that’s been going on recently, will be over.

Adding more credence to the theory of further reversal in the relationship between Bitcoin and altcoins, on weekly timeframes a hidden bullish divergence has formed, just as BTC.D touches down at the bottom Bollinger Band.

Bitcoin dominance hidden bull div

A bull div on the RSI has formed as dominance falls to Bollinger Band support | Source: CRYPTOCAP-BTC.D on TradingView.com

Divergences occur when price action moves opposite a technical indicator – in this case the Relative Strength Index again on weekly timeframes. Although daily has fallen into completely oversold levels, weekly either has more to go, or buyers are secretly showing up ready to stage a reversal.

Counter Point | Why Bitcoin Dominance Is No Longer Relevant To Crypto

If bulls can begin the comeback starting with a bullish engulfing today, and close out next week with a powerfully bullish move, a morning star doji pattern will be left on weekly charts, adding yet another signal that an extended reversal could result.

Any reversal in BTC.D, could either have Bitcoin leaving alts in its dust, or the coins crash far further than the top cryptocurrency does on its way back down. All that’s left to do, is wait and see.

Featured image from Deposit Photos, Charts from TradingView.com