FOMO Fuels Bitcoin’s 35% Jump, Options Flow Hints At Bigger Upswing

The price of Bitcoin seems on the brink of blasting past its all-time high (ATH) at the high area of its current levels. The cryptocurrency has been on a bull run due to the launch of spot Bitcoin Exchange Traded Funds (ETF), which officially onboarded institutions to the nascent sector.

As of this writing, Bitcoin (BTC) trades at around $62,900 with a 3% profit in the last 24 hours. In the previous week, the cryptocurrency recorded a critical 22% profit. It stood as one of the three top gainers in the top 10 by market cap, only surpassed by Solana (25%) and Dogecoin (57%) in the same period.

Bitcoin BTC BTCUSDT price

Bitcoin-Based Derivatives Hint At Further Gains

Data from the derivatives platform Deribit indicates a spike in long positions by Options operators. Since early February, these traders have accumulated important call (buy) contracts with a strike price above $65,000.

At first, as the report indicates, the increase in bullish positions was thought to be part of a Bitcoin “Halving” strategy. However, the BTC ETF Flows seem to be the key component behind the rally.

As cryptocurrency entered the $60,000 area, several operators rushed to accumulate call contracts, leading to a Fear Of Missing Out (FOMO) rally to its current levels. The chart below shows that the FOMO buying began when BTC breached the $57,000 level.

Bitcoin price BTC BTCUSDT chart 1 options flow

The spike in trading activity during yesterday’s session led to a significant jump in Implied Volatility (IV). Overleveraged positions further propelled the metric, Deribit stated:

The 62k to 64k surge was so quick, and with high leverage across the whole system, that when sales hit the market a cascade sent BTC down to 59k in 15mins, and some Alts (also massively leveraged) dropped 50% on some exchanges before promptly bouncing as BTC jumped to 61.5k.

As the market continues to experience sudden moves due to the high IV, there is little change in the market structure in the derivatives sector. In other words, Deribit still records a lot of bullish positions for the coming months, which suggests optimistic conviction by these players.

BTC Price On The Short Timeframe

Despite the bull run, the Bitcoin price could dip as euphoria takes over the market. According to economist Alex Krüeger, the spike in trading volume across the derivatives sector indicates the formation of a “local top.”

The analyst believes that retail has returned to the market driven by FOMO, which often hints at short-term predicaments for long traders. Krüger predicted further gains into the $70,000 area via his official X account and then a drop into the $55,000 area.

The analyst stated:

ATH are inches away. That’s price discovery territory. Thus very easy for things to get even crazier. This is just not where one opens new longs. Too easy to get a quick flush out of nowhere. Ideally we see funding cool down and price consolidate below ATH then break out.

Cover image from Dall-E, Chart from Tradingview

Bitcoin’s Rise To $52,000 Masks Potential Pitfalls Ahead, Analyst Warns

Crypto analyst Justin Bennett has laid out a bearish narrative for the flagship crypto token Bitcoin. Based on his analysis, Bitcoin will likely drop below the $50,000 level again before it moves further to the upside. 

Bitcoin Could Drop Back To As Low As $47,000

In an X (formerly Twitter) post, Bennett mentioned that the price range between $47,000 and $49,000 “is the land in the sand” for Bitcoin. This statement came from his belief that the crypto token will soon see a price retracement. He also reminded his followers of how “Bitcoin carves significant tops.”

The crypto analyst suggested that $52,000 was a ‘significant top’ and that a price correction could be imminent. Bennett added that his prediction could be invalidated if BTC saw a sustained break above $53,500. Meanwhile, he also compared Bitcoin and US stocks, stating that there was an ongoing correlation between them.  

Bennett also disagrees that Bitcoin’s rally could be longer this cycle, especially considering the demand that the Spot BTC ETFs are seeing. He stated his indifference about these funds and mocked how everyone predicted they would send Bitcoin to a potential all-time high (ATH). 

From a technical analysis perspective, the crypto analyst was more concerned about BTC’s price action and remarked that “the chart will tell the story.”

BTC Fundamentals Are Getting Stronger

While Bennett predicts that Bitcoin will drop soon enough, it is worth mentioning that the crypto token’s fundamentals are getting stronger, which could also dictate its price action. Citing data from Glassnode, crypto analyst Ali Martinez recently revealed that the amount of BTC held in known crypto exchange wallets has dropped to its lowest in six years.

As highlighted by Martinez, this suggests that the market sentiment around the flagship crypto is changing, with most investors looking to hold for the long term.

That is considered a positive development and bullish for Bitcoin’s price since the amount of BTC that can be acquired is further reduced, creating some form of scarcity. 

The crypto analyst had also recently mentioned how Bitcoin holders are currently in a phase of belief, which signals potential further gains ahead for BTC. 

According to CoinMarketCap data, Bitcoin is trading at around $51,900 at the time of writing, up over 2% in the last 24 hours.

bitcoin price btc btcusdt

Chart from Tradingview

Bitcoin Price Omega Candle “Very Real” Says This Developer, Here’s Why

The Bitcoin price saw a spike in volatility due to the decision around the spot Exchange Traded Fund (ETF). Market participants await an announcement at any point during the upcoming days, which will likely result in further spikes in volatility.

As of this writing, the Bitcoin price trades at $43,900 with a 1% profit recorded over the last 24 hours. Over the previous seven days, the cryptocurrency records a 3% increase, acting as the best-performing asset in the crypto top 10 by market cap.

bitcoin price btc btcusdt

Bitcoin Price Ready For A Massive Rally?

According to many analysts, the potential implications for the Bitcoin price should the spot ETFs get approval are “impossible” for the market to price in this event. Thus, the bullish effects of this approval can only impact BTC in the mid to long-term as capital enters the financial product.

On the other hand, volatility has been susceptible to sudden spikes, as mentioned above. In late 2022, any news related to the Bitcoin ETF moved the market by thousands of dollars, most notably, the report by the crypto news outlet Cointelegraph inaccurately announcing the financial product launch before receiving confirmation from the US Securities and Exchange Commission (SEC).

Developer Samson Mow claims this effect can benefit Bitcoin prices by pushing them beyond expectations. This week, two conflicting reports by analysis firm Matrixport pushed BTC back to critical support levels.

A similar effect might drive Bitcoin back above the $50,000 area. Mow stated:

Bitcoin dropped $5k on some fake news from a no-name analyst. Imagine what happens when a dozen ETFs are approved and start smash market buying. You may think an Omega candle is impossible, but it’s very real.

Confidence In BTC Grows Stronger

In support of the bullish thesis, trading desk QCP Capital pointed at the recent leverage “washed out” triggered by the Matrixport reports. Over $1 billion in long liquidations were triggered as BTC returned to the $40,000 level.

However, the cryptocurrency climbed back and re-took these levels’ mid-area. In a report, QCP Capital stated the following regarding Bitcoin’s potential to see a stronger rally in the mid-term:

For now, the topside remains capped by resistance at the 46 – 48.5k region with support at the 40.5 – 42k region. In spite of the leveraged washout, BTC has climbed back up to 44,000 level. While we remain wary of a “sell the news” knee-jerk reaction to the downside, this resilient price action gives us more confidence in the medium-term bullish view into BTC halving towards Mar/Apr this year.

Cover image from Unsplash, chart from Tradingview

Why This Analyst Thinks It’s Impossible For The Bitcoin ETF To Be Priced In

On a high note, the crypto market starts in 2024, with BTC’s price rising steadily from $41,000 to around $46,000 as the Bitcoin ETF decision looms. The upcoming decisions by the U.S. Securities and Exchange Commission (SEC) on the BTC spot Exchange Traded Funds (ETFs) could lead to significant market fluctuations.

These decisions, expected between January 5th and 10th, have kept Bitcoin (BTC) and Ethereum (ETH), along with altcoins, on a tightrope with high funding rates indicating a preference for leveraged trades.

Bitcoin ETF BTC BTUCSDT 2

Crypto Market Braces For Bitcoin ETF Decision: Volatility Spikes The New Normal?

According to a report from options platform Deribit, the current market environment is hard to read with the usual indicators. Still, the readings across funding rates hint at a potential decline.

The anticipation of a price drop following the ETF announcement, a classic ‘buy the rumor, sell the news’ scenario, is in full swing. Nevertheless, the report claims the continued rise in crypto and sustained interest in trading BTC futures via the Chicago Mercantile Exchange (CME) highlights a growing enthusiasm for cryptocurrencies from traditional finance institutions.

History suggests that the crypto market often reacts more negatively to actual product launches than preliminary approvals. This was evident in events like the BTC CME futures launch and the Coinbase IPO. If the market prices are high during the launch of these new financial products, it might trigger a short-term sell-off, especially if they fail to meet flow expectations, Deribit stated.

However, any major price corrections should be “brief,” given the favorable macro environment, technical factors, and the build-up to Bitcoin’s halving. In case of decline, traders should watch the $40,000, $37,000, and $31,800 levels as potential support.

Bitcoin ETF BTC BTCUSDT 1

The volatility in Bitcoin and Ethereum has been noteworthy in the run-up to these ETF approvals, with Bitcoin’s implied volatility rising sharply to around 70, outperforming Ethereum. The current volatility levels are likely to decline following the Bitcoin ETF decision.

On the BTC volatility, the report stated the following forecasting a trend for the upcoming bull market:

Ethereum, while similar to Bitcoin, hasn’t yet reached inversion. That said, its long-term volatility is outperforming Bitcoin’s, suggesting optimism for Ethereum in 2024.

In that sense, traders should look for any downside momentum in the ETH/BTC trading pair. Deribit claims that any decrease in the price of ETH is a “buy opportunity,” as suggested by the current market structure.

Impact On Bitcoin Derivatives

The options market’s reaction to the upcoming ETF decision is subtle, with Bitcoin’s call skew recovering quickly after recent market fluctuations. Ethereum maintains a consistent call premium, indicating a marked shift in focus towards Ethereum following Bitcoin ETF approvals.

As for option flows and dealer gamma positioning, Bitcoin’s option volumes have decreased, with the market favoring buying in call spreads and selling in put spreads. In other words, derivatives player have been increasing their call positions in anticipation of the ETF decision in the US.

Regarding the impact of this decision, Deribit and others have provided their views, but one analyst believes that the long-term effect of a Bitcoin spot ETF can’t be measured at the moment. Via the social media platform X, this analyst stated:

It’s impossible for something to be “priced in” if a huge amount of capital literally doesn’t have access yet. Yes, currently eligible speculators and their available capital can buy ahead of an event. But that’s as far as any “pricing in” goes if the pool of participants is about to greatly expand. Note: this does not predict what will happen immediately after ETF approval.

Cover image from Unsplash, chart from Tradingview

A Crypto Christmas Special With Material Indicators: Past, Present, And Future

Another year, another Crypto Christmas special for our team at NewsBTC. In the coming week, we’ll be unpacking 2023, its downs and ups, to reveal what the next months could bring for crypto and DeFi investors.

Like last year, we paid homage to Charles Dicke’s classic “A Christmas Carol” and gathered a group of experts to discuss the crypto market’s past, present, and future. In that way, our readers might discover clues that will allow them to transverse 2024 and its potential trends.

Crypto Christmas: A Deep Look Into The Bull Market And A Secret Pattern

Once again, the crypto analytics firm Material Indicators joined us to discuss the current market structure.
This year, we spoke with Keith Alan, one of the co-founders and analysts at the firm. Alan gave us his perspective on the bull market or what looks like the beginning of a bullish trend.

Material Indicators is well known for their reliance on hard data, and for sharing views that often questioned the general beliefs in the crypto market. This time was no difference as Alan pointed to the evidence favoring both sides, bulls and bears. This is what he told us.

crypto christmas bitcoin etc btcusdt

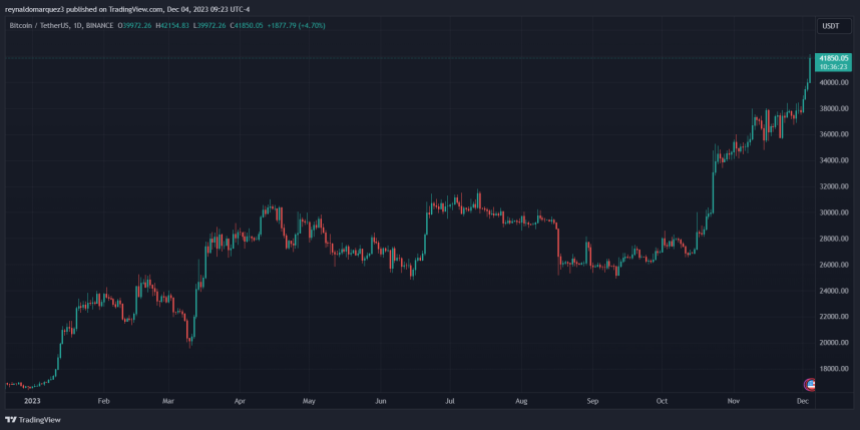
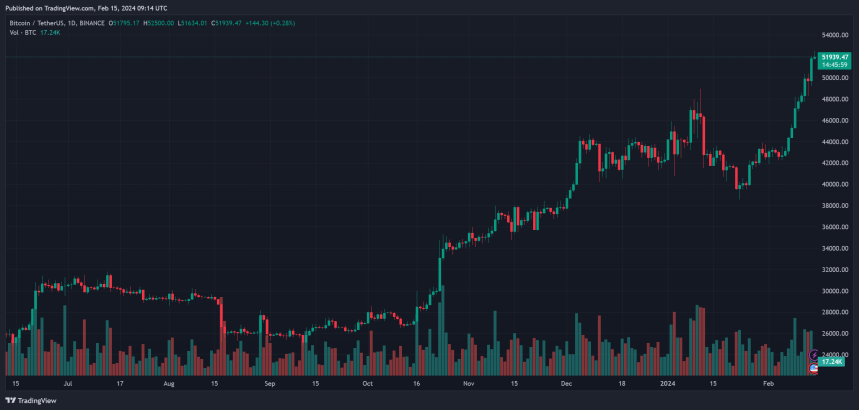
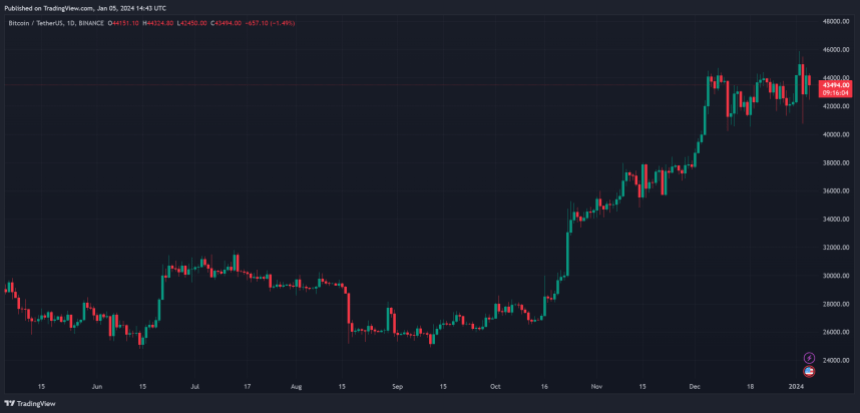
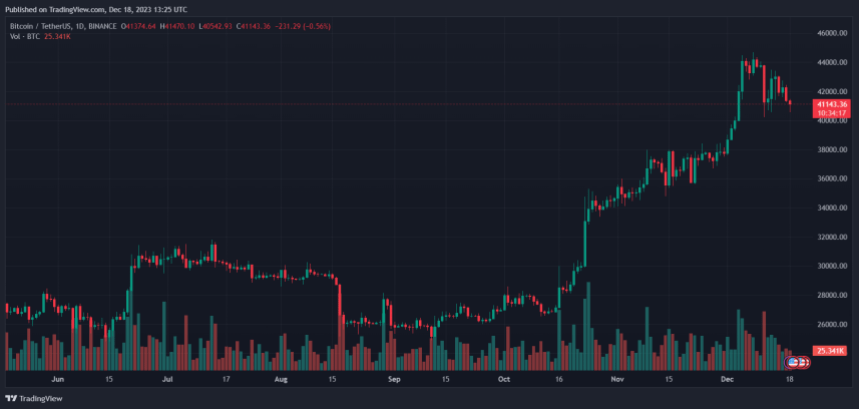
Q: In light of the prolonged bearish trends observed in 2022 and 2023, how do these periods compare to previous downturns in severity and impact? With Bitcoin now crossing the $40,000 threshold, does this signify a conclusive end to the bear market, or are there potential market twists investors should brace for?

MI:

Nobody could argue that 2022 was anything but a bear market. After Bitcoin reached an ATH in November of 2021 we saw the bear market develop in classic fashion by losing support at key technical levels. While the bear was playing out in somewhat predictable fashion, the market was caught off guard by the events that led to the FTX crash in November 2022. Because the contagion from FTX had a devastating ripple effect that was felt by the largest institutions with crypto exposure as well as banks, I actually expected prices to fall even lower. 

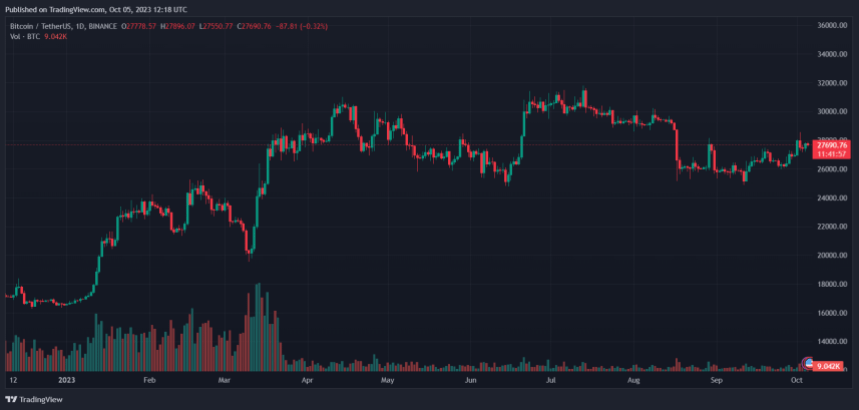
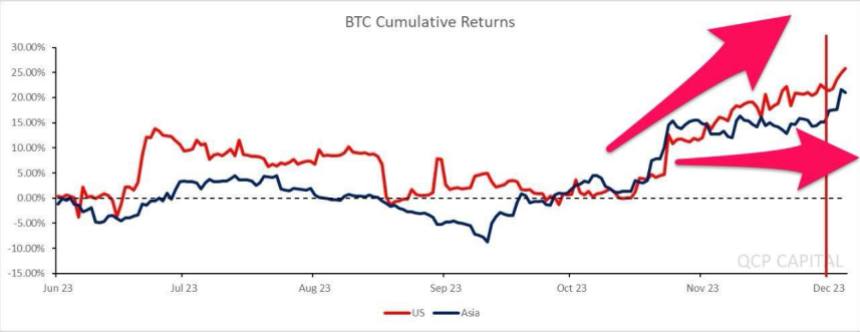
At the time, fear and fighting among institutional players like Galaxy, Gemini and Grayscale (under DCG) who were among SBF’s largest institutional victims added to the concern that price would grind down towards the lower teens, yet somewhat remarkably and perhaps not so coincidentally on January 1, 2023 Bitcoin started to rally. What was first considered weekend whale games evolved long past the weekend, and in fact, through Q1/2023 I identified an entity on FireCharts which I nicknamed “Notorious B.I.D.” that was double stacking large blocks of bid liquidity to push price higher. There was a pattern to the behavior that made it somewhat predictable and tradable. Those moves were well documented in my X feed during that period of time. Once price reached $25k that entity disappeared. Even without the help of that manipulation pushing price up, and despite the fact that the macroeconomic situation was horrible, the geopolitical situation went from bad to worse and the US political situation evolved from a dysfunctional sh*t show to a full blown circus, the market continued to rally. 

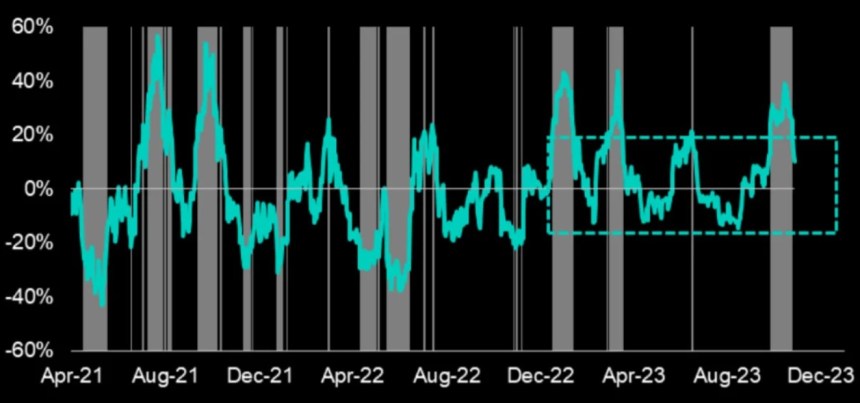
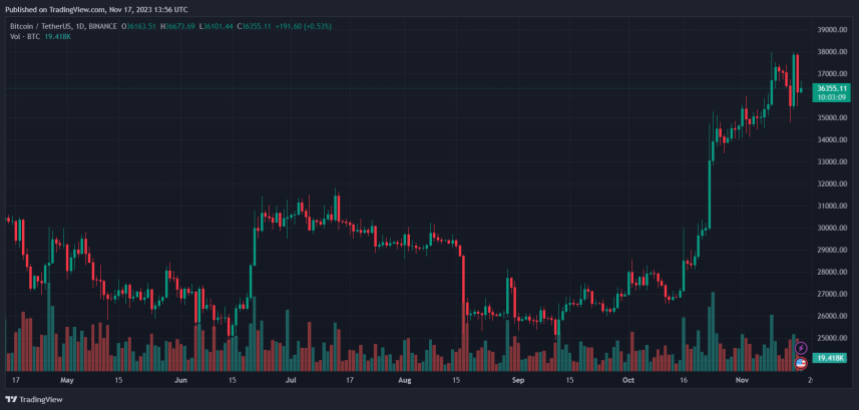
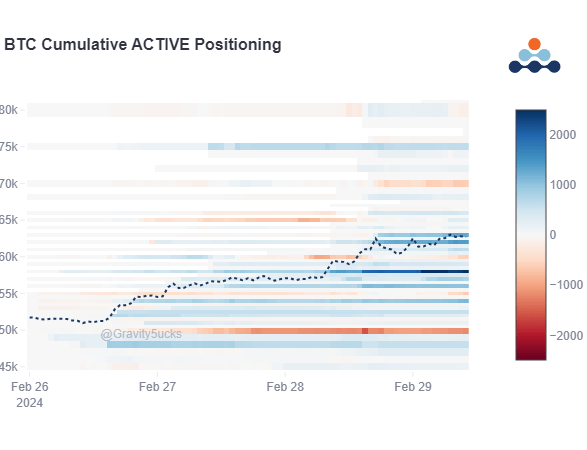
Now, nearly 12 months and > 150% from the day the rally began, the debate between bulls and bears over whether this is a confirmed bull market or a sequence of bear market distribution rallies literally continues today. While it’s understandable that someone could look at 150% and immediately assume bull market, it does require a deeper understanding of what distribution and accumulation look like. From my view, that still isn’t as clear as one would expect. Historically, the Purple Class of Whales with orders in the $100k – $1M range have had the most influence over BTC price direction. The order flow data I’ve been monitoring on Binance shows that through most of the year they (along with larger MegaWhales) have been buying dips and distributing significantly more than they bought on those dips on the uptrends that followed.

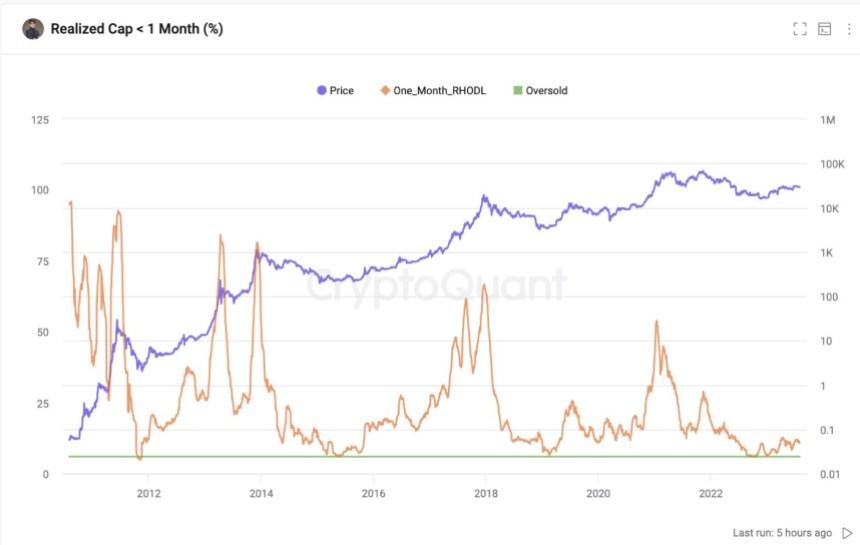
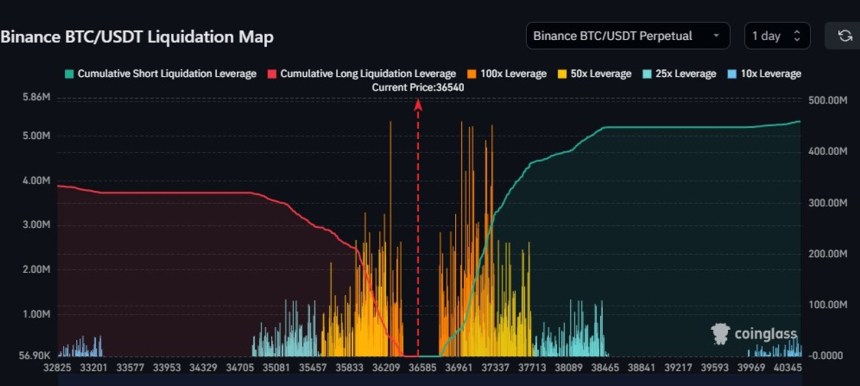
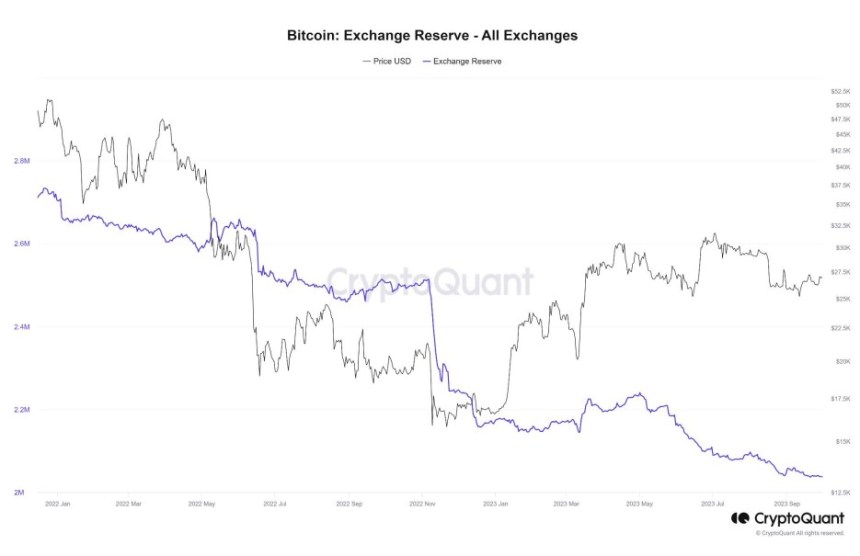
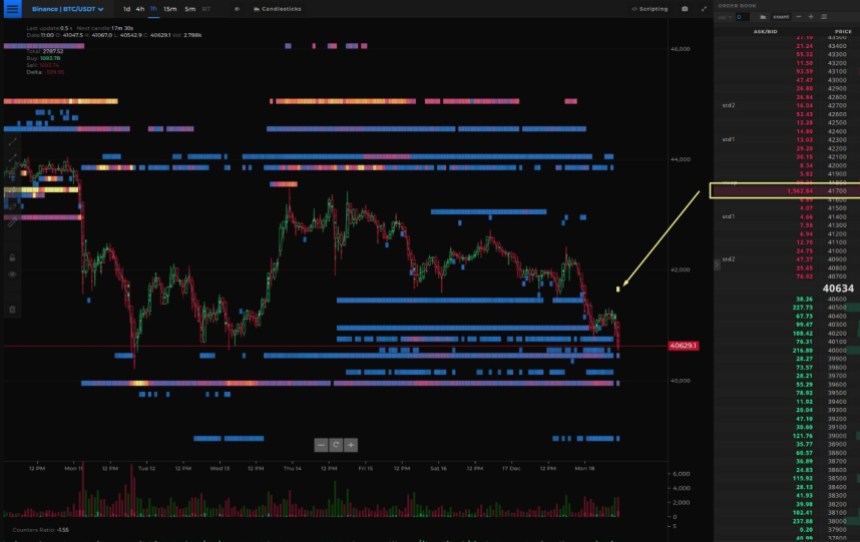
Only recently have we seen an uptick that could be an indication that the trend is shifting. Parallel to that, some on-chain data providers are showing an increase in the number of wallets holding BTC which is also an indication that we could be transitioning from a distribution phase to an accumulation phase and I’m looking for more clear evidence of that. One of the things I look for to get a sense of that is bid liquidity. I believe that “Liquidity = Sentiment,” and it’s no secret that order books have been thin on both sides of price through most of the year, however in the last 3 weeks or so, we’ve started seeing more institutional sized bid ladders coming into the order book and that fact supports a bullish thesis, as long as they don’t dump through the next pump.
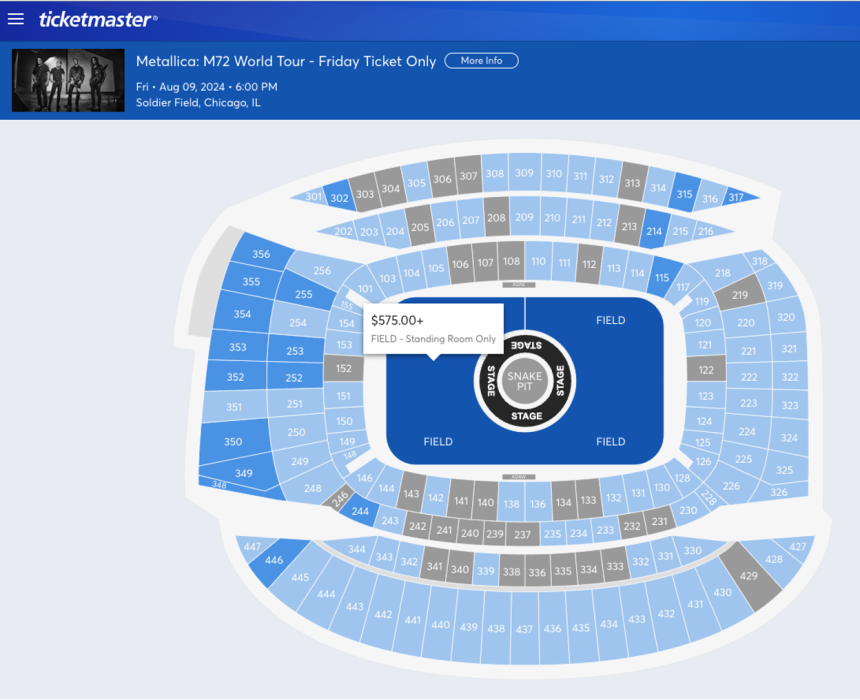
With all of the above in mind, there are most certainly turns and twists that investors should look out for. Sure we are starting to see some improvements on the U.S. inflation and unemployment numbers, but something in those reports doesn’t jive with reality. For most middle and lower income Americans, credit card debt is climbing to new highs, rents have soared, home ownership is unattainable, grocery prices are high and a Metallica “Standing Room Only” Field ticket is $575.  So in my mind, we still have a percolating macroeconomic problem and the geopolitical and U.S. political issues seem to get worse by the day.

crypto christmas

Aside from that, the RSI has been over cooked for an extended period of time and we just had 8 consecutive green weekly candles. Both of those factors have historically led to corrections. I could give you the “History doesn’t have to repeat itself…” spiel or I can show you what historically happens after moves like this and let you decide. 

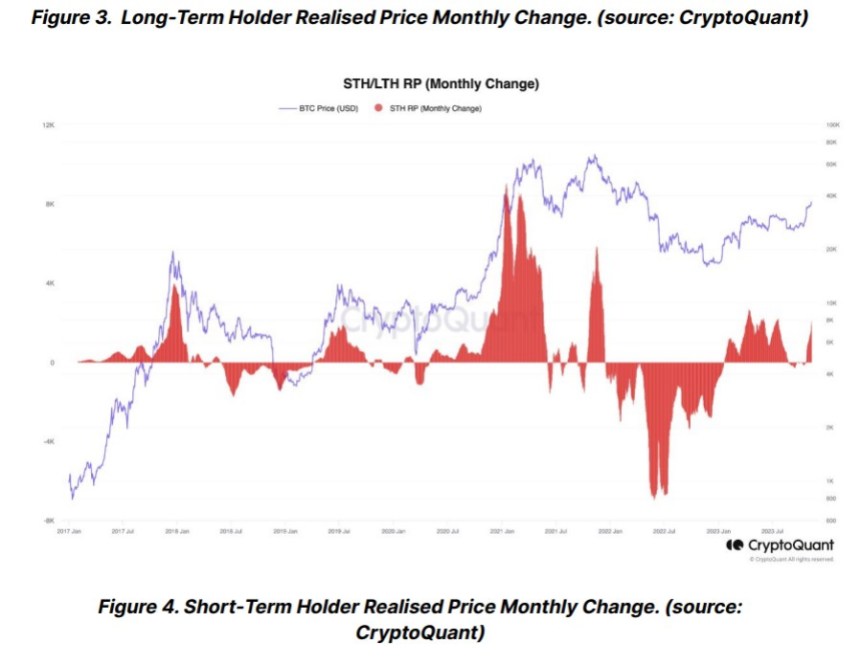
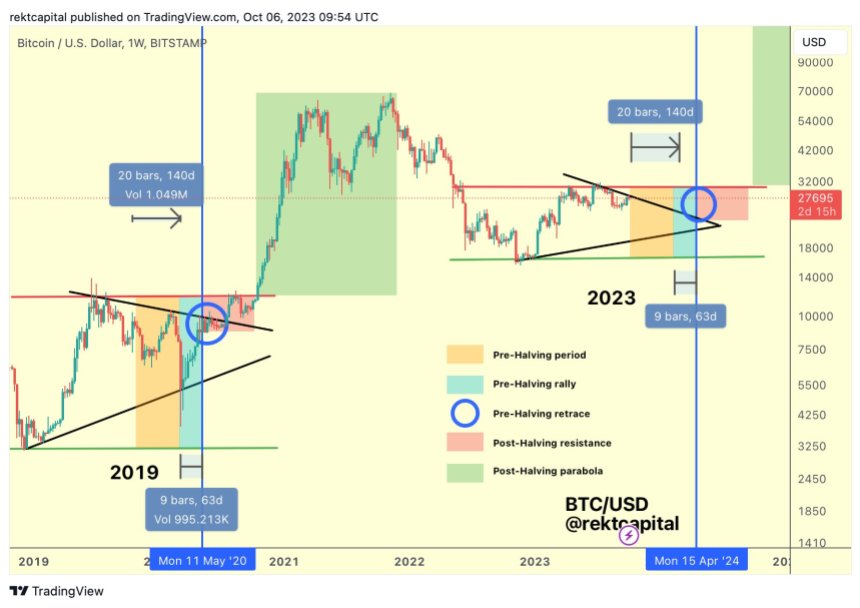
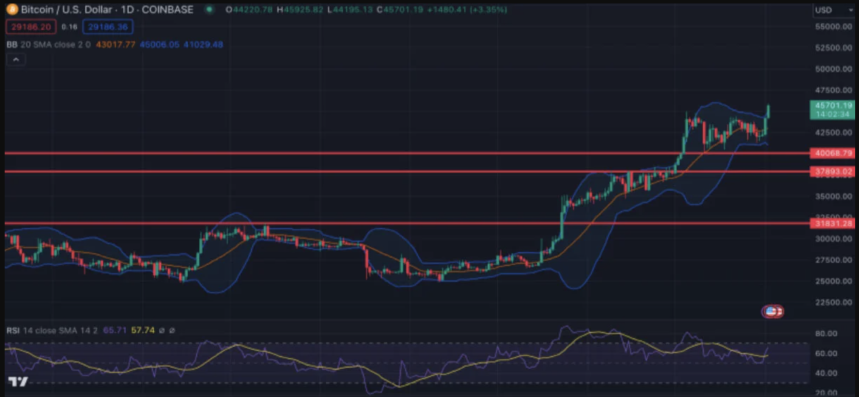
Another potential twist to consider is that the current PA has a striking resemblance to the first leg of the 2019 rally that turned out to be a Fib retracement, that ultimately got rejected from the top of the Golden Pocket at .618 Fib. That led to a 53% correction before the Covid Crash took it down more than 70% from the .618 Fib.

crypto christmas

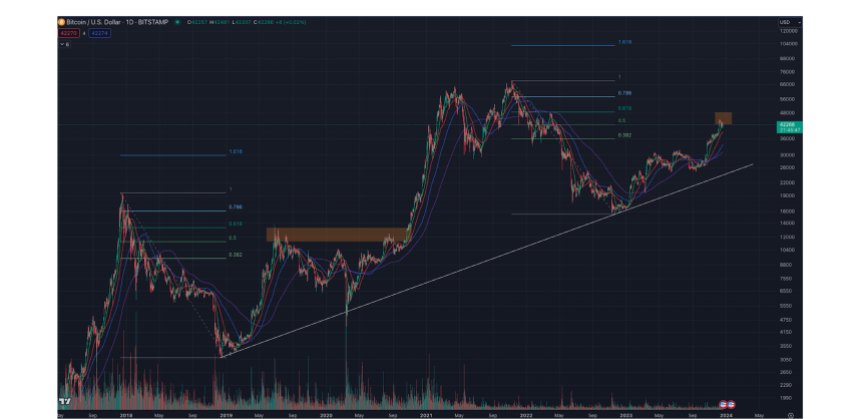
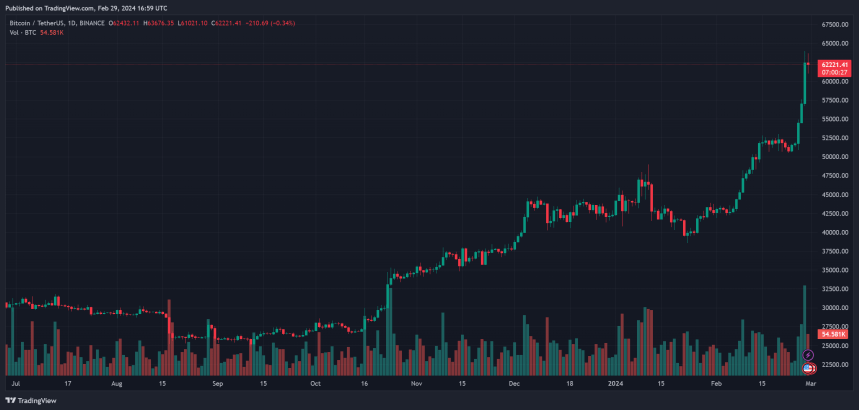
At this stage, I’d be surprised to see a downside move that deep without the aid of a Black Swan, but we are currently having some interaction with the Golden Pocket that seems familiar. While it is reasonable to expect some resistance entering and exiting the Golden Pocket, there is one very weird twist to what we are seeing and that is a strange pattern I’ve noticed occurring on or around December 17th. Every year since 2017 there has been a move on December 17th that had Macro implications. The only exception to that is last year when it happened on December 20th. On each occasion the price action led to a macro breakout or breakdown. It’s too soon to tell if this move will validate the pattern on the day of writing (Dec 19th), but on the 17th we saw BTC get rejected from the lower end of the Golden Pocket and also lose the 21-Day moving average. Price has been flirting with both of those levels ever since so we’ll have to wait to see how it plays out over time. Aside from those things I’m watching the upcoming ETF window very closely. I think that the market is numb to SEC delays on these decisions, but there is so much anticipation that this time we’ll see an approval, that a flat out rejection has the potential to be the catalyst that triggers a correction. 

Regardless of where you side on whether we are or are not in a confirmed bull market, we’re seeing a lot of evidence that if we are not in it, we’re close to it. If you’re a long term investor and you haven’t already started building a position, it’s a good time to identify some targets to start scaling into one. This of course depends on your time horizon and risk appetite, but if you have a long term outlook and 6 figure targets for BTC it’s still early enough to get in, but it’s also a good idea to save some dry powder for a correction because in my opinion, it’s not a matter of if it will come, but when.

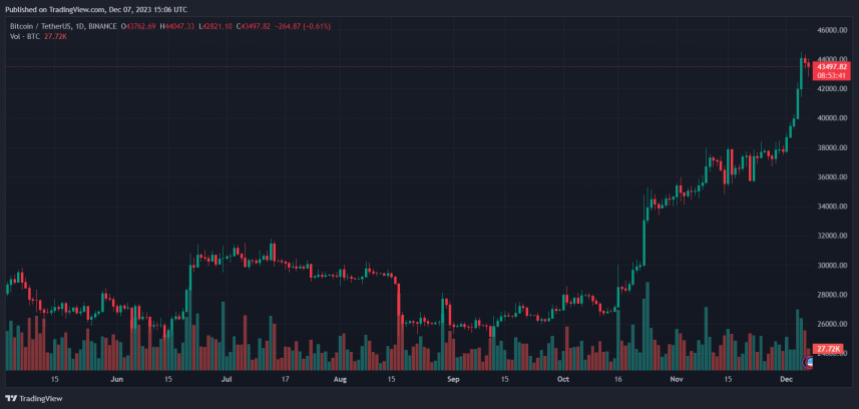
Q: Right now, we are seeing Bitcoin reach new highs. Do you think we are in the early days of a full bull run? What has changed in the market that enabled the current price action; is it the Bitcoin spot ETF or the US Fed hinting at a loser policy or the upcoming Halving? What is the big narrative that will go on in 2024?
MI:

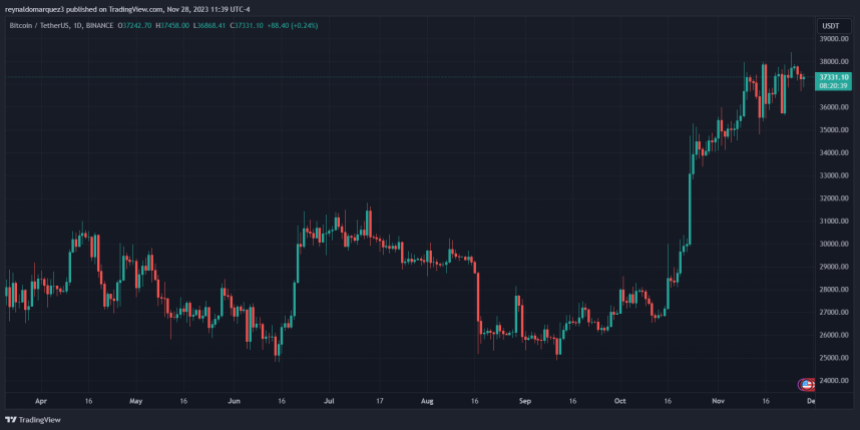
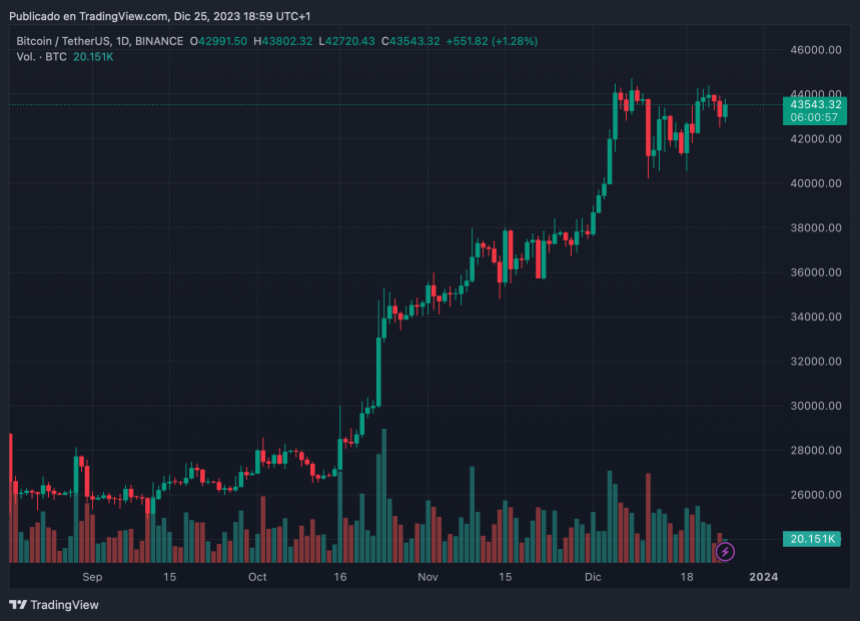
Despite the ongoing debate between bulls and bears over whether or not we’ve been in a bull market, I can say that despite the uptrend, there has been no clear confirmation that we’ve been in a bull market through most of the year. However, the fact that we’ve recently started to see more institutional sized bid ladders coming into the order book along with the on-chain data that indicates more wallets holding for longer and the recent buying after the R/S flip at $40k are indications that we may be on the verge of a breakout.

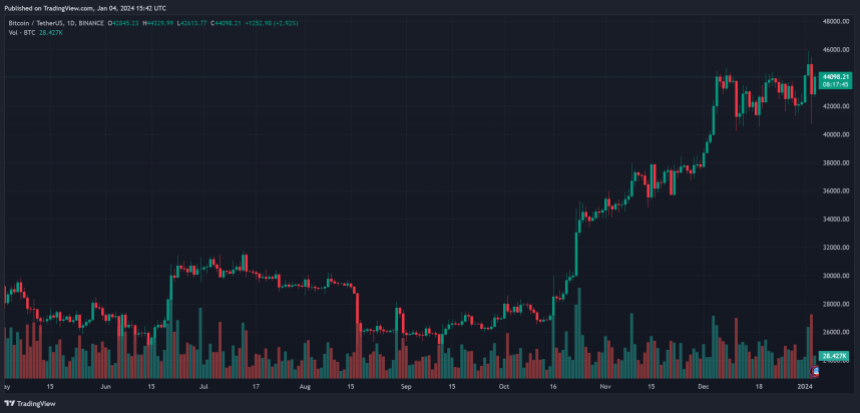
There’s no doubt in my mind that a lot of the momentum we’ve been seeing is related to the next ETF decision window opening January 5-10 and the April 2024 Halving. The FED’s recent decision to pause rate hikes and hint at a pivot to cuts in 2024 certainly added fuel to that momentum that pushed price above $40k. In typical crypto form, we also had some help in late October through early December when I noticed some familiar patterns in the order book. I can’t confirm with absolute certainty if it was the Notorious B.I.D. spoofer we saw in Q1 returned, but it was the same game I identified through Q1 being executed and there is no question that it helped push price up through the $35k – $40k range before it disappeared.

(…) As much as I’d like to see a correction come before we get there (the Bitcoin spot ETF decision), the market doesn’t care what I want. I would expect it to come before the Halving. Whether it comes before or after the ETF decision window closes remains to be seen. In the meantime, I’ll continue to watch order book and order flow data and trade what’s in front of me.

Q: Last year, we spoke about the most resilient sectors during the Crypto Winter. Which sectors and coins will likely benefit from a new Bull Run? We are seeing the Solana ecosystem bloom along with the NFT market; what trends could benefit in the coming months?

MI:

The vast majority of my focus is on Bitcoin and to be honest, after seeing so many ponzi’s in the space, it’s the only digital asset I truly trust. There are certainly some great opportunities with certain alts, but with that comes increased risk. As for sectors, it’s no secret that AI and Gaming have been hot. According to some research I’ve been reviewing Memes, DePin and GambleFi are dominant narratives right now.

The fact that Memes are more dominant than something that’s actually physical like DePin speaks to the immaturity of this market. Perhaps a better way of stating that is, “We are still early.” That said, if I’ve learned anything in crypto there is an opportunity cost associated with having high standards and principles for projects you invest in. As ridiculous as that may sound, the biggest upside potential seems to come from some of the most meaningless projects because they have large communities of “Crypto Bros” pumping them and thin liquidity makes them easy to pump. Just know that they also come with a huge risk and like every other ponzi, you don’t want to be the last guy holding the bag.

I personally tend to avoid memes for all the reasons I mentioned above, but I do trade DOGE on occasion because it’s been a relatively easy scalp lately. Elon Musk playing kingmaker with that coin doesn’t make me like it any more or less (okay maybe less), but the results have been predictable.  The fact he has obtained a money transfer license for X (Twitter) and that he has a DOGE logo on his X profile has me considering taking a flier on DOGE, but that’s not something I’m recommending to anyone who isn’t willing to lose that money. The fact he has SpaceX launching a DOGE sponsored satellite next month should at the very least bring a short term pump.

Of the leading narratives mentioned, Memes may be the most dominant, but DePin is the most interesting to me, because it’s associated with something very real and very hot right now. For those who may not be familiar, DePin stands for Decentralized Physical Infrastructure Networks which are blockchain protocols that build, maintain and operate infrastructure for the AI industry. (Do Your Own Research).

The fact that you mentioned Solana is proof that nothing changes sentiment like price. Solana has been through the ringer since falling from it’s ATH in November 2021 and the FTX crash of 2022 delivered another 80% correction that took it to single digit levels. There is no denying that it has been on an epic run recently. It’s somewhat puzzling to me how that is happening at the exact same time FTX liquidators have started the long process of distributing over $1B worth of $SOL back into the market.

Rather than speculate on what may be behind that, I’ll say that it is apparent that they have a very strong community and despite the network issues they’ve had in the past, they seem to be growing in popularity in staking pools. Then again, nothing influences sentiment like price, so I expect we’ll see a number of coins filter their way in and out of the leading narratives through the year. I’m just hoping more of them do so for legitimate reasons rather than fake news or P&D groups. IMO, until we see the projects with real teams, real use cases, real adoption and real revenue establishing themselves as the best projects to invest in for their fundamentals, “We’re still early.”

Keith Alan is President at Keith Alan Productions, Inc., Co-Founder at Blacknox, LLC and Material Indicators, LLC. Nothing written should be taken as financial advice. For more insight and analysis follow @KAProductions and @MI_Algos. Find premium tools for traders at Material Indicators.

Cover image from Unsplash, chart from Tradingview

Bitcoin Bull Run In Jeopardy? Analyst Finds Market Top Signals With BTC At $40,000

Bitcoin is walking back on some of its gains over the past few days. The number one cryptocurrency by market cap might be on the verge of a more significant retracement, which could push it back to the $30,000 zone.

As of this writing, Bitcoin (BTC) trades at $40,950 with a 2% loss in the past 24 hours. On the weekly chart, the cryptocurrency records a 3% loss, with all tokens in the top 10 by market recording a similar performance, except for Avalanche (AVAX).

Bitcoin BTC BTCUSDT Chart 1

Bitcoin Hits Local Top? Bull Run Slows Down

Over the weekend, Bitcoin was rejected from the critical resistance level at $43,500. According to a pseudonym analyst, as the BTC price dropped to its current levels, a significant player placed a “substantial resistance block.”

The chart below shows that the selling order is 1,562 BTC, or around $7 million. It also shows thick support for BTC as the bullish momentum fades.

Bitcoin BTC BTCUSDT Chart 2

In other words, Bitcoin might slow down, but the area around $40,000 could provide critical support for a potential bounce. The analyst stated on the increasing selling orders appearing on the books:

Massive resistance added on BTC Binance Spot. This is what a top looks like. A substantial resistance block of 1562 BTC has just arrived in the order books.

BTC Whales On The Move

While many believe that the market can absorb the spike in selling pressure, crypto analytics firm Material Indicators showed that Bitcoin is losing the support of major players. Over the weekend, players selling orders above $1 million “dumped” their positions.

The firm has been warning traders about this possibility by arguing that the recent bullish price action was a strategy to suck in liquidity from retail investors. Once this smaller player jumped in, whales began to “distribute” or sell their coins into the rally.

In that sense, the firm set a potential local top for BTC at $45,000. Keith Alan, one of Material Indicators senior analysts, stated the following on the current price action:

The good news is, at some point the market does flip to accumulation, and prices moving lower will get us to that point. As bad as it looks for bulls right now, I’m not expecting a straight line down. Time to exercise some patience and see how things develop from here.

Cover image from Unsplash, chart from Tradingview

Why Bitcoin’s Staggering 260% YTD Surge Could Be Just The Start

The price of Bitcoin slowed down its ascend following a week of smashing critical resistance levels. However, the rally is likely in its early stages, with BTC preparing to see further profits in the coming months.

As of this writing, the cryptocurrency trades at $43,300, reclaiming levels last seen in 2022 before the crash to its yearly lows. In the weekly chart, BTC records a 15% rally, with Ethereum following the trend while other altcoins lagged behind the two most prominent cryptocurrencies.

bitcoin chart btc btcusdt

Spot Bitcoin Jumps 15% In December, Eyes On Potential SEC Approval

The crypto market has witnessed another remarkable surge in Bitcoin (BTC), with a 15% increase in just the first week of December. According to QCP Capital’s latest market update, this growth takes BTC’s year-to-date (YTD) gain to 260%.

This exponential rise is primarily attributed to the anticipation surrounding the approval of a spot Bitcoin Exchange-Traded Fund (ETF) by the U.S. Securities and Exchange Commission (SEC).

On December 1st, the SEC announced that January 5th, 2024, will be the final deadline for rebuttal comments. This timeline sets the stage for probable approval in the week following.

Although QCP Capital humorously notes that the significance of the 15th anniversary of Bitcoin’s Genesis block on January 3rd, 2024, might be lost on the SEC, the “market has certainly taken note.”

As Bitcoin nears the $45,000 mark leading up to the expected announcement, investors are weighing how much of this news has already been priced. The post-ETF approval period will be critical, as the real impact depends on the actual flows from the ETF in its initial trading weeks. A ‘sell-the-news’ event is possible next year if expectations don’t match reality.

Asian Buyers Re-Enter Market, When Altcoin Season?

The December 1st announcement has also spurred renewed interest from Asian buyers, who had been less active in the preceding month. Notably, most of the recent spot gains have occurred during U.S. trading hours as investors in the country take positions in preparation for the SEC announcement.

Bitcoin price BTC BTCUSDT Chart 2

As the market prepares for the launch of the spot ETF, investors won’t find themselves short of options. With 13 applications for spot ETFs and several others for leveraged and options-based ETFs in the pipeline, the traditional finance ecosystem surrounding BTC (and soon ETH) is poised for significant expansion.

QCP Capital anticipates that in a market characterized by low costs and tight spreads, structured products might emerge as a key asset class for generating alpha, similar to other markets like gold. The trading desk noted:

This means that should spot BTC top on launch day itself, it will not stop the Traditional Finance ecosystem boom around BTC, and soon ETH – the likes of which we have been writing about for years now.

A report from the Glassnode co-founders indicates that the altcoin sector is already trying to catch up with the current BTC price action. The current pullback could provide an opportunity for smaller coins waiting to benefit from the bullish momentum.

Cover image from Unsplash, chart from Tradingview

Analyzing The Titans: How Bitcoin Whales Influenced The Surge To $40,000

Bitcoin and the crypto market continue to smash critical resistance levels and hit new yearly highs. The cryptocurrency stands closer to the $50,000 area as 2023 ends, and two major bullish catalyzers stand on the horizon.

As of this writing, Bitcoin (BTC) trades at $41,800 with a 6% profit in the last 24 hours. In the previous seven days, BTC recorded an impressive 13% rally as analysts and the crypto community celebrated the beginning of a new bull cycle.

Bitcoin price BTC BTCUSDT

Bitcoin Whales Behind $40,000 Rally, Are More Profits In Store?

Data provided by Ki Young Ju, CEO of crypto analysis firm CryptoQuant, indicates that Bitcoin whales have supported the current price action since August. At that time, the cryptocurrency re-took the higher area at $20,000 and stood below the critical resistance at $30,000.

As Bitcoin trended to the upside, whales took on “giga long positions” potentially in preparation for the current rally. This risk-on behavior began more discretely when BTC touched $16,000.

Young Ju tied the market activity to increased buying orders from US investors. On Coinbase, the price of Bitcoin “skyrocketed” in October 2023.

Investors in the country have been buying more of the cryptocurrency in preparation for the spot BTC Exchange Traded Fund (ETF) approval and the Halving event. The latter of this event is the reduction of the rewards for mining BTC.

Furthermore, the CryptoQuant CEO believes retail investors have yet to board the rally. As seen in the chart below, BTC’s Realized Cap stood below 0.1, indicating “low liquidity” from retail investors in the crypto market.

Bitcoin price BTC BTCUSDT Chart 2

Game Is Not Over For BTC

Additional data provided by Material Indicators confirmed the increasing buying pressure from whales. Analyst Keith Alan claimed that this behavior occurs to attract liquidity to the market.

Once liquidity, mostly from retail investors, enters the market, whales can “distribute” their coins or “dump” on retail to take profit from their position. Via his X handle, the analyst stated the following regarding BTC’s potential to continue the uptrend:

(…) because we now have ~$86M in near range #BTC bid liquidity, I’m considering buying this pullback because it doesn’t appear the game is over yet.

Cover image from Unsplash,chart from Tradingview

Unlocking Bitcoin ETF Profits: Experts Reveals “Best” Trading Strategy

The potential approval of a Bitcoin ETF (Exchange Traded Fund) is bound to open new opportunities for traders. The expectations surrounding this event impact the market now, but an expert believes they will have a more substantial effect in the coming months. 

As of this writing, Bitcoin trades at $37,400 with a 1% profit in the last 24 hours. Over the previous week, the cryptocurrency stayed in the green with a 3% profit, holding the critical level of $37,000 despite the increase in selling pressure.

Bitcoin ETF BTC BTCUSDT

The Lucrative Strategy In Anticipation Of Bitcoin ETF Approval

As Bitcoin’s value soars with a remarkable 125% increase this year, a new trading strategy emerges, promising high returns in the wake of the anticipated Bitcoin ETF. A seasoned market analyst, Markus Thielen, unveils insights into leveraging the evolving crypto market dynamics for profitable trading in an essay posted by options platform Deribit.

Thielen’s analysis reveals an “unusual” trend in the Bitcoin market: despite its significant rally, the 30-day realized volatility remains at a modest 41%, starkly contrasting to the 5-year average of 63%.

According to the analyst, this subdued volatility reflects a declining interest in leveraged Bitcoin options, a direct consequence of institutional players entering the crypto arena.

These players, holding significant Bitcoin assets, will likely sell volatility, fostering a more stable market environment that mirrors traditional financial markets.

In this landscape, the strategy of selling strangles (120% call and 80% put) on a 30-day rolling basis stands out. According to Thielen, this approach has shown profitability in approximately 23% of cases over the past year, as seen in the chart below, marking a significant improvement from the decentralized finance (DeFi) summer’s high-risk profile.

chart 2 Bitcoin ETF BTC BTCUSDT

At that time, DeFi protocols attracted billions in capital to the crypto ecosystem contributing to the incipient Bitcoin rally. While there are differences in the current market dynamics, options players are likely to benefit from this strategy.

This strategy, particularly effective during low-risk periods, suggests a window of opportunity for traders to capitalize on before introducing institutional influence.

Institutional Involvement Expected to Stabilize Bitcoin Market

The anticipated launch of the Bitcoin ETF is set to transform the market further. This event is expected to recalibrate the put/call ratio, which leans heavily toward calls.

Thielen compares it to the S&P 500, where the put/call ratio has been more balanced. The Bitcoin market might soon witness a similar equilibrium, presenting an opportunity for traders to harness volatility through a sell-put strategy.

Furthermore, Thielen notes that the post-ETF approval phase could be the last chance for traders to exploit high volatility levels. Once institutional players begin systematically selling volatility, the market is expected to enter a phase of reduced price fluctuations, making volatility-based strategies less effective.

The analysis also touches upon Bitcoin’s correlation with broader market indicators like the VIX index. While the Bitcoin market has maintained high volatility relative to the VIX index, this gap is anticipated to narrow, offering traders a strategic edge in timing their trades effectively.

In conclusion, as the Bitcoin ETF approaches and institutional participation increases, savvy traders can look towards selling strangles as a strategic approach to capitalize on the current market conditions.

Cover image from Unsplash, chart from Deribit and Tradingview

Is $40,000 Next? Unpacking 4 Reasons Behind Bitcoin’s Emerging Rally

The Bitcoin price rally is losing strength as the cryptocurrency returns to its support levels following weeks of bullish momentum. In the short term, the landscape seems sloped to the downside, but an analyst presented the main reasons why the rally has just begun.

As of this writing, Bitcoin (BTC) trades at $36,550 with a 2% loss in the last 24 hours. Over the previous week, the cryptocurrency recorded similar losses following the general sentiment in the market. Only Solana (SOL) preserved its gains during the same period.

Bitcoin BTC BTCUSDT

Behind Bitcoin’s Surge: Decoding the Four Key Factors

According to a report from Deribit Insight, posted by Markus Thielen, several forces are pushing Bitcoin towards new yearly highs. These forces remain intact despite the recent price action.

Among the reasons behind the current BTC price rally, the analyst included speculations around the U.S. Securities And Exchange Commission (SEC) Bitcoin Exchange Traded Fund decision, traders’ appetite for leverage, fiat inflows through stablecoins, and increased fee generation within the Bitcoin network.

SEC’s Decision On The Bitcoin ETFs

A significant driver is the anticipation surrounding the SEC’s approval of a spot Bitcoin ETF. Despite passing the second deadline in mid-October without any announcement, the market remains watchful, with the third deadline set for mid-January 2024. The uncertainty surrounding this decision has led to fluctuations in implied volatility, influencing Bitcoin’s value.

Leveraged Positions and Futures Market

The demand for leveraged positions in Bitcoin, primarily through perpetual futures markets, indicates a strong interest in trading the BTC/USDT pair. This was evident when the funding premium reached an annualized +28% on November 13.

In addition, the BTC options market saw an uptick in realized volatility. The increase in the metric signals risk appetite for investors.

The chart below shows that the metric approaches its 5-year average. However, the analyst believes that volatility should decline as the year ends, suggesting that Bitcoin will follow a sideways trajectory in the short term.

Bitcoin price BTC BTCUSDT options crypto
Influx of Fiat Via Stablecoins

Another crucial aspect is the substantial fiat inflow into cryptocurrencies, mainly through Tether’s USDT, indicating fresh capital entering the crypto space. With over $3.8 billion moving into crypto in the last 30 days, this influx has had a notable impact, especially on altcoins, reflecting growing investor confidence.

Increased Bitcoin Network Activity

The Bitcoin network’s fee generation signals heightened activity, reaching $54 million. The report claims that this growth in network usage, partly driven by the resurgence of Ordinals and support from major exchanges, underscores the fundamental strength of the Bitcoin ecosystem.

Despite these positive indicators, the absence of an SEC Bitcoin ETF approval and a reduction in leveraged long positions might prevent Bitcoin from soaring past the $40,000 mark. However, the ongoing solid fiat inflows and a robust, fee-generating Bitcoin network provide grounds for cautious optimism.

Bitcoin’s journey remains captivating as it navigates regulatory decisions, market strategies, and evolving investor sentiment.

Cover image from Unsplash, chart from Tradingview

Why $36,300 Is the Key For Bitcoin’s Next Big Bounce: Insights From Liquidity Map

The Bitcoin price returned to its sideways price action following a powerful surge into new yearly highs. The cryptocurrency seems poised for further gains if bulls can hold a critical level.

As of this writing, BTC trades at $36,370, with a 2% loss in the last 24 hours. Over the previous week, the number one crypto by market capitalization recorded a 5% gain, while the sentiment in the sector looks mixed, with BTC recording losses as Ethereum and Solana stayed strong in the same period.

Bitcoin price BTC BTCUSDT

Bitcoin Likely To Bounce If This Scenario Plays Out

According to a pseudonym analyst, the liquidity in the Bitcoin spot market, measured by a “Liquidity Map,” has been allocated to the downside. This metric gauges the amount of leverage in the BTC/USDT trading pair.

The chart below shows that BTC is trading close to a huge liquidation cluster. Overleverage positions create these levels and are often tapped by big players to exploit the liquidity.

BTC whales chase liquidity, moving prices towards the biggest pools of overleveraged positions. If the $36,300 gets tapped, the next level of interest is located to the upside between $36,961 and $37,700. The analyst stated:

Big clusters at $36K and ~$37K. Would expect there to be quite some positions build up around that 37K region mainly as we chopped around it all day yesterday. Bears are back in control on the LTF (Low Timeframe) below $36.3K I’d say.

Bitcoin BTC BTCUSDT BTC price Bitcoin price chart 2

BTC Hits Local Top?

On the other hand, the Bitcoin price could trend sideways between $36,300 and the high of its current range. Additional data from crypto analytics firm Bitfinex Alpha indicates that historical data hints at bad news for optimistic traders.

The firm advises caution for traders as the liquidity gap in the Bitcoin spot market increases. Per recent data, BTC Short-Term Holders Realized Price (STH RP) bought the cryptocurrency at an average price of $30,380, which could incentivize these investors to take profit at current levels.

This is the first time STH has had an opportunity to make a big profit on their BTC holdings since April 2022 and December 2022. Historically, a monthly change in STH RP exceeding $2,000 often signals local peaks, particularly post-recovery in bear markets, as seen in the chart below.

Bitcoin price BTC BTCUSDT chart 3

Concurrently, a negative monthly shift in LTH RP usually implies long-term holders are offloading their Bitcoin. The convergence of a $2,000 increase in monthly STH RP and a decline in LTH RP suggests a high likelihood of a local peak in Bitcoin’s price.

Cover image from Unsplash, chart from Tradingview

From $35,000 To $500,000? The Bitcoin Rollercoaster This Expert Sees Ahead

Stephan Livera, an esteemed host of his namesake podcast and Swan Bitcoin’s Head of Education, has now provided the crypto community with projections for Bitcoin’s future trajectory. This week, Bitcoin experienced a rally that took its price to as high as $35,000, marking its highest point since May 2022.

However, amid the favorable climate around a potential spot Bitcoin exchange-traded fund (ETF) approval and institutional adoption, Livera posits that this surge is merely the precursor to a much grander bull run.

The Potential Impetus: A Spot Bitcoin ETF

Approval of a spot Bitcoin ETF could be a game-changer for Bitcoin’s valuation, according to Livera. Conversing with Michelle Makori, the Lead Anchor and Editor-in-Chief at Kitco News, during the Pacific Bitcoin Festival, Livera emphasized the possible ripple effects of such an approval.

While murmurs suggest that ETF approval might be on the horizon by the close of this year, Livera diverges from this sentiment. Livera anticipates this landmark event to materialize more likely in 2024. The Head of Education at Swan Bitcoin noted:

Although many experts predict that [a spot Bitcoin ETF] will come in three to six months, I don’t believe it will happen this year. Next year is the more likely scenario … in the first or second quarter of 2024, which would coincide with the halving cycle, which is expected in April.

Notably, a significant event, such as the halving cycle, will impact Bitcoin’s market dynamics. Historically, this event – which slices the miners’ reward for new block addition to the Bitcoin blockchain by half – has spurred price shifts.

The upcoming cycle will set the block reward at 3.125 BTC. This, combined with the potential spot ETF approval, could catalyze a heightened interest and influx of investments into Bitcoin, according to Livera.

Projected Peaks And Troughs: The BTC Landscape

Livera offers a roadmap of Bitcoin’s possible pricing journey. The Swan Bitcoin’s Head of Education foresees a stabilization around the $30,000 mark shortly, with a potential escalation toward $40,000 as we approach next year’s halving event.

But the real fireworks might commence after the halving, ushering in a wild bull run. Expounding on historical trends, Livera shared:

Historically, what we’ve seen around the halving is a bit of a rise into the halving, then a bit of a selloff after. Six to 12 months out, that’s when the real crazy bull run happens, and you get 10x or 20x in the Bitcoin price at that point.

This extrapolation by Livera culminates in a noteworthy prediction for the end of 2024 – a bold ascent, perhaps reaching roughly $500,000 by 2025 or early 2026, according to the expert.

However, the climb might be coupled with a steep decline. Drawing parallels to gold, Livera posits Bitcoin could potentially mimic its valuation range. Livera added, emphasizing the volatility of the crypto domain:

It’s quite possible that Bitcoin comes close to the range of gold, and that would imply a price in the $500k range. As is a tradition in this industry, we’ll probably hit that as a blow-off top, followed by a drop of 80%. So, it might go to $500k and then crash to $100k.

Bitcoin (BTC) price chart on TradingView

Featured image from Unsplash, Chart from TradingView

Bitcoin Price: Why $28,000 Could Hold The Key For Massive Bull Run

The Bitcoin price experienced volatility in the last day following speculation about approving a spot BTC Exchange Traded Fund (ETF) in the US. The rumors turned out false, but the cryptocurrency managed to reclaim a critical level.

As of this writing, Bitcoin trades at $28,460 with a 3% profit in the last 24 hours. Over the previous week, the cryptocurrency recorded similar gains while other cryptocurrencies in the top 10 by market cap lagged the sudden rally except for Solana (SOL).

Bitcoin price BTC BTCUSDT

Bitcoin Price Confirms Bull Run?

Data shared by the co-founders of analytics firm Glassnode highlights the importance of the recent rally. However, driven by what many in the crypto community called “fake news,” the upside momentum cleared some obstacles for the cryptocurrency.

In that sense, the data points to a generally positive sentiment around the Bitcoin ETF, which will continue to gain relevance in the coming months as uncertainty about its approval mitigates. The Glassnode co-founders stated via social media platform X:

While this pivotal milestone was momentarily attained on futures, the spot market price peaked at $27.98k earlier today. It’s evident just how crucial this price point is in the larger scheme (…). The rapid movements and these price thresholds aren’t just numbers. They signify investor sentiment, market dynamics.

The market activity surrounding the ETF rumors on some major crypto exchanges represented around 8% of their total trading volume. However, Bitcoin must hold its current level on the daily and weekly charts.

A separate analysis by a pseudonym trader claims that the recent Bitcoin price action broke out of a macro downtrend. As seen in the chart below, every time the cryptocurrency price breaks this trend, Bitcoin consolidates for a while before re-entering price discovery.

Despite the bullish momentum, Bitcoin can still touch critical support levels around $27,880 and $27,550 on short timeframes before resuming the rally. The Bitcoin price can go much lower on higher timeframes while maintaining its bullish structure. The analyst stated:

Bitcoin has long ago broken its Macro Downtrend. It’s undeniable that Bitcoin is in a Bull Market. The question is whether Bitcoin can perform a -30% retrace over the next 4-6 months or so. History suggests it can.

Bitcoin price BTC BTCUSDT

Cover image from Unsplash, chart from Tradingview

Bitcoin News: Here Is When BTC Could Revisit $20,000 One Last Time, Analyst Says

Based on several factors, the latest Bitcoin news points to a potential bullish continuation in the long term. However, the short term remains uncertain; the cryptocurrency continues to trade in a tight range, although BTC has shown a spike in volatility.

As of this writing, the Bitcoin price trades at $25,500 with a 2% loss in the last 24 hours. In the previous seven days, the cryptocurrency maintained some of its profits as most of the tokens in the top 10 by market cap traded in the red after experiencing a slight uptick.

Bitcoin news BTC BTCUSDT

Bitcoin News: BTC At Risk Of Topping For Remaining Of The Year

The bigger picture for Bitcoin leans to the upside with the approval of a BTC spot Exchange Traded Fund (ETF) in the US gaining momentum. However, analyst Rekt Capital believes current prices are similar to those in late 2019 and early 2020.

As the chart below shows, at that time, the price of Bitcoin was trending to the upside in a tight triangle with a top at around $10,000. The cryptocurrency eventually broke about this resistance and entered uncharted territory.

Bitcoin News BTC BTCUSDT BTC Price

As the chart shows, this scenario has some obstacles for optimistic investors. Before the breakout, the price of Bitcoin revisited the lows and event wicked below critical support at $3,250.

The analyst believes that BTC could display similar price action as it approaches the top of its current channel. In this scenario, which aligns with BTC’s pre-halving behavior, the cryptocurrency could re-visit the low of the trend.

As a result, a return to $20,000 and even the $15,000 lows seems likely. The analyst stated:

Here’s the thing about current prices. Right now, there’s a risk of them representing the Top for 2023. But after the Halving, these same exact prices will represent a Re-Accumulation range (red) before lift-off into a Parabolic Uptrend (green).

Still Hope For BTC Price Bulls

As mentioned, this scenario could hint at short-term losses for BTC, but the analyst shared other Bitcoin news in a more positive tone. First, Rekt Capital believes that the next 6 months into the Bitcoin halving could provide the “last ever retrace” to the $20,000 lows.

As the market approaches this event, the price of Bitcoin is more likely to trend upwards, with a “stronger” beat back to previous highs and potentially into uncharted territory. The analyst concluded:

Next ~6 months may offer the last ever retrace to low $20,000s (orange) And 2 months Pre-Halving, we’ll likely see some stronger upside volatility (light blue) Lots of volatility to both the downside & upside await between now and the Halving.

Cover image from Unsplash, chart from Tradingview

Good Bitcoin News: Supply Keeps Falling To Lowest Since 2018 As Whales Keep Buying

Bitcoin news for traders and investors is showing positive signs as the cryptocurrency managed to stay above critical levels. The current trading environment remains uncertain as sideways price action persists, but new data points to potential gains.

As of this writing, Bitcoin trades at $27,700 with sideways movement in the last 24 hours. On higher timeframes, the cryptocurrency records profits; the previous week, BTC experienced a 4.4% rally, according to data from Coingecko.

Bitcoin price BTC BTCUSDT

Bitcoin News And Data Point To Favorable Price Action?

A report from Bitfinex Alpha indicates that the current Bitcoin supply on exchanges has been dropping since May 2023. This metric stands at its lowest in five years, or since 2018, when the price of Bitcoin was in the early stages of a new investment cycle.

The report indicates around 2.03 million BTC on crypto trading venues, as seen in the image below. The decline of BTC supply in the market represents good Bitcoin news due to its potential to ignite another bull market. The report claims:

As the bull market began to take off, reserves on exchanges dropped, as crypto prices soared. This seemed to imply that as investors moved their Bitcoin off exchanges, its scarcity on the platform might have driven its price up.

Bitcoin News BTC price BTCUSDT

The chart above also shows that the cryptocurrency’s price reacts to spikes in BTC supply on crypto exchanges. Each bull market has its peculiarities, but they all need a decline in supply to enter price discovery.

Moreover, the report points out that a minority of long-term investors capitulated during this crypto winter. These investors continue to hold their coins and exert a more significant influence on the supply/demand dynamics as short-term investors get shaken off the market.

Less Selling Pressure For Bitcoin

The status quo in the Bitcoin market continues to evolve, and recent data points to a potential change in short-term holders. The Coin Days Destroyed (CDD) metric, used to measure supply/demand dynamics, indicates that both long-term and short-term holders are more inclined to hold “their Bitcoin holdings for longer periods of time.”

Furthermore, the new market dynamics hint at the formation of the early stages of a bull market. The report stated:

The 12-18 month supply holders are now in a position to make a profit on some of their holdings. While this is normal for early bull markets, it is key to note that long term holder supply remains inactive and even short-term holder supply that has been acquired mostly during the bear market at sub $20,000 price or even early 2023 at slightly higher prices remains inactive. This shows investor confidence across multiple cohorts (…).

Cover image from Unsplash, chart from Tradingview