Bitcoin Traders Spread “Buy The Dip” As Bitcoin Plunges Below $66,000

Data shows “buy the dip” calls for Bitcoin have spiked around social media following the plummet the asset has seen below the $66,000 level.

Bitcoin Social Volume For Terms Related To Buy The Dip Has Shot Up

According to data from the analytics firm Santiment, Bitcoin investors have more heavily reacted with bullish calls than bearish ones despite the sharp decline the asset has observed.

The indicator of relevance here is the “Social Volume,” which tells us about the amount of discussion a given topic or term is receiving on the major social media platforms right now.

This metric works by going through the various posts/threads/messages on these websites to check for mentions of the topic. The indicator, however, doesn’t outright count up these mentions but rather the number of posts that contain at least one mention.

This is naturally due to the fact that a high mention count alone can’t be a reliable indication of whether social media users as a whole are talking about the topic, since talk being limited to just a few threads can also lead to a spike in this count.

In the context of the current discussion, Santiment has filtered the Social Volume for bullish and bearish keywords to find how the two sentiments compare currently.

The below chart shows the trend in the metric for these terms since the start of the year 2024:

Bitcoin Social Volume

For pinpointing bullish sentiment, the analytics firm has made use of terms such as “buy” or “bullish.” Similarly, “sell” or “bearish” are among the keywords for the opposite sentiment.

From the graph, it’s visible that the Social Volume for the former type of terms has exploded following the latest plunge in the Bitcoin price, suggesting that social media users are looking at the drawdown as an opportunity to buy more.

The bearish Social Volume has also seen an uplift, but its peak has only been half as high as one of the bullish terms. While the investors being bullish may sound optimistic at first, the fact is that this has actually not been ideal for rebounds to take place in the past.

As Santiment notes:

Historically, the best dip buy opportunities occur when the crowd consensus is showing a bit of fear toward a further drop. This usually results in small wallets dropping their bags for whales and sharks to scoop them up.

As such, the current market enthusiasm may actually be counterproductive for the chances of a bottom to form. According to the analytics firm, the real “buy the dip” for Bitcoin opportunity may present itself once the red sentiment has caught up to the blue one.

BTC Price

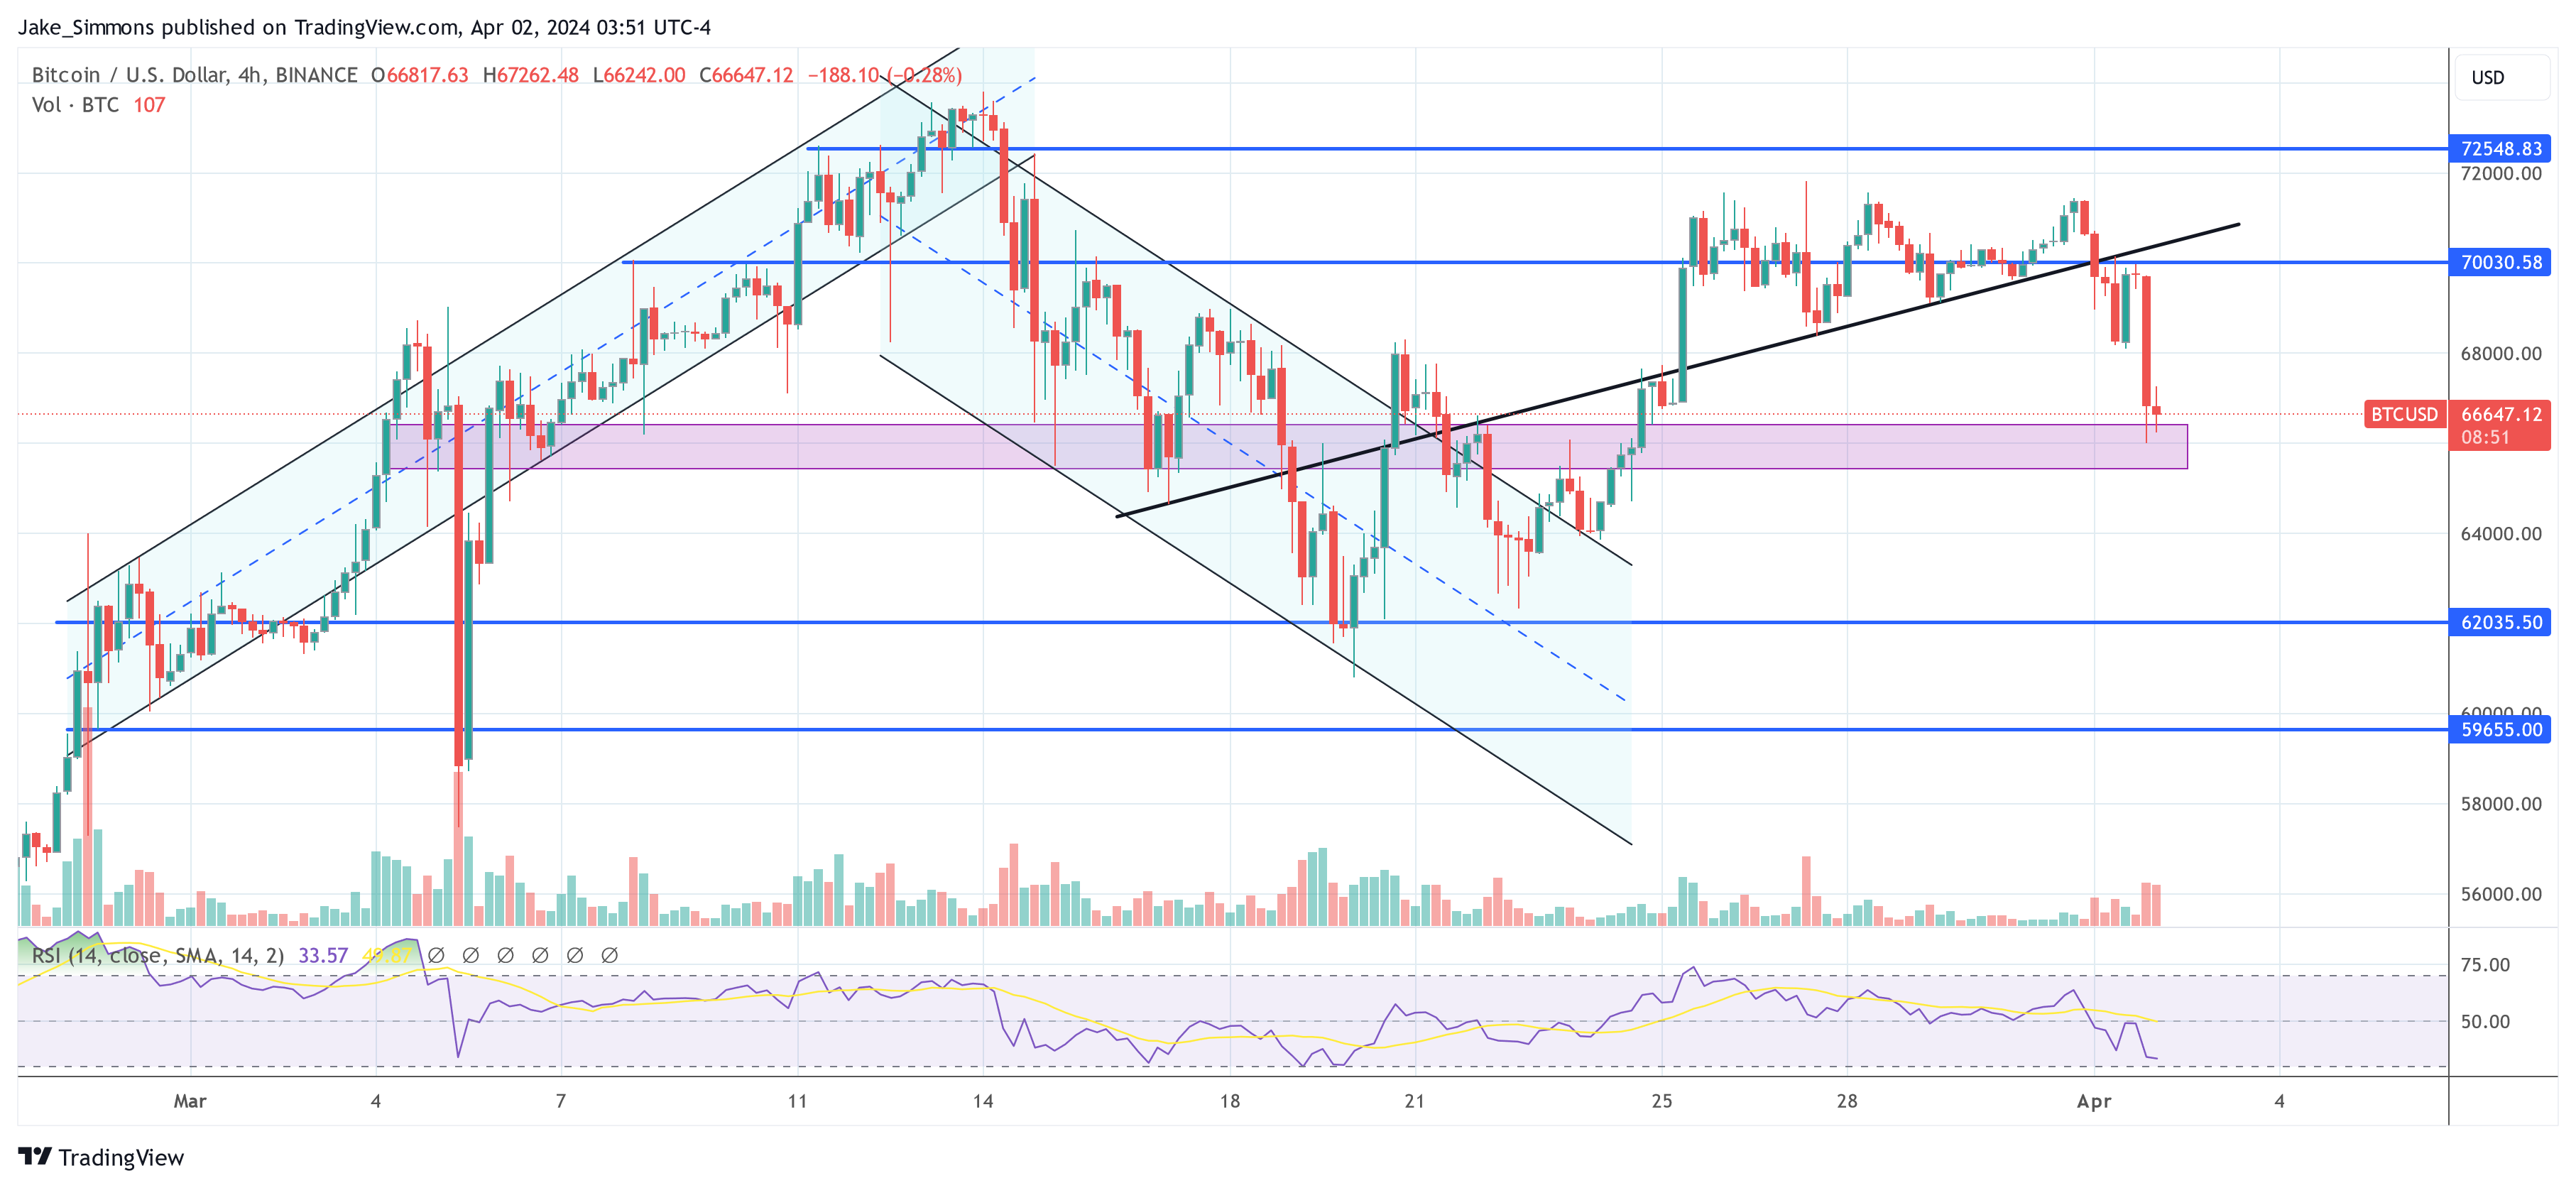
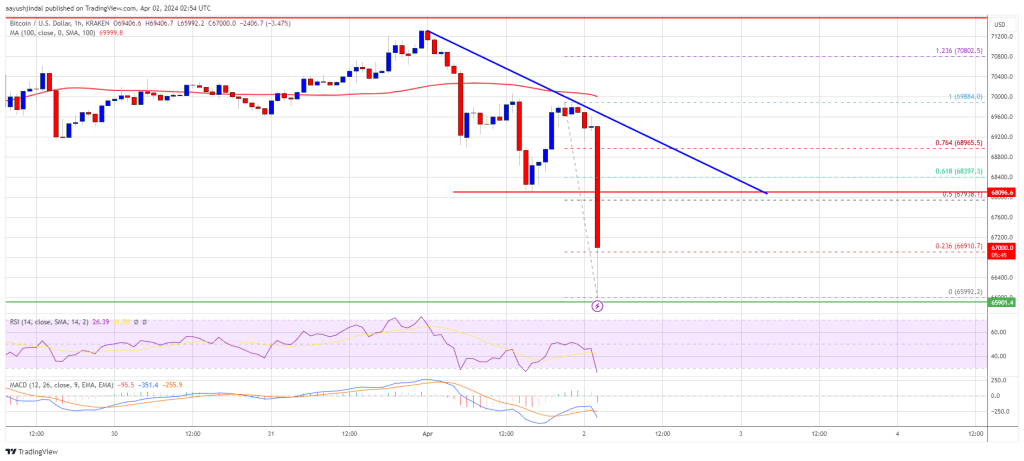
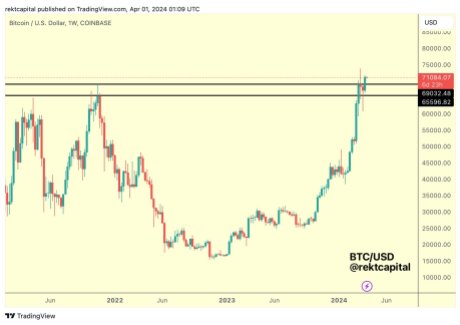
At the time of writing, Bitcoin is floating around $65,700, down more than 7% in the past week.
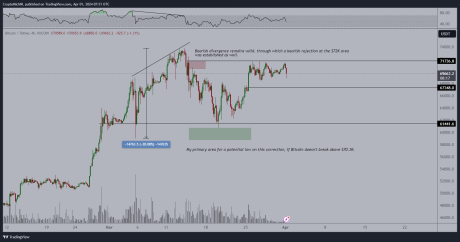
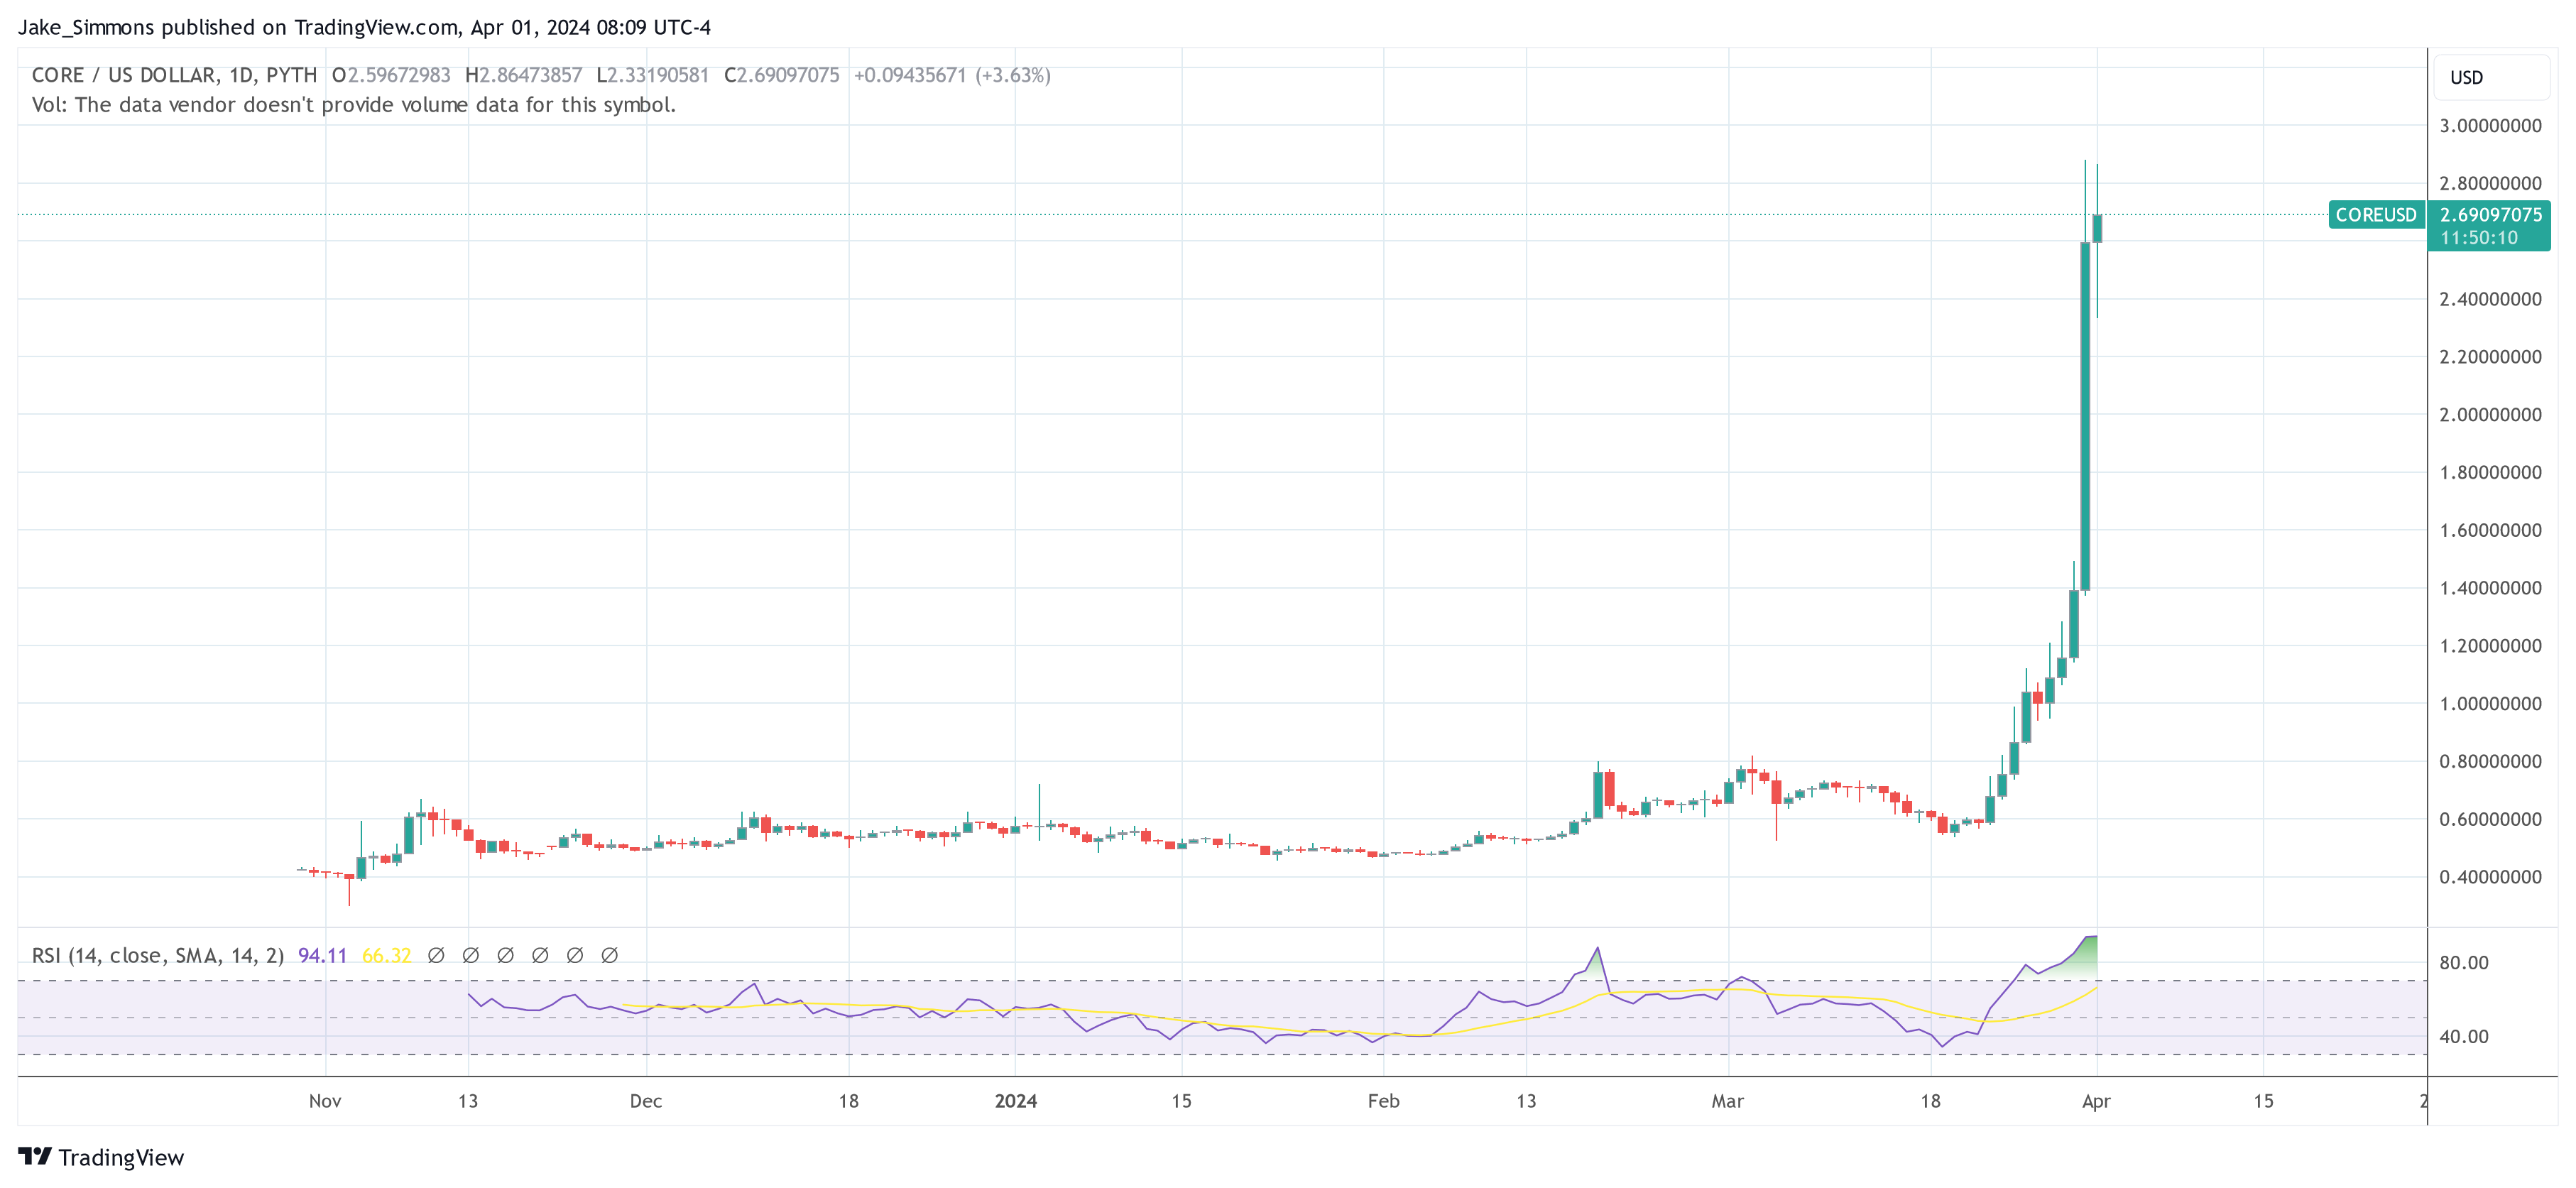
Bitcoin Price Chart

Bitcoin Final Dance: Analyst Eyes Final Peak Ahead Of Halving

Once again, there is hope for Bitcoin (BTC) as Michael Van De Poppe, a cryptocurrency expert, has spotlighted the potential for the crypto asset’s price to reach a new all-time high before the highly anticipated Halving event commences.

One Final All-Time High For Bitcoin Before Halving

The price of Bitcoin is presently exhibiting new bearish activity, which might trigger negative sentiments in the market over the next few days. Despite the notable decline, Michael Van De Poppe is optimistic that BTC will attain a new height prior to Bitcoin Halving expected to occur this month’s end.

According to the analyst, the digital asset is currently in a consolidation zone. He further identified two distinct crucial levels within the lower timeframes such as the $67,000 threshold as a support level and the $71,700 mark as a final break out towards the peak.

It is worth noting that Michael Van De Poppe previously forecasted that Tuesday is probably when the real moves are expected to begin as Bitcoin consolidates. Thus, if the coin holds the $67,000 level, he will propose a one-last peak test ahead of the halving.

Bitcoin

Poppe seems to be confident about his prediction now as he asserts that if one of the two aforementioned crucial levels develops, it will determine the direction of Bitcoin. Due to this, he believes BTC will experience one final pre-halving all-time high.

The post read:

Bitcoin is calmly consolidating. Crucial levels (lower timeframes): $67,000 to hold for support, $71,700 for a final breakout towards the ATH. If either of the two happens, probably direction is chosen. I think we will have one final ATH test before halving happens.

Following the recent decline, Poppe has issued a warning to the crypto community on how to interact with the price action. “You do not want to chase those massive green candles,” he stated.

He advocates entering the market when BTC‘s price is down by 15% to 40%. Additionally, he addressed those considering investing in altcoins, urging them to invest when altcoins are down by 25% to 60%.

Possible Triggers For The Correction

As of press time, Bitcoin’s price is trading at $65,843, demonstrating a decline of over 5% in the daily timeframe. Its trading volume has seen a significant uptick of 66% in the past day, while its market cap has decreased by 5%.

Since its peak of $73,000, achieved in early March, the price of Bitcoin has dropped by nearly 10%. One factor considered to have contributed to the retracement was the influx of funds into US Spot Bitcoin Exchange-Traded funds (ETFs), which has since started to calm down gradually.

Data from Wu Blockchain revealed that the products saw an overall net outflow of $85.84 million on Monday. BlackRock ETF IBIT recorded a net inflow of $165 million, while Grayscale ETF GBTC experienced a single-day net outflow of $302 million. Presently, the historical cumulative net inflow for the BTC spot ETFs is pegged at $12.04 billion.

Bitcoin

Tether Buys 8,888 Bitcoin For $618 Million, But Why Is Price Down?

On-chain data shows that the world’s largest stablecoin issuer, Tether, recently added more Bitcoin to its holdings. The magnitude of the purchase has caused the crypto community to speculate on why Bitcoin’s price has dipped instead when such a development is usually bullish for the crypto token. 

Tether Acquires 8,888 BTC

Data from the blockchain analysis platform Arkham Intelligence shows that Tether acquired 8,888 Bitcoin on March 31, and the stablecoin issuer now holds almost 75,400 BTC. With its BTC holding, Tether now ranks as one of the largest Bitcoin holders, even having more BTC than some of the most prominent crypto exchanges and Spot Bitcoin ETF issuers.

Last year, the stablecoin issuer announced its plan to regularly purchase Bitcoin for its stablecoin reserves using part of the profits realized from its operations. Therefore, it is no surprise that the company has been able to acquire this amount of BTC since then, especially with the success they have attained recently. 

However, what is surprising is that Bitcoin has since dropped below $70,000 following this development. Usually, a Bitcoin purchase of such size should positively impact Bitcoin’s price and not cause a price dip like the one currently experienced. However, there is reason to believe other factors have overshadowed Tether’s purchase and caused Bitcoin to see such a sharp correction

Why The Bitcoin Price Is Down

Crypto trading firm QCP Capital recently provided insights into why Bitcoin’s price broke below $70,000 and dropped to as low as $66,000. The firm claimed that the sharp move to the downside was due to the “large liquidations on retail-heavy exchanges like Binance, which saw perp funding rates go from as high as 77% to flat.”

The Spot Bitcoin ETFs, specifically Grayscale’s GBTC, also look to have contributed to Bitcoin’s decline as Grayscale continues to experience significant outflows from its fund. On April 1, GBTC saw an outflow of $302.6 million, mainly contributing to the combined net outflows of $85.7 million recorded by these Bitcoin ETFs.This has brought about more selling pressure on Bitcoin, which is currently overwhelming the buying pressure in the ecosystem. 

Activity in the derivatives market has also played a part in the bearish market sentiment, with the bears looking firmly in control. Data from Coinglass shows that $409 million has been liquidated from the market in the last 24 hours, with $328 million in long positions being wiped out during this period. 

At the time of writing, Bitcoin is trading at around $66,500, down over 4% in the last 24 hours, according to data from CoinMarketCap.

Bitcoin price chart from Tradingview.com

Bitcoin Price Tumbles Below $66,000: 4 Major Reasons

The Bitcoin market has witnessed a significant downturn, with prices plummeting below the $66,000 mark. This abrupt -5.6% price movement can be attributed to four major factors: a long liquidation event, a rising US Dollar Index (DXY), profit-taking by investors, and spot Bitcoin ETF outflows.

#1 Long Liquidations

The main force leading to today’s downturn in Bitcoin’s price was a significant deleveraging event characterized by an unusually high level of long liquidations. Before the downturn, Bitcoin’s Open Interest (OI) Weighted Funding Rate was unusually high, indicating that leveraged traders were paying premiums to maintain long positions in anticipation of future price increases. This optimism, however, made the market vulnerable to sudden corrections.

Crypto analyst Ted, known as @tedtalksmacro on X (formerly Twitter), remarked, “Today was the largest long liquidation event since the 19th March.” He further elaborated on the effects of this correction by noting, “Nice reset in overall positioning today, even on just a 5% drop lower for Bitcoin… Next leg higher is loading I think.” This comment highlights the severity of the liquidations and suggests a potential rebound or restructuring within the market as it stabilizes.

Bitcoin Open Interest (OI) Weighted Funding Rate

Coinglass data reveals that over the last 24 hours, 120,569 traders were liquidated, amounting to $395.53 million in total liquidations, with $311.97 million being long positions. Bitcoin-specific long liquidations were at $87.42 million.

#2 DXY Puts Pressure On Bitcoin

With 105.037, the DXY closed at its highest level since November yesterday, evidencing a strengthening US dollar. Given Bitcoin’s inverse correlation with the DXY, the stronger dollar might have shifted investor preference towards safer assets, moving away from riskier investments like Bitcoin.

This correlation stems from the global market’s risk sentiment, where a rising DXY often signals a shift towards safer investments, detracting from riskier assets like Bitcoin. However, analyst Coosh Alemzadeh provided a counter perspective, suggesting through a Wyckoff redistribution schema that despite the DXY’s recent uptick, the next move could favor risk assets, potentially including Bitcoin.

#3 Profit Taking By Investors

Profit-taking by investors has also played a significant role in the recent price adjustments. The Bitcoin on-chain analysis platform Checkonchain reported a spike in profit-taking activities.

Glassnode’s lead on-chain analyst, Checkmatey, shared insights via X, stating, “The classic Bitcoin MVRV Ratio hits conditions we characterize as ‘heated, but not yet overcooked’. MVRV = above +0.5sd but below +1sd. This indicates that the average BTC holder is sitting on a significant unrealized profit, prompting an uptick in spending.”

Bitcoin MVRV Ratio

The profit-taking coincided with Bitcoin reaching a peak of $73,000, marking a cycle high in profit realization with over 352,000 BTC sold for profit. This selling behavior is typical in bull markets but plays a crucial role in creating resistance levels at local price tops.

#4 Bitcoin ETF Outflows

Lastly, the market witnessed notable outflows from Bitcoin ETFs, marking a reversal from last week’s substantial inflows. The total outflows amounted to $85.7 million in a single day, with Grayscale’s GBTC experiencing the most significant withdrawal of $302 million.

Meanwhile, Blackrock’s IBIT and Fidelity’s FBTC reported positive inflows, totaling $165.9 million and $44 million, respectively. Commenting on this, WhalePanda remarked, “Overall negative day but not as negative as the price implied. Closing of Q1 so taking profit here makes sense. Some fuckery around [the] new quarter and halving is to be expected.”

At press time, BTC traded at $66,647.

Bitcoin price

Bitcoin Price Dumped To $66K As Bears Gain Strength, $64K Next?

Bitcoin price started another decline from the $70,000 resistance zone. BTC is down over 5% and there was a move below the $67,500 support.

  • Bitcoin price is gaining bearish momentum from the $70,000 resistance zone.
  • The price is trading below $68,500 and the 100 hourly Simple moving average.
  • There is a key bearish trend line forming with resistance near $68,400 on the hourly chart of the BTC/USD pair (data feed from Kraken).
  • The pair could extend its decline toward the $64,000 support zone in the near term.

Bitcoin Price Turns Red

Bitcoin price struggled to settle above the $70,000 resistance zone. BTC reacted to the downside after it broke the $69,200 support zone. There was a sharp move below the $68,500 level.

The price even declined below the $67,000 level. Finally, it tested the $66,000 with a bearish angle. A low was formed near $65,992 and the price is now attempting a recovery wave. There was a move above the $66,800 level.

The price moved above the 23.6% Fib retracement level of the downward move from the $69,884 swing high to the $65,992 low. However, Bitcoin is now trading below $68,500 and the 100 hourly Simple moving average. There is also a key bearish trend line forming with resistance near $68,400 on the hourly chart of the BTC/USD.

Immediate resistance is near the $68,000 level. It is close to the 50% Fib retracement level of the downward move from the $69,884 swing high to the $65,992 low. The first major resistance could be $68,500 and the trend line. If there is a clear move above the $68,500 resistance zone, the price could start a fresh increase.

Bitcoin Price

Source: BTCUSD on TradingView.com

In the stated case, the price could rise toward the $70,000 resistance zone in the near term. The next major resistance is near the $71,500 zone.

More Losses In BTC?

If Bitcoin fails to rise above the $68,000 resistance zone, it could continue to move down. Immediate support on the downside is near the $66,000 level.

The first major support is $65,000. The next support sits at $64,000. If there is a close below $64,000, the price could start a drop toward the $62,500 level. Any more losses might send the price toward the $60,500 support zone in the near term.

Technical indicators:

Hourly MACD – The MACD is now gaining pace in the bearish zone.

Hourly RSI (Relative Strength Index) – The RSI for BTC/USD is now below the 50 level.

Major Support Levels – $66,000, followed by $65,000.

Major Resistance Levels – $68,000, $68,500, and $70,000.

Bitcoin Teeters On The Edge Of Glory: Will It Smash The $70,000 Resistance?

Bitcoin (BTC) has been making waves with its steady climb towards setting a new all-time high (ATH), currently finding a foothold at the $68,000 zone.

This level of performance represents a culmination of investor confidence, market dynamics, and underlying economic factors that paint a broader picture of the digital currency’s “resilience and appeal.”

Crypto analyst Ali has recently shed light on a critical juncture in Bitcoin’s journey, identifying a significant resistance level that could influence its short-term price movements.

Key Resistance Awaits

Ali’s analysis brings to the forefront a specific resistance barrier that Bitcoin faces on its path to achieving a new ATH. According to Ali, a resistance level at $70,320, characterized by a total volume of 599,260 BTC held by 736,380 addresses, stands as the gatekeeper to further bullish momentum.

Surpassing this threshold could potentially catalyze Bitcoin’s ascent, further solidifying its status as the pinnacle of the cryptocurrency market.

This resistance particularly represents the collective anticipation and strategic positioning of hundreds of thousands of investors who have staked their claims in Bitcoin’s digital gold.

Meanwhile, the crypto market’s sentiment has been a rollercoaster, with Bitcoin experiencing a slight retreat, marking a 1.4% decrease over the past week and a 2.4% dip in the last 24 hours, landing at a market price of $68,448, at the time of writing.

Bitcoin (BTC) price chart on TradingView

Caution Amid Bitcoin Record Streak

Amidst this backdrop, author and former hedge fund manager Jim Cramer has voiced his observations, suggesting that the market is “the most overbought” it has been in a while.

The observations come just as Bitcoin marks its seventh month of positive performance, a milestone last achieved in 2012. This period of growth is highlighted by a monthly candlestick chart closing higher than the peak of its last cycle.

Adding to this “overbought” sentiment by Jim Cramer is a transaction of the seventh wealthiest Bitcoin address withdrawing 8,889 BTC from Bitfinex, valued at roughly $627 million, recorded by Peckshield.

However, despite this, Cramer’s statements have sparked debates and skepticism among the crypto community, with some questioning the timing of his comments as an April Fool’s jest.

Featured image from Unsplash, Chart from TradingView

Hedge Fund Manager Predicts When Bitcoin Price Will Reach $150,000

Founder and Chief Executive Officer (CEO) of Morgan Creek Capital Management, Mark Yusko has predicted a massive price increase for Bitcoin during the 2024 bull cycle. Emphasizing  Bitcoin’s immense potential, the hedge fund manager has crowned it as the unrivaled “King” among digital assets.

$150,000 Price Target Set For BTC

Appearing in a recent interview with CNBC Television on March 27, Yusko shared a bold forecast of Bitcoin, predicting that the cryptocurrency will see a significant rise to $150,000 in 2024. 

When asked why he believes the cryptocurrency would have such an astronomical price increase, Yusko cited the impacts of the upcoming Bitcoin halving and Spot Bitcoin Exchange Traded Fund (ETF), on the price of BTC. The hedge fund manager has revealed that historically after a BTC halving cycle is completed, the fair value of the cryptocurrency rises. 

He explained that when the upcoming 2024 Bitcoin halving occurs in April, BTC miners will face challenges, with transaction fees poised to soar, consequently driving a price increase to $75,000. 

After the Bitcoin halving event, the cryptocurrency is expected to surge two times its fair value to $150,000. The hedge fund manager cited factors like increased interest from investors and Fear of Missing Out (FOMO) as triggers for this price spike. 

Yusko also revealed that after the Bitcoin halving, there would be a surge in demand for Spot Bitcoin ETFs, while the supply of new coins would decrease from 900 BTC to 450 BTC a day.  “If there’s more demand than supply, price has to rise,” the hedge fund manager stated. 

The investment management CEO has expressed a strong belief in BTC’S value as one of the world’s leading digital assets. He envisions the cryptocurrency “easily” skyrocketing by 10x over the next decade. 

“Bitcoin is the king, it is the dominant token. It is a better form of gold or digital property. And I do think it will be the best,” Yusko said. 

Bitcoin Price Top Expected By Year’s End

During his interview, Yusko predicted that Bitcoin could reach its peak price value by the end of 2024. The hedge fund manager disclosed that historically, nine months after a Bitcoin halving event, sometime in December, BTC undergoes a surge to its peak value before entering the next bear market. 

During this time, the investment management CEO has stated that smaller crypto projects could potentially experience substantial increases, surpassing the gains witnessed by BTC. He disclosed several altcoins and investment assets that his company, Morgan Creek Capital Management, typically buys and HODLs, including Solana, Avalanche and Coinbase.

Bitcoin price chart from Tradingview.com

Bitcoin Halving Inches Closer With Less Than 2,900 Blocks Left

The Bitcoin Halving is fast approaching, with less than 2,900 blocks left before miners’ rewards are cut in half. This event, projected to take place sometime in April, is significant as Bitcoin’s price could enjoy a parabolic move to the upside after it takes place. 

Bitcoin Halving Set For April 19

Data from Coinwarz shows that the Bitcoin Halving is set to take place on April 19 at Block 840,000. This projection is based on Bitcoin’s current block time average, which means the Halving can come a little earlier or sometime after April 19. However, the main focus remains that miners’ supply will be cut in half. 

The Halving event is a deflationary measure that Bitcoin’s founder, Satoshi Nakamoto, encoded in the flagship crypto and takes place after every 210,000 blocks. Three halving events have occurred since the Genesis block in 2009, when Bitcoin’s first block was mined. The first was on November 28, 2012, when miners’ rewards were cut from 50 BTC to 25 BTC.

The next Halving event took place on July 9, 2016, cutting miners’ rewards to 12.5 BTC. The third one happened on May 11, 2020, reducing the reward to 6.25 BTC. Now, Miners’ rewards are set to be cut in half again, reducing them to 3.125 BTC.

This reward is the amount of BTC miners receive for validating each block of new transactions on the blockchain. Although this event mainly affects miners, the crypto community closely monitors it due to the ripple effects it could have on the market. Bitcoin’s supply comes through these miners’ rewards, and a reduction in them usually drives Bitcoin’s value higher. 

The Halving has historically always led to a price appreciation for Bitcoin. Ninety days after the first Halving on November 28, 2012, Bitcoin’s price increased to $1,000 from $12 at the time of Halving. Subsequently, Bitcoin’s price saw a gain of over 8,000% one year after that Halving. 

Bitcoin halving

This parabolic price surge also occurred after the second and third Halving events, with Bitcoin’s price rising from $650 and $8,821 (at the time of the Halving) to $2,506 and $56,612 (90 days after the Halving) in 2016 and 2020 respectively. Bitcoin also gained 284% and 559% one year after the event. 

This time isn’t expected to be different as Bitcoin is again predicted to experience a massive move to the upside after April. This bullish sentiment is further strengthened by Bitcoin’s demand, which has continued to skyrocket in the face of a dwindling supply. 

At the time of writing, Bitcoin is trading at around $70,400, up in the last 24 hours according to data from CoinMarketCap. 

Bitcoin price chart from Tradingview.com

Start Selling Bitcoin When This Happens, This Quant Says

A quant has explained that the past pattern in the Bitcoin taker buy-sell ratio metric may suggest the best window to start selling the asset.

Bitcoin Taker Buy Sell Ratio May Reveal Selling Opportunities

In a CryptoQuant Quicktake post, an analyst discussed the trend in the Bitcoin “taker buy sell ratio.” This indicator keeps track of the ratio between the Bitcoin taker buy and taker sell volumes.

When the value of this metric is greater than 1, the investors are willing to purchase coins at a higher price right now. Such a trend implies a bullish sentiment is the dominant force in the market.

On the other hand, the indicator being under the mark suggests the selling pressure may be higher than the current buying pressure in the sector. As such, the majority may share a bearish mentality.

Now, here is a chart that shows the trend in the 30-day moving average (MA) Bitcoin taker buy-sell ratio over the last few years:

Bitcoin Taker Buy Sell Ratio

As the above graph shows, the 30-day MA Bitcoin taker buy-sell ratio has recently fallen below the 1 level. The quant has highlighted in the chart the region of the metric where the bull run peaks in 2021 formed.

The indicator would appear to dip below 0.97 during both the heights registered in that bull run. According to the analyst, such indicator values suggest the euphoria phase of the market where the smart money starts to sell. Still, the prices continue to hold on as the retail investors continue to FOMO into the asset.

So far, the indicator has approached the 0.98 level in its latest decline, implying that it’s not yet at the levels where the possibility of a top might become significant if the pattern of the previous bull run is anything to go by.

The Bitcoin taker buy sell ratio may also be used as a buying signal, with the 1.02 level being an important level. The quant notes, however, that the metric is better at showing an overbought market than it is for pinpointing oversold conditions.

In other news, as an analyst pointed out in a post on X, all the Bitcoin investor groups have accumulated a net amount of 95,000 BTC ($6.5 billion at the current exchange rate) over the past month.

Bitcoin Accumulation

This rapid accumulation suggests that the Bitcoin investor groups have been buying up significantly more than the miners have produced. The chart shows that an accumulation streak of similar levels followed the recent rally in the asset, so this latest one can also be bullish for the asset.

BTC Price

At the time of writing, Bitcoin is trading at around $68,600, up more than 3% over the past week.

Bitcoin Price Chart

Forget Bitcoin, Altcoins Are The Winners Of This Cycle, Crypto Analyst Says

All eyes look to be on the flagship crypto, Bitcoin, ahead of the Bitcoin Halving, as market analysts predict further upside moves for the crypto token. However, crypto analyst Jason Pizzino recently made a strong case for altcoins like Ethereum (ETH) and Solana (SOL) and why much focus should also be placed on them. 

Ethereum And Solana Still Primed For Strong Moves Ahead Of Bitcoin

Pizzino suggested in a video on his YouTube channel that Ethereum could experience a breakout in the coming months. This came following his analysis of the ETH/BTC pair, in which he noted that Bitcoin was currently taking the spotlight with new all-time highs (ATH) while ETH looks to be consolidating. 

As highlighted by the analyst, this is similar to the previous bull run when ETH consolidated while Bitcoin was hitting new ATHs. However, ETH experienced a significant rise soon after then while Bitcoin cooled off. As such, if history were to repeat itself, ETH could once again enjoy a trend reversal soon enough and make a parabolic move to the upside.

Pizzino also mentioned SOL as another altcoin that can potentially move to new prices against Bitcoin’s value. In the last bull run, the crypto token also experienced significant moves to the downside as Bitcoin hit new ATHs. However, a trend reversal quickly followed afterward, with SOL enjoying moves to the upside. 

Therefore, SOL, like ETH, could be primed for price surges if history were to repeat. Pizzino added that this is a time to be aware and see any price dip as a buying opportunity to position for these price gains that could be on the horizon. 

Ethereum Showing Some Strength 

Crypto analyst Michaël van de Poppe echoed Pizzino’s sentiments in a post on his X (formerly Twitter) platform. While analyzing the ETH/BTC pair, he noted that ETH’s price hasn’t made any significant move against Bitcoin’s as of yet. However, he added that it is a “good sign to see some slight strength in Ethereum.”

Like Pizzino, van de Poppe also expects Ethereum to make a massive move against Bitcoin’s value soon enough. The crypto expert explicitly stated that he still expects “a lot” from the second-largest crypto token by market cap. Besides Ethereum, van de Poppe has continued making a case for other altcoins as he believes they are still undervalued. 

In another X post, he highlighted that altcoins are down between 25% and 40% from their recent highs. However, van de Poppe remarked that this is the perfect time to take positions and that these consolidations should be seen as opportunities rather than a drawbacks. 

Bitcoin price chart from Tradingview.com

Bitcoin Flash Crash Washes Out 81,000 Crypto Traders For Over $220 Million

Bitcoin has started out the new week on a rather bearish note after a flash crash sent the price below $69,000 once more. There has since been some recovery in the price of the largest cryptocurrency in the space. However, the damage has already been done as tens of thousands of crypto traders were flushed out of their leveraged positions as a result.

81,000 Crypto Traders Lose $220 Million

The Bitcoin flash crash hit support just above $68,800 but crypto traders are already feeling the brunt of the large move. In the last day, more than 81,000 traders have lost their leveraged positions and the volume of their liquidations have piled up.

According to data from Coinglass, the numbers have climbed above 81,400 crypto traders who were liquidated as a result of the crash. In total, over $223 million was also lost during this time from all of the flushed positions. Then, the single largest liquidation took place on the OKX exchange across the ETH-USD-SWAP pair. This trader alone lost $7 million when their position was liquidated.

As expected, the majority of the losses have come from long traders, with Coinglass showing a total of 70.01% of the liquidated positions being longs. This means that long liquidation volumes climbed above $156 million during the last 24 hours.

The crypto exchange with the largest liquidation volumes was the OKX exchange, accounting for 46.87%, or $104.61 million, of all liquidations. Binance came in second place with 38.72%, or $86.41 million. Meanwhile, Bybit saw the third-largest liquidation volume at 8.4%, or $18.75 million.

Bitcoin, Ethereum, And Dogecoin Lead Liquidations

Naturally, the crypto assets with the largest liquidation volumes have been Bitcoin and Ethereum, with $36.1 million and $28.98 million. However, meme coins such as Dogecoin and PEPE have seen their own numbers ramp up as well.

Dogecoin’s liquidation volumes came out at $10.4 million for the 24-hour period, which put it ahead of Solana with $8.3 million. Then coming up behind Solana is PEPE, with liquidation volumes climbing as high as $7.1 million.

Across all of these cryptocurrencies, long traders continue to suffer massive losses. Even in the shorter timeframe, the trends for long traders continue to look bleak. Coinglass data shows that in the last 12 hours, long traders accounted for 85.64% of liquidations. Then, in the 4-hour and 1-hour timeframes, they account for 6.182% and 72.62%, respectively.

As for the Bitcoin price, bulls continue to struggle as resistance at $69,500 mounts. The price is currently trading at $69,450 at the time of this writing, with a 1.1% decline in the last day, according to data from Coinmarketcap.

Bitcoin price chart from Tradingview.com

Bitcoin Weekly Range Breakout Signals Potential Upsurge: Analyst

Popular cryptocurrency analyst and enthusiast Rekt Capital has delved into the recent performance of Bitcoin (BTC) citing the beginning of a breakout process from a weekly range that could possibly lead to an upswing.

Bitcoin Begins The Breakout Process

Rekt Capital previously highlighted that Bitcoin has been wedged within a weekly range he dubbed Black-Black, ever since it witnessed about 18% correction. The candle-bodied peak from 2021 and the upside-wicking peak from 2021 basically created this weekly range.

He then claimed that regaining the $69,200 Range High for Bitcoin could indicate that the cryptocurrency is prepared to break out of the weekly range. Additionally, it might also signal the conclusion of the aforementioned pullback period.

It appears the analyst’s forecast has come to pass as BTC has surpassed the $69,200 level, triggering a breakout activity. According to Rekt Capital, the first phase in the breakout process that Bitcoin has initiated is a Weekly Close above the Range High.

However, before moving higher, BTC might need to dive into the range high in order to properly retest it as new support. As a result, it would be the second phase to validate the break out from the week range properly.

Bitcoin

The crypto expert’s analysis coincides with a recent drop in the price of Bitcoin today, raising speculations about its next movement. Bitcoin opened the day around the $71,000 threshold; a few hours later, the crypto asset fell to $69,200 level.

As of the time of writing, Bitcoin was trading at $69,500, indicating a decline of about 1.29% in the past day. BTC’s market cap has also decreased in the last 24 hours by the same percentage, while its daily trading volume has increased by over 52%.

A Bullish Month For BTC

This suggests that investors are still bullish toward the digital asset despite the retrace witnessed today. Investors are even more optimistic as Bitcoin’s halving event approaches because of the possible impact on BTC.

Even though BTC began the day with a decline, several analysts still believe it might perform robustly in April. This is due to the fact that Bitcoin has mostly experienced significant growth in April over the past years.

Zia Ul Haque, the Founder of Open4Profit claims that in the past April has been superior to March while providing a comparison of the monthly increases in the price of Bitcoin from 2013 until 2024. According to data shared by Haque, April has witnessed an average 14.2% increase in price. 

Haque anticipates a better performance this time since the much-awaited Bitcoin halving event will take place this month. “Halving is just at the end of this month – April 20th, pre-halving narrative can bring lots of attention to this market,” he stated.

Bitcoin

Bitcoin-Powered Core DAO (CORE) Skyrockets By 220%, Here’s Why

Core DAO (CORE), the cryptocurrency behind the Core blockchain, has seen its price skyrocket by 220% over the last week, marking a significant milestone in its market performance. As of the last 24 hours, CORE has seen an additional 63% increase, accumulating a staggering 350% gain in just nine days. This rally has elevated Core DAO to the 55th position among all cryptocurrencies by market cap.

What Is Core DAO?

Core DAO operates on the Core blockchain, a Layer 1, EVM-compatible platform that supports the Bitcoin network by offering a secondary BTC block reward. The Core blockchain distinguishes itself through its unique Satoshi Plus consensus mechanism—a hybrid of Bitcoin’s Proof-of-Work (PoW) and a delegated Proof-of-Stake (DPoS). This mechanism aims to address the blockchain trilemma, ensuring decentralization, scalability, and security.

Core aims to create a strong and inclusive community within the Web 3 ecosystem, offering various features such as a stake bridge, airdrops, and a mining app to facilitate participation and engagement. The project is focused on building Web3 infrastructure and promoting public chains based on Bitcoin’s Proof-of-Work consensus, boasting over 10 million transactions, 550,000 addresses, and significant social media presence​​​​.

As of press time, Core’s market cap was about $2.3 billion, with a 24-hour trading volume of approximately $447 million. The circulating supply of CORE tokens is 875,161,702 out of a maximum supply of 2,100,000,000 CORE tokens.

Factors Behind CORE’s Exponential Rally

The recent price rally of CORE can be attributed to a confluence of factors, including the anticipation of the Bitcoin halving, scheduled in 20 days, and significant project announcements.

One of the pivotal developments propelling Core’s rise is the soon-to-come launch of non-custodial Bitcoin staking, which is expected to boost the public chain’s TVL and favor a rise in CORE price.

Moreover, the launch of coreBTC has been a significant catalyst. CoreBTC enables Bitcoin holders to engage in the DeFi space on the Core Chain without compromising on Bitcoin’s foundational principles of trustlessness and security. This initiative paves the way for Bitcoin to become a central asset in DeFi’s future, backed by decentralized smart contracts and rigorous overcollateralization requirements.

Additionally, Core has kick-started a 6-month incentive program targeting the BTCfi ecosystem. This program is designed to fuel growth and adoption by rewarding contributions to the ecosystem, particularly in bridging assets and exploring decentralized applications (dApps). The initiative covers assets from various blockchains, including Ethereum, Arbitrum, Optimism, Avalanche, Polygon, and BNB, thereby enhancing participation in Core’s flagship dApps.

At press time, CORE traded at $2.69.

Core DAO price

Bitcoin Price Consolidates Above $70K, Can Bulls Pump BTC To $75K?

Bitcoin price is consolidating above the $70,000 resistance zone. BTC might remain in a range for some time before the bulls attempt a move toward $75,000.

  • Bitcoin price is struggling to gain pace above the $71,500 resistance zone.
  • The price is trading above $70,500 and the 100 hourly Simple moving average.
  • There is a short-term rising channel forming with support at $70,750 on the hourly chart of the BTC/USD pair (data feed from Kraken).
  • The pair could soon start a fresh rally if it clears the $71,500 resistance zone.

Bitcoin Price Remains In Range

Bitcoin price formed a base above the $69,000 resistance zone. BTC climbed higher the $70,000 resistance zone to move again into a positive zone.

The price broke the $71,000 level but the bears were active below the $71,500 resistance. The recent high was formed near $71,306 and the price is now consolidating gains. It is trading near the 23.6% Fib retracement level of the upward move from the $69,128 swing low to the $71,306 high.

Bitcoin is now trading above $70,500 and the 100 hourly Simple moving average. There is also a short-term rising channel forming with support at $70,750 on the hourly chart of the BTC/USD pair.

Bitcoin Price

Source: BTCUSD on TradingView.com

Immediate resistance is near the $71,300 level. The first major resistance could be $71,500. If there is a clear move above the $71,500 resistance zone, the price could start a strong increase. In the stated case, the price could even clear the $72,500 resistance zone in the near term. The next major resistance is near the $73,500 zone.

Another Drop In BTC?

If Bitcoin fails to rise above the $71,200 resistance zone, it could start another decline. Immediate support on the downside is near the $70,750 level and the channel trend line.

The first major support is $70,200 and the 50% Fib retracement level of the upward move from the $69,128 swing low to the $71,306 high. The next support sits at $70,000. If there is a close below $70,000, the price could start a drop toward the $69,120 level. Any more losses might send the price toward the $68,500 support zone in the near term.

Technical indicators:

Hourly MACD – The MACD is now losing pace in the bullish zone.

Hourly RSI (Relative Strength Index) – The RSI for BTC/USD is now above the 50 level.

Major Support Levels – $70,750, followed by $70,200.

Major Resistance Levels – $71,200, $71,500, and $73,500.

Prepping For $100,000: Bitcoin Shark And Whales Spend Over $18 Billion To Buy BTC

Almost every Bitcoin investor is anticipating a continued price surge as the crypto continues to trade around the $70,000 price mark. On-chain data has shown a large part of this surge can be attributed to the accumulation by large whales

Bitcoin is undoubtedly home to a lot of these whale addresses holding hundreds of millions of dollars and with transactions that can move the market. However, on-chain data has further revealed that the accumulation trend has also flowed into the next cohort of traders. These traders, also known as “Sharks,” are addresses that hold between 100 BTC and 1,000 BTC. According to Glassnode data, shark wallet addresses have accumulated 268,441 BTC in the past 30 days, which is the biggest net position change since 2012. 

Increased Accumulation Of BTC

According to a Glassnode chart shared on social media by crypto analyst James Van Straten, Bitcoin accumulation by shark investors shot up in 2024 to reverse a multi-year consolidation since 2020. As a result, these addresses increased their holdings by 268,441 in 30 days, roughly converting to $18 billion. 

While these sharks do not have as much individual power over price movement as very large whales, their collective behavior is still worth monitoring as they also relate to the sentiment among investors. Consequently, this large accumulation trend could lead to more buying which would signal a continued price surge for Bitcoin.

Bitcoin

The surge in accumulation is not really surprising, as the launch of Spot Bitcoin ETFs in the US has ushered in a bigger wave of accumulation sentiment from all cohorts of Bitcoin investors. As another analyst pointed out on social media, this shark accumulation could’ve been due to ETFs purchasing massive amounts of Bitcoins from Coinbase OTC desks.

Bitcoin whales (addresses holding more than 1,000 BTC) have also upped their activity in the past few days, signaling strategic positioning in the market. Various transaction alerts from Whale Alerts have shown strategic movement from whale addresses.

Notably, the crypto whale transaction tracker has revealed $1.3 billion worth of BTC exchanged between whale addresses in the past 24 hours. Among these large BTC movements was a notable transfer of 3,599 BTC worth $252 million between two unknown wallets. Another notable transaction was the transfer of 3,118 BTC from an unknown wallet to Coinbase Institutional.

Bitcoin To $100,000?

Data from IntoTheBlock has also reiterated this accumulation trend with its net transfer trend from exchanges. Data from ITB’s platform shows a $16.18 billion outflow from exchanges as against a $15.76 billion inflow in the past seven days. Bitcoin is now trading at $67,931 and has failed to stabilize above the $70,000 mark again.

However, the accumulation by whales and sharks, increasing mainstream interest from institutional investors through Spot Bitcoin ETFs, and the approaching halving all point to the possibility of substantial price appreciation to $100,000.

Bitcoin price chart from Tradingview.com

Can This Bullish Chart Pattern Propel Bitcoin Price To $75,000?

The Bitcoin price has experienced a notable resurgence over the past week, drawing parallels to the optimism often associated with Holy Week among Christians. This renewed momentum has infused the entire market, leading to significant profits for other major cryptocurrencies in the last seven days.

The resurgence of the Bitcoin price seems to be at its nascent phase, with a popular crypto pundit on the X forecasting a bullish trajectory for the premier cryptocurrency over the coming days.

Bitcoin Price To Reach $75,000?

In a recent post on the X platform, Ali Martinez put forward an optimistic prediction for the price of Bitcoin. According to the crypto analyst, the premier cryptocurrency’s current price action indicates that BTC might be ready for another run to the upside.

This bullish prediction is based on the formation of an inverse head-and-shoulders chart pattern in the 30-minute timeframe. Considering the short timeframe, this projection, if it comes true, will likely play out over the next few days.

Typically, a head-and-shoulders price pattern signals a bullish-to-bearish trend reversal and indicates that an upward trend might be coming to an end. In contrast, the inverse head-and-shoulders chart formation suggests the possible reversal of a downward trend, with potential bullish movement on the horizon.

Bitcoin Price

According to the highlighted chart above, the Bitcoin price is currently following a trend above the 200 exponential moving average (EMA). If the coin maintains its position above this moving average and manages to cross the neckline resistance at $71,580, Martinez expects the price of BTC to move further upward toward $74,760.

This almost $75,000  target would be a new all-time high for the Bitcoin price and an almost 5% move from the current price point. The current record-high price for BTC stands at around $73,700, which was set a little over two weeks ago.

BTC Price Overview

As of this writing, Bitcoin is valued at $69,875, reflecting a 0.7% price decline in the past day. While the premier cryptocurrency is back below the $70,000 level, this slight dip is not substantial enough to erase its profit over the past week.

According to data from CoinGecko, the Bitcoin price is up by nearly 10% in the last seven days. After climbing as high as $71,500 earlier in the week, BTC now trails its all-time high price by about 5%.

Nevertheless, Bitcoin still maintains its position as the largest cryptocurrency in the sector, with a market capitalization of over $1.37 trillion.

Bitcoin price

What’s A Simple Strategy For Buying & Selling Bitcoin? This Analyst Answers

An analyst has revealed a simple strategy for buying and selling Bitcoin using the historical pattern followed by two BTC on-chain indicators.

These Bitcoin On-Chain Indicators Have Followed A Specific Pattern Historically

In a post on X, CryptoQuant author Axel Adler Jr. discussed a simple strategy for timing buying and selling moves for Bitcoin. The strategy is based on the trend witnessed historically in two BTC on-chain metrics: the Net Unrealized Loss (NUL) and Net Unrealized Profit (NUP).

As their names suggest, these indicators keep track of the total amount of unrealized loss and unrealized profit that the investors are currently carrying.

These metrics work by going through the transaction history of each coin in circulation to see what price it was last transacted at. Assuming that the last transfer of each coin was the last time it changed hands, the price at its instant would act as its current cost basis.

If the previous price for any coin was less than the current spot price of the cryptocurrency, then that coin is currently carrying a profit. The NUP subtracts the two to calculate the exact unrealized gain for the coin.

Similarly, the NUL does the same for coins that have their cost basis above the latest value of the asset. These indicators then sum up this value for the entire supply and divide the sum by the current market cap.

Now, first, here is a chart shared by the analyst for the NUL that reveals a pattern that the metric has been following throughout the history of Bitcoin:

Bitcoin NUL

The Bitcoin NUL appears to have historically broken above the 0.5 level when the asset’s price has traded around bear market lows. According to Axel, the indicator in this territory would be the moment to buy more.

Recently, the metric has been floating around the zero mark, meaning that there has been any unrealized loss being held by the investors. This makes sense, as the cryptocurrency has set new all-time highs (ATHs). Naturally, 100% of the supply goes into profit when an ATH is set.

Similar to the pattern in the NUL, the NUP has been above the 0.7 level during major tops in the past, suggesting that it may be a good opportunity to sell when the indicator is in this zone.

Bitcoin NUP

As is visible in the chart, the NUP has been marching up with the recent rally in Bitcoin. Still, so far, the indicator hasn’t broken above the seemingly important 0.7 level, implying that the market may not yet be in an overheated place where selling would be ideal, at least according to this strategy.

The graphs of the two indicators, though, show that neither of them flagged the exact tops or bottoms in the asset. It’s especially prominent in the data of the NUP, where the metric signaled “sell” during tops that were merely halfway through the bull run.

That said, buying during the points flagged by the NUL and then selling at the overheated NUP values would have historically been profitable. In that sense, this would indeed be a “simple” strategy for the asset.

It remains to be seen, though, whether these patterns will continue to hold in the current Bitcoin cycle as well.

BTC Price

At the time of writing, Bitcoin is trading at around $69,400, down 2% over the past 24 hours.

Bitcoin Price Chart

Coinbase Sees Largest USDC Inflow Ever, What This Could Mean For Bitcoin

On-chain data shows Coinbase has just witnessed its largest USD Coin (USDC) inflow. Here’s why this may be relevant for Bitcoin.

Coinbase Has Just Seen A $1.4 Billion USDC Inflow

As pointed out by analyst Maartunn in a post on X, a large amount of USDC has flowed into Coinbase during the past day. The on-chain indicator of interest here is the “exchange inflow,” which keeps track of the total amount of a given asset entering into the wallets associated with a centralized exchange or group of platforms.

A spike in the exchange inflow can indicate that investors are interested in trading away the cryptocurrency. In the case of an asset like Bitcoin, such a trend can naturally be a bearish signal for the price.

In the context of the current discussion, though, a stablecoin is of focus. While USDC exchange inflows would also imply that the holder wants to sell the asset, the transaction wouldn’t affect the price since, by nature, the coin always remains stable at around $1.

This doesn’t mean that the sale of USD Coin isn’t of interest to the cryptocurrency sector as a whole, however. If investors are swapping stable coins in favor of volatile coins like BTC, then the prices of these latter assets would observe a buying effect.

Now, here is a chart that shows the trend in the USDC exchange inflow over the past month:

USDC Exchange Inflow

The above graph shows that the USDC exchange inflow has just registered a huge spike. According to Maartunn, this inflow was headed towards the cryptocurrency exchange Coinbase.

In total, $1.4 billion worth of the stablecoin has entered the platform’s wallets with this inflow, the largest the exchange has ever observed. Given the extraordinary scale, this could prove to be quite bullish for Bitcoin and others if the entity behind the inflow is planning to go on a buying run with this dry powder.

There also exists the scenario, however, where the whale actually intends to trade away the USD Coin stack in favor of fiat rather than using it to buy other cryptocurrencies. In such a case, a net amount of capital would be exiting the sector, which would be a bearish sign.

It now remains to be seen whether the massive USDC deposit indeed ends up causing any noticeable fluctuations in the volatile side of the market, particularly in the price of Bitcoin.

Bitcoin Price

Bitcoin had observed sharp bullish momentum earlier to cross above the $70,000 level, but since then, the asset has fallen back to sideways movement, with its price remaining unchanged.

Bitcoin Price Chart

Grayscale Bitcoin ETF Sees Drastic 60% Drop In Outflows, Why This Is Important

The outflows from the Grayscale Bitcoin ETF rocked the market hard last week, leading to a dramatic decline in the BTC price. However, with the new week, there has been a change in direction as investors begin to get bullish on Bitcoin once more. As a result, the outflows from the Grayscale ETF have slowed down, reaching one of its lowest points for the month.

Grayscale Bitcoin ETF Outflows Drop 60%

Grayscale outflows ramped up last week, spearheading what would turn out to be a full week of outflows from Spot Bitcoin ETFs for the first time ever. The outflows rose rapidly over the week, even moving into the new week. However, inflows into Spot Bitcoin ETFs have been on the rise, which have overshadowed the outflows from GBTC.

Despite the outflows from the GBTC continuing, it has begun to spin into a more positive narrative as the number of BTC flowing out of the fund is declining fast. To put this in perspective, data shows there was 299.8 BTC moved out of the fund on Wednesday, March 27, and on Thursday, March, 20204, this figure dropped to 104.9 BTC, representing a 60% drop.

This marks the second day with the lowest outflows from the Grayscale Bitcoin ETF right behind the March 12 outflows of 79 BTC. It also points to a decline in the volume of outflows as investors start to level out and find their footing elsewhere.

Nevertheless, the GBTC has remained the loser of the Spot Bitcoin ETF race, nursing a full month of outflows so far. Since the ETFs were first approved in January until now, there has been more than $14.6 billion moved out of the fund, which accounts for around 50% of its total balance. These BTC have presumably found a home in other Spot ETF funds which have been seeing massive inflows.

Unlike last week, inflows have also dominated Spot Bitcoin ETFs this week. Total inflows for the week crossed above $800 million, bringing the total Assets Under Management (AuM) to almost $57 billion in less than three months.

Why This Could Trigger A BTC Price Rally

The last time that GBTC outflows saw a slowdown after rising for about a week, it triggered a response from the Bitcoin price in the form of a rally. Inflows also continued to dominate for the next couple of weeks and during this time, the BTC price enjoyed a long stretch of recovery. It went from $40,000 to over $70,000 in the space of two months.

If this trend repeats itself this time around, then another massive BTC price rally could be around the corner. A similar price increase would also put Bitcoin right above $100,000 in the next few months. In this case, the uptrend would be far from over.

At the time of writing, Bitcoin is still struggling to break $70,000 after a 1% drop in the last day.

Bitcoin price chart from Tradingview.com

Bitcoin Ready To Rip? Indicator Prints Bullish Signal After 9 Years

One analyst on X thinks Bitcoin bulls may be in for a treat in the coming months after one key indicator printed a buy signal for the first time in nearly a decade. While pointing to a bullish crossover on the 2-month chart’s Golden Moment Indicator, the analyst said the signal is again flashing green in almost nine years. 

Further cementing this outlook, this is forming as yet the Supertrend indicator, which has historically preceded every major Bitcoin uptrend, is also bullish.

BTC bull signals print | Source: Analyst on X

Bitcoin On A Bullish Path?

Though the analyst might be bullish on the world’s most valuable coin, the asset remains consolidated.  Technically, reading from the formation in the daily chart, the coin is slowly losing the uptrend momentum. This week, Bitcoin failed to build on to late last week’s spike to push above $72,000 in a buy trend continuation.

Bitcoin price trending upward on the daily chart | Source: BTCUSDT on Binance, TradingView

In the daily chart, Bitcoin is trading above the 20-day moving average. However, prices have been moving horizontally below $72,000. Despite this, traders are hopeful. 

Whether bulls will flow back and thrust the coin to fresh highs above $74,000 will depend on many other factors.

Inflows Into Spot BTC ETFs Pick Up Momentum

A key influencer on price and sentiment remains spot Bitcoin exchange-traded funds (ETFs) and their flow trend. Since launching, nine out of the ten spot Bitcoin ETFs have accumulated over 500,000 BTC, or roughly 2.5% of the total supply. 

When Grayscale’s BTC holding is factored in, all spot Bitcoin ETF issuers in the United States control 830,000 BTC. Cumulatively, this figure translates to roughly 4% of the total supply.

Of note, after last week’s slowdown, inflows continued throughout this week, pushing their holdings even higher—a net positive for the price and, most importantly, investor confidence. By March 28, Lookonchain data shows that 21Shares led the charge, adding 2,924 BTC. 

Spot Bitcoin ETF issuers accumulating | Source: Lookonchain via X

Despite the general lull in Bitcoin prices, the uptick in demand for these derivative products indicates growing interest among institutional and retail investors.

It remains to be seen how prices react going into April, an important month. In less than four weeks, the network will halve miner rewards from 6.25 BTC to 3.125 BTC, making the coin scarce. If the current level of demand remains, BTC prices will likely rise as market forces automatically adjust prices.