Chief Investment Officer at Second Foundation Partners, Ben Hunt, believes Bitcoin going mainstream dulls its original use case and brings unacceptable compromises.
The leading cryptocurrency was founded on the principles of being permissionless and censorship-resistant. In short, a way to stick it to the establishment. But with Wall Street increasingly co-opting Bitcoin for its own ends, Hunt sees a coming Bitcoin identity crisis ahead.
The Institutions Are Coming in a Big Way
Recent times have seen institutions getting into Bitcoin in a big way. A popular method for institutions to invest in the leading cryptocurrency is via Grayscale asset managers.
Grayscale deals only with accredited investors. This means they serve individuals earning more than $200k a year and a net worth of over $1 million. Or in the case of organizations, entities with more than $5 million in liquid assets, or all beneficial owners meeting the criteria for individuals above.
Grayscale’s Q4 2020 Report showed that last year’s total inflows equated to four times the cumulative inflows of the previous seven years. With over half of 2020’s coming in the final quarter of 2020.
“$3 Billion Dollar Quarter: Grayscale experienced unprecedented investor demand, with approximately $3.3 billion of inflows. Investment into the Grayscale family of products surpassed $5.7 billion during 2020, more than four times the $1.2 billion cumulative inflow into the products from 2013-2019.”
Some big Wall Street players are also moving directly into Bitcoin themselves. The likes of BNY Mellon, Goldman Sachs, and Morgan Stanley, to name a few, have all given their nod of approval.
Their sudden interest in Bitcoin is for many reasons. A common theme from banks is the growing investor appetite for cryptocurrencies. There’s also the hedge narrative which is gaining traction as investors brace for a coming economic implosion.
Inventor Satoshi Nakamoto intended his creation to work as an alternative, even a replacement, to “the system.” However, as Hunt points out, that system is slowly subverting it for its own means.
Better to Stifle Bitcoin Than Ban it
Many called 2020 the year of institutional Bitcoin investment. Even attributing its break of $20k and the subsequent run-up to institutional money pouring into the markets. Either way, Q4’s unbelievable performance made it hard to ignore BTC.
While some investors, including Ray Dalio and Jim Rogers, believe a ban could come, Hunt takes a different view. Rather than outlawing the leading cryptocurrency, Hunt sees authorities striking back with “golden handcuffs and administrative surveillance.”
He describes the strategy as a way to accommodate and swallow Bitcoin, which is what they’ve done with every other financial innovation. Adding it’s preferable to stifle its censorship resistance and turn it into another Wall Street gaming table. The upshot to this is a future where people are encouraged to buy Bitcoin.
“Because the artistic Bitcoin identity I admire and value has been subverted by the neutering machine of Wall Street and the regulatory panopticon of the US Treasury Dept.
Because what made Bitcoin special in the first place is nearly lost, and what remains is a false and constructed narrative that exists in service to Wall Street and Washington rather than in resistance.”
The reality is most investors, whether libertarian or not, care only for the gains. At the same time, Bitcoin’s message may become diluted with institutional involvement, the primary concern for most remains making money.
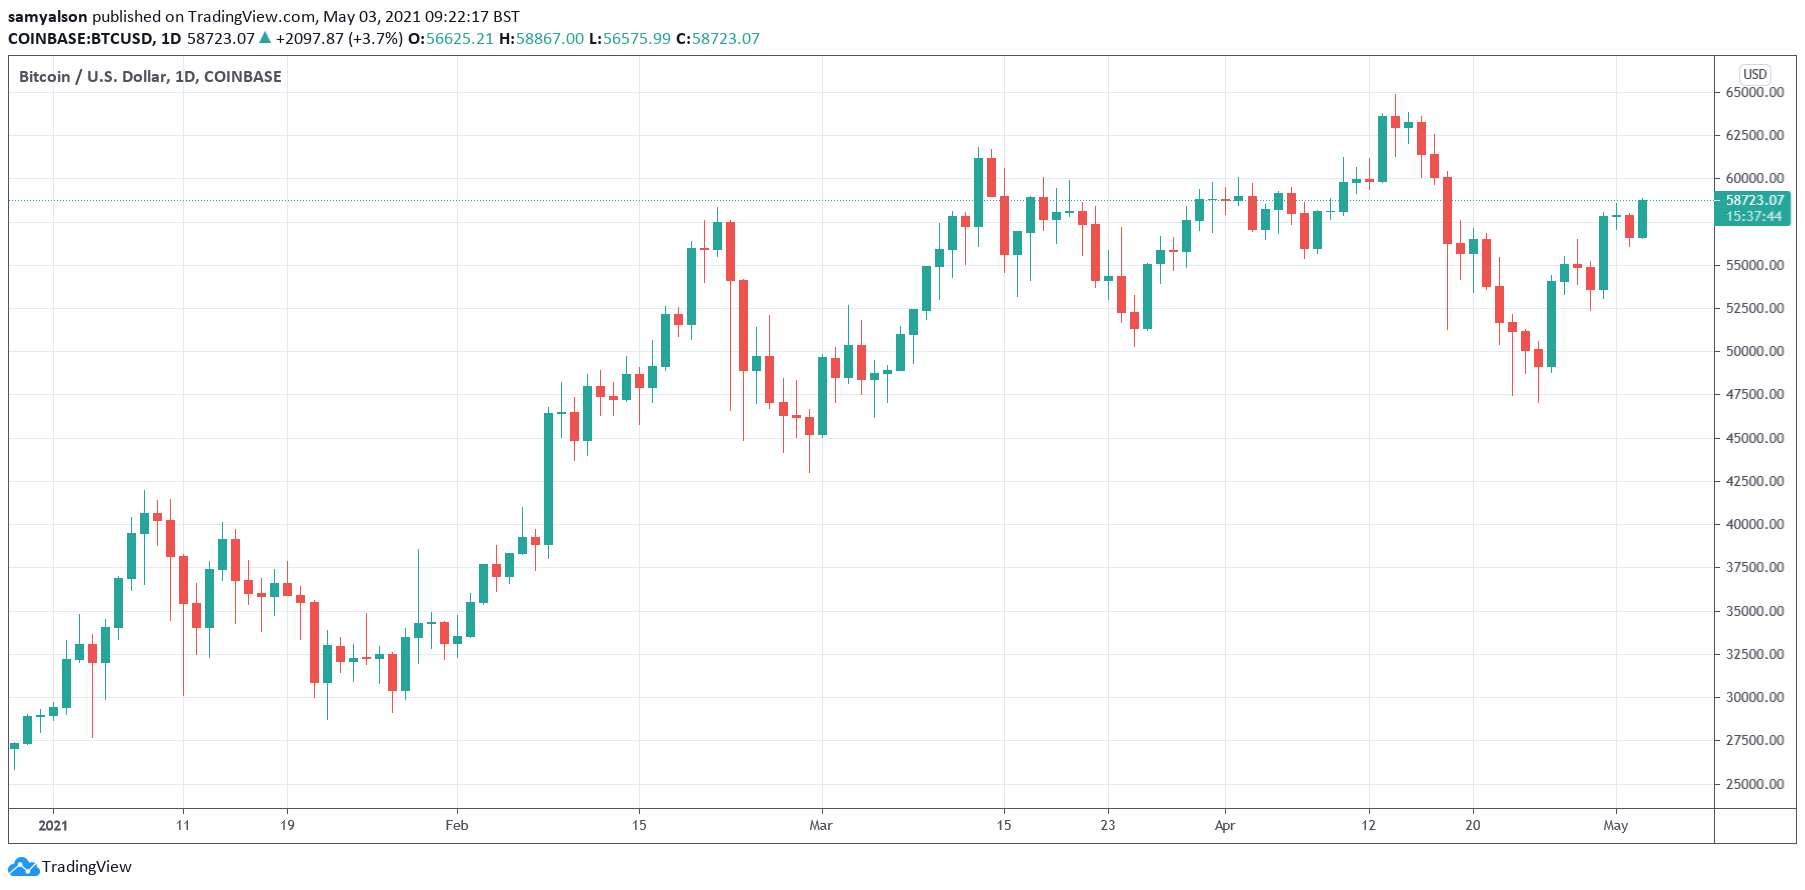
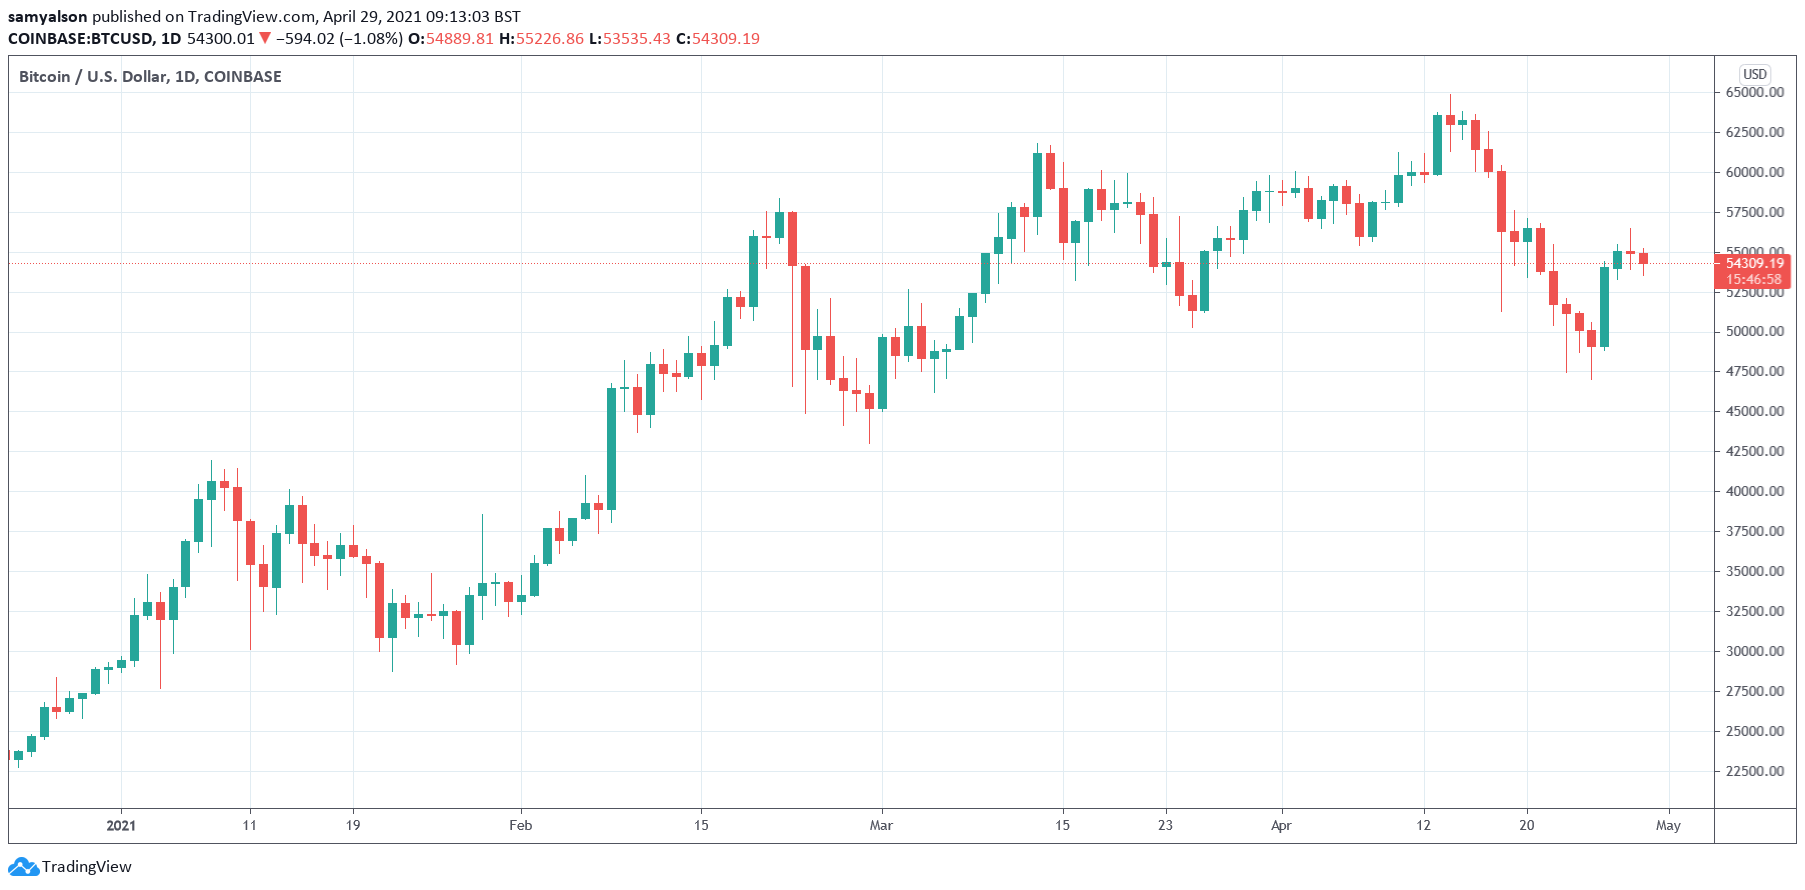
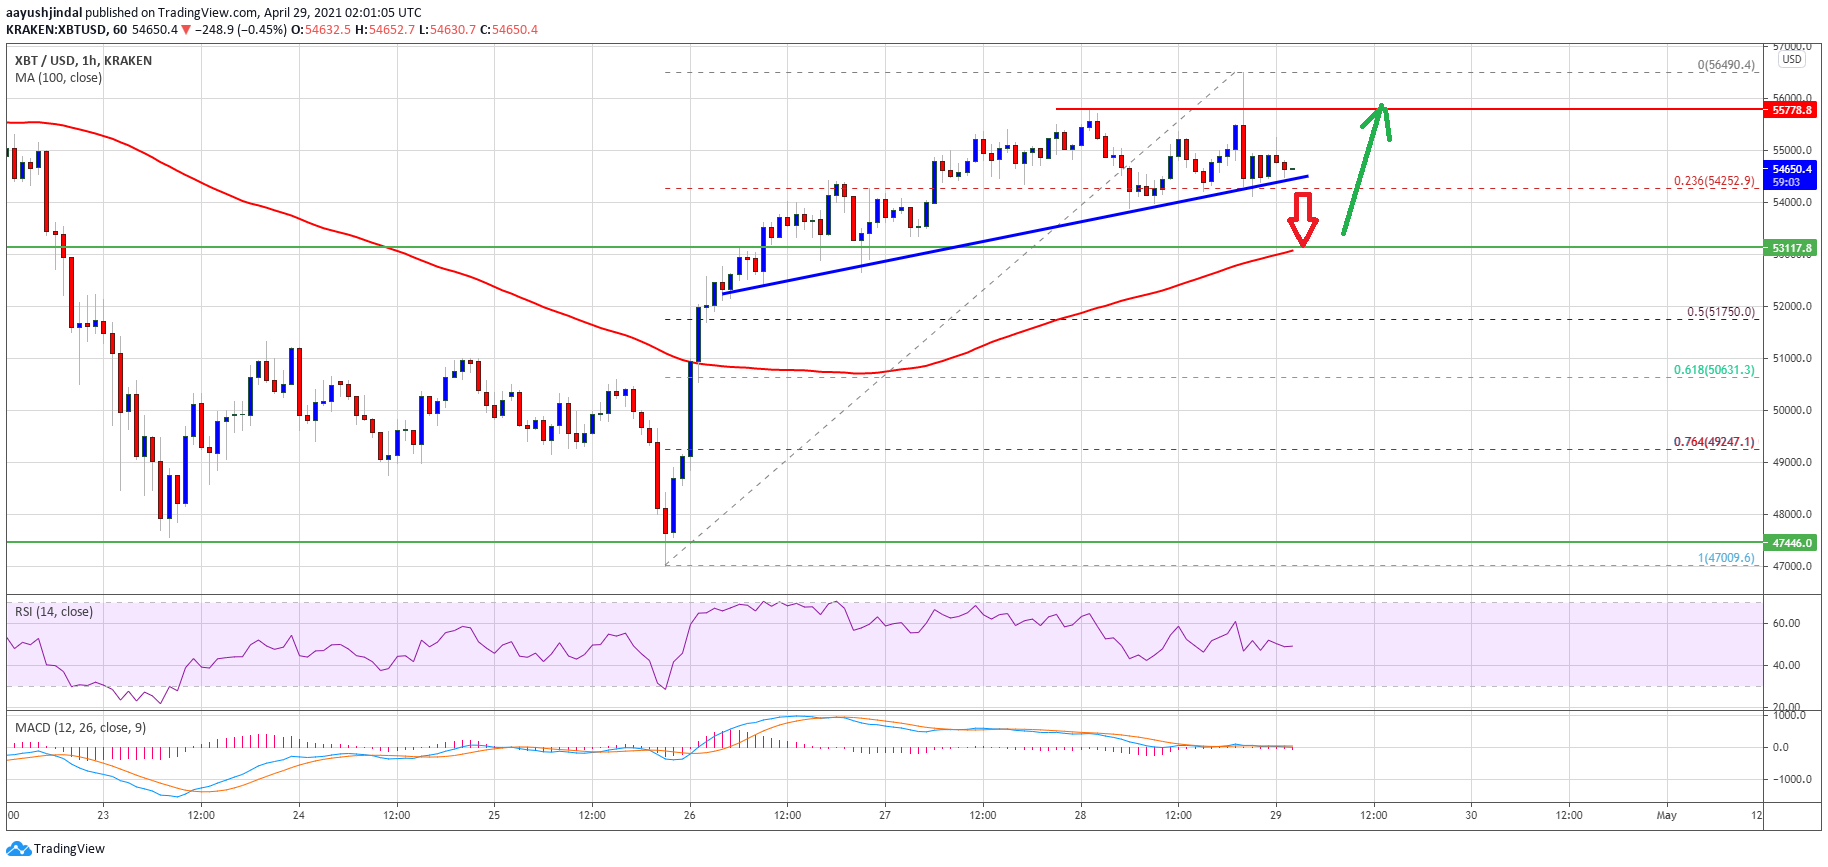
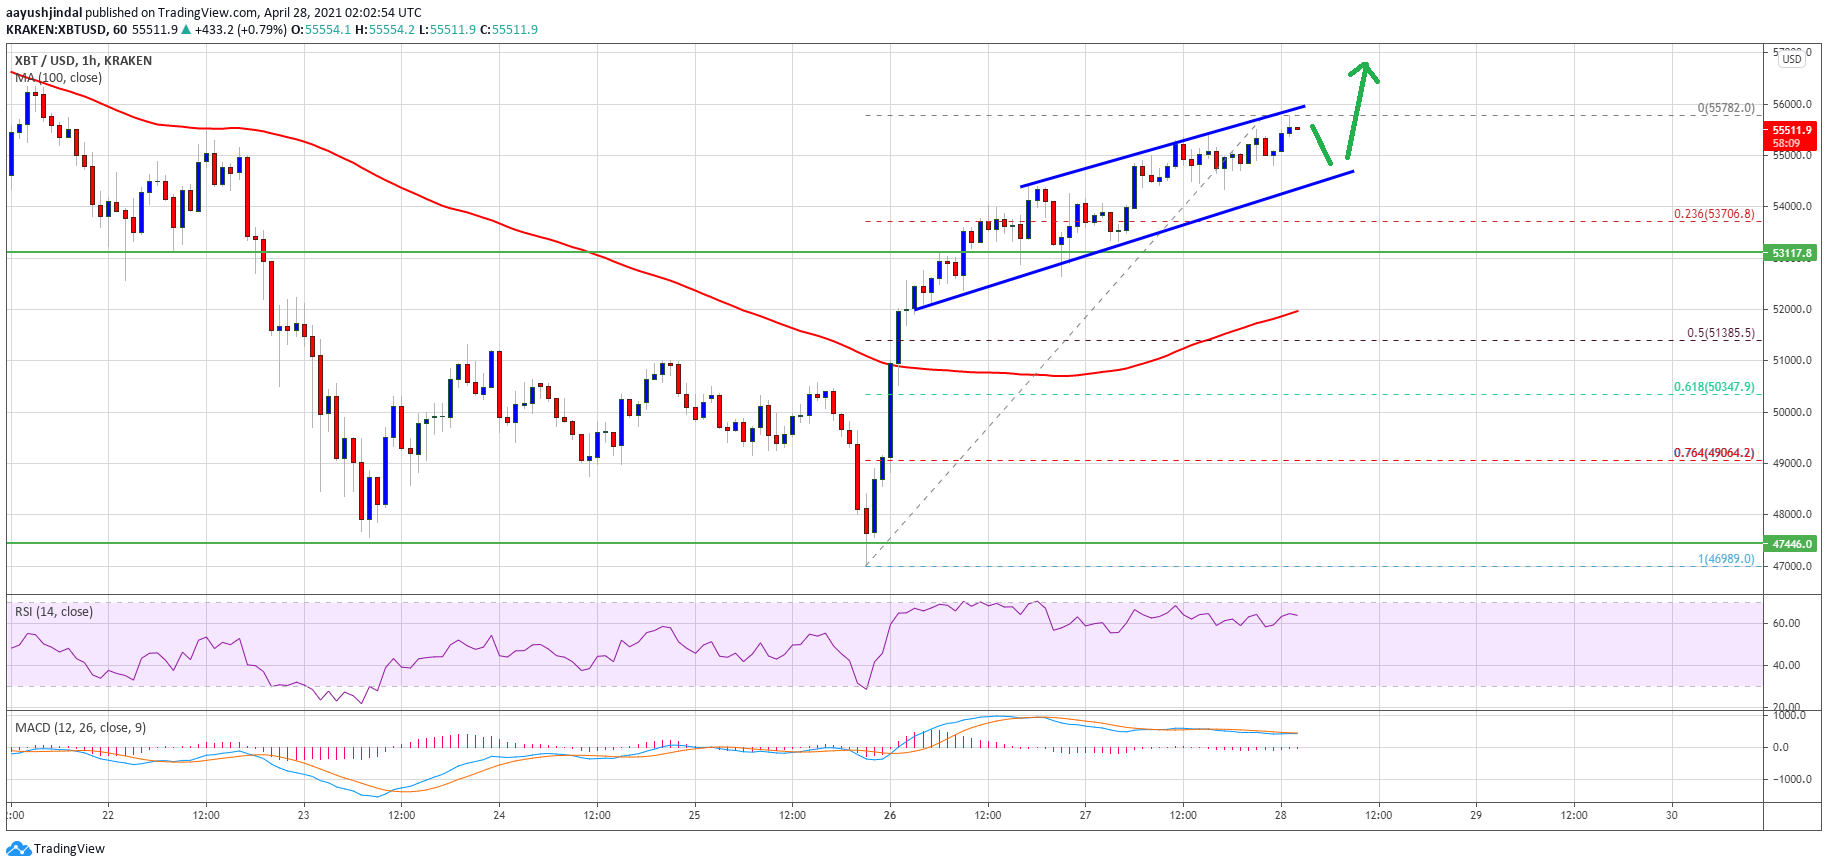
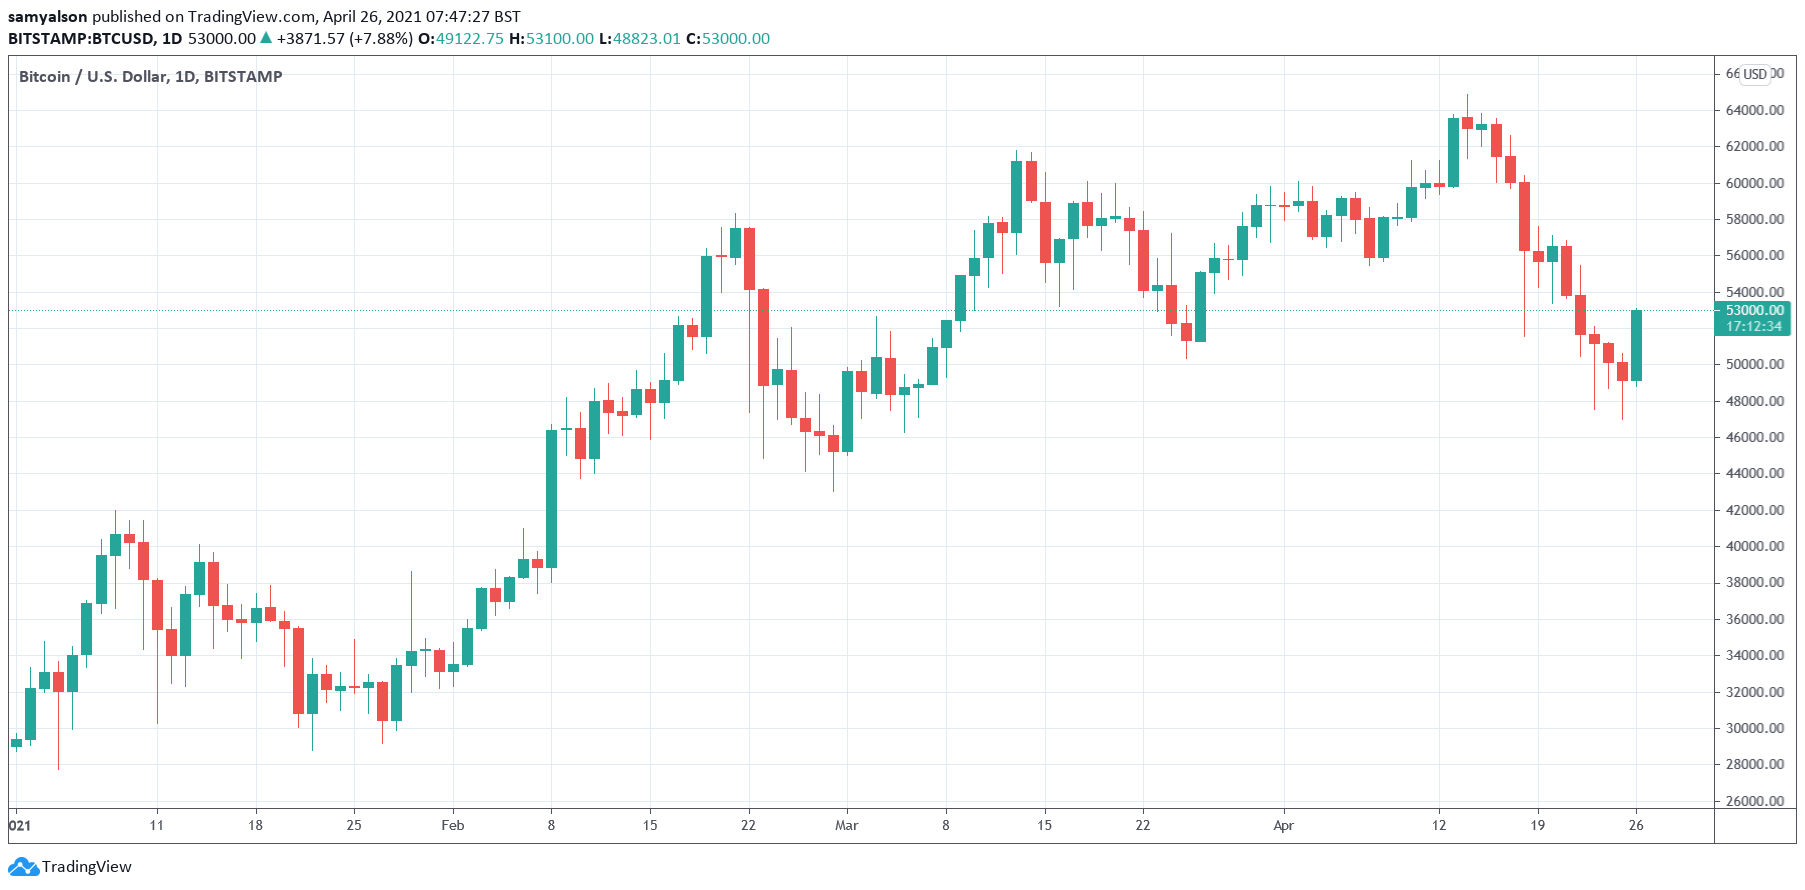
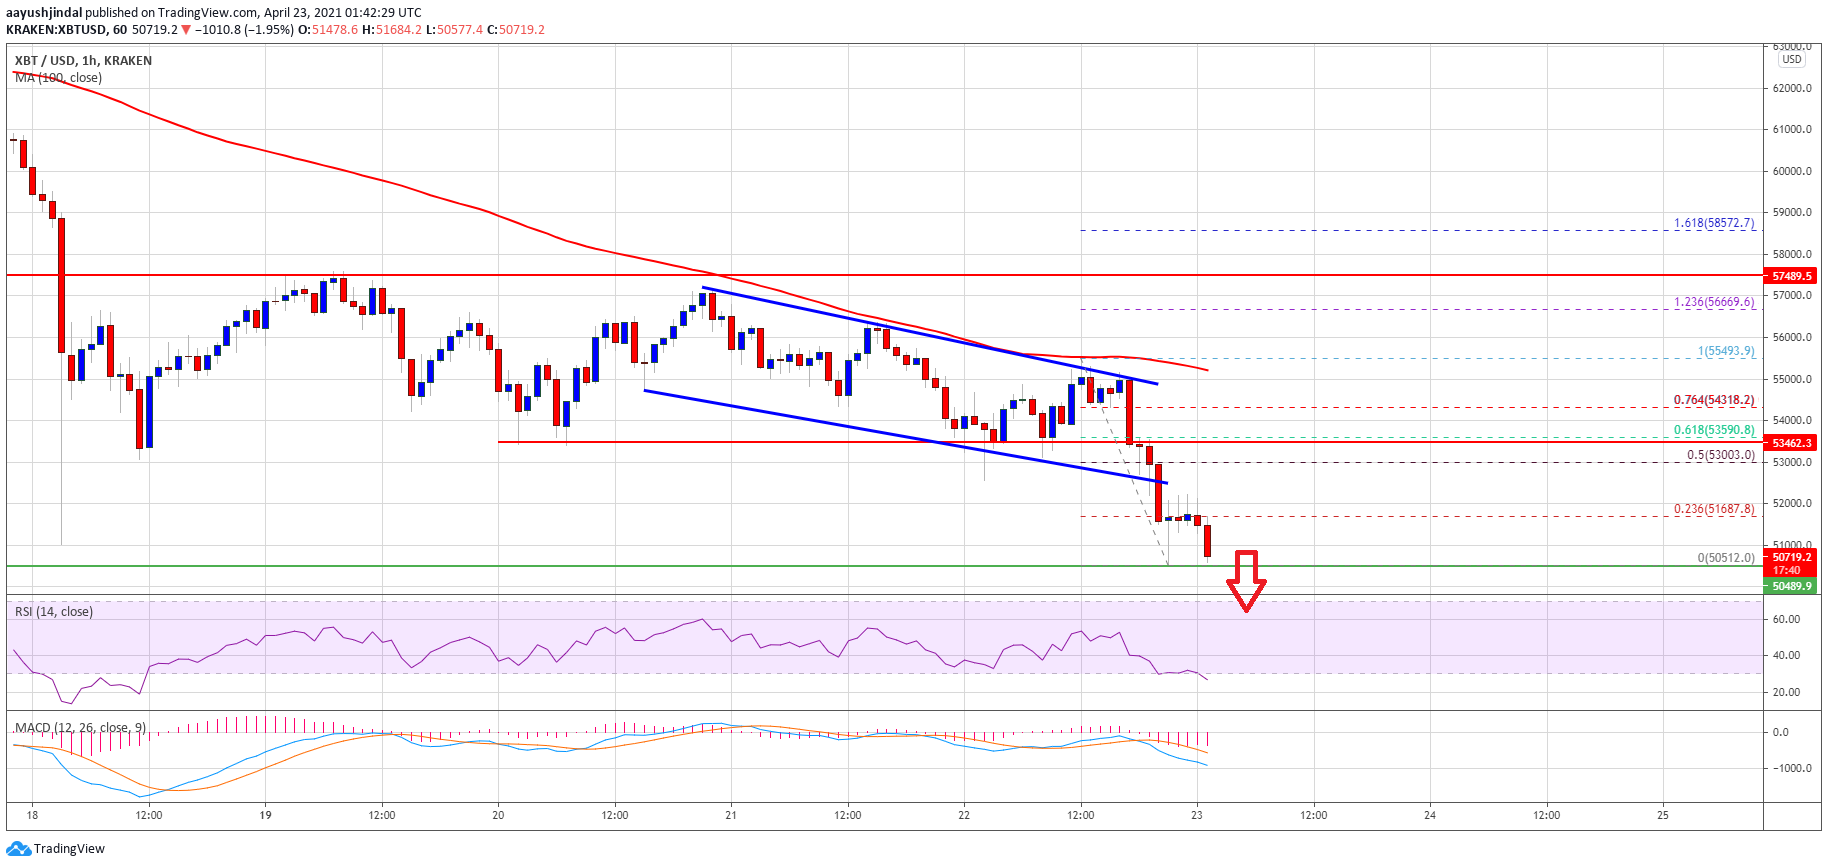
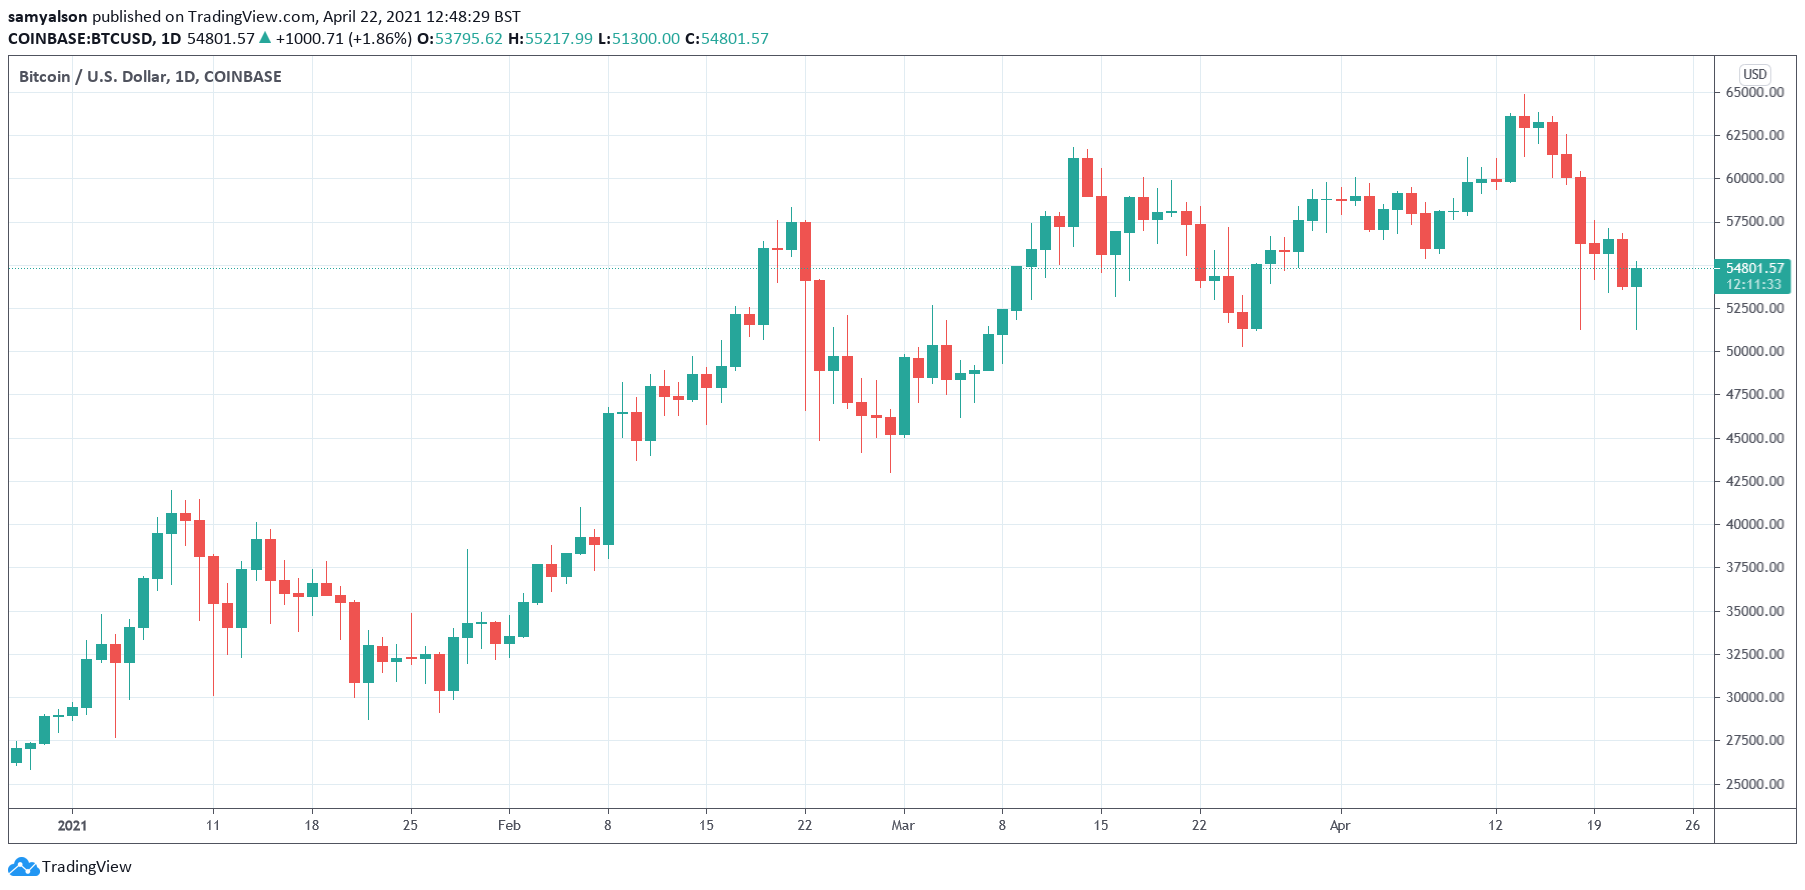
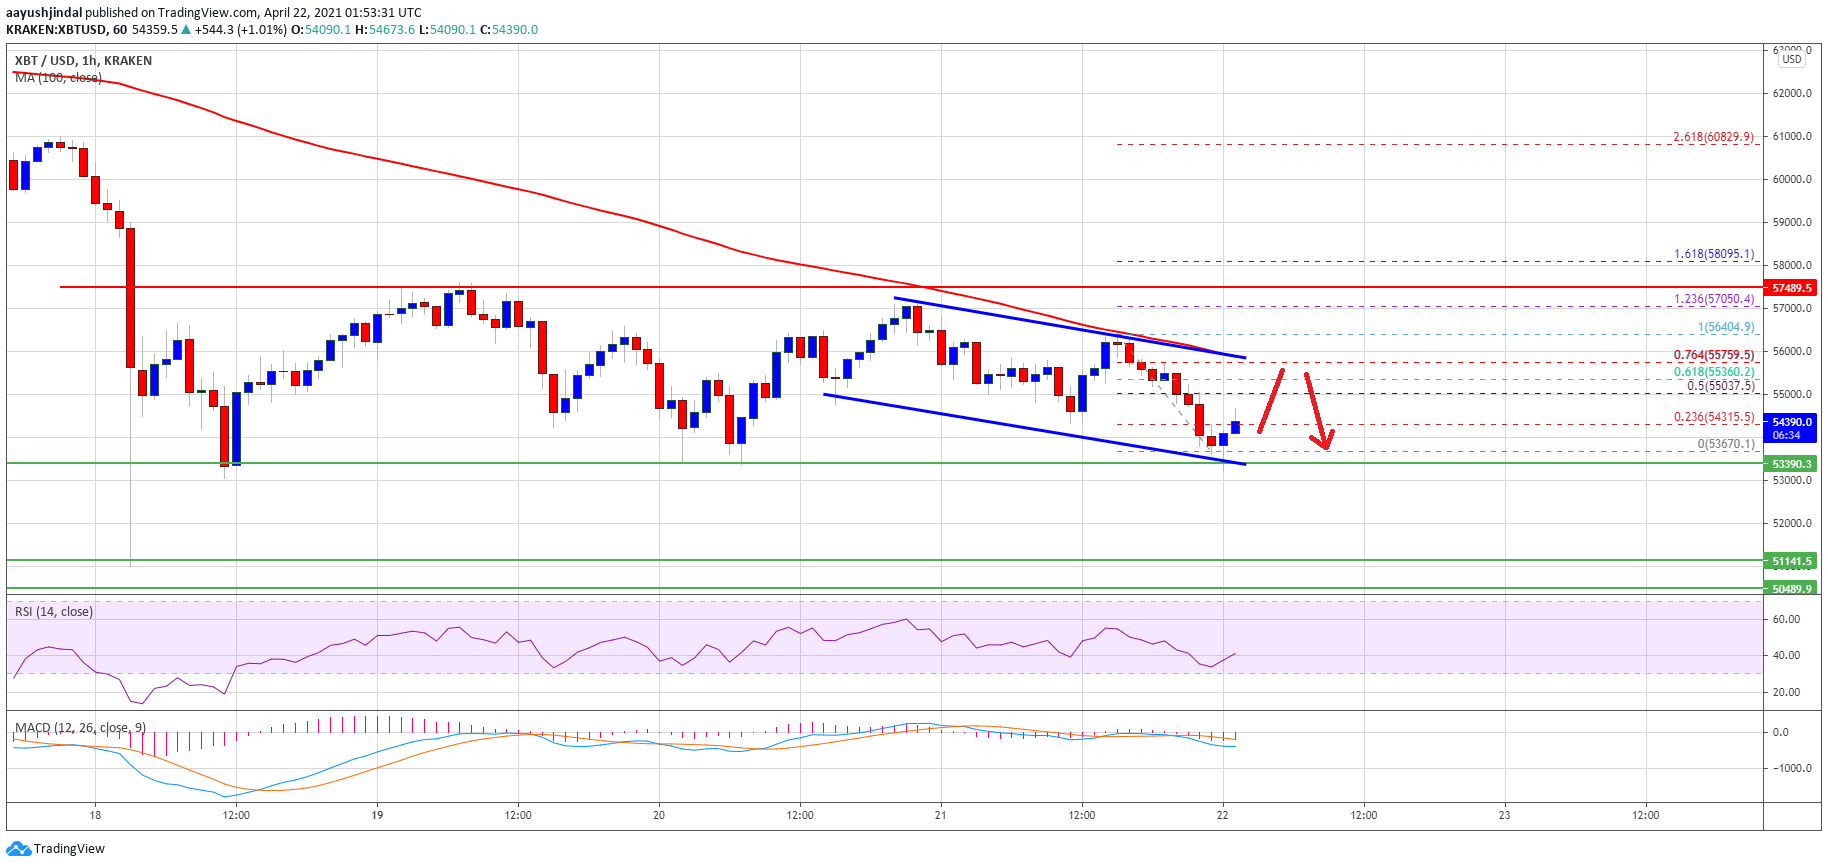
Source: BTCUSD on TradingView.com