The current boring crypto market could last between one to six months, and the sentiment will be the most negative right before the turnaround, one hedge fund manager said.
Wyckoff ‘SOS’ Could Catapult Bitcoin To $100,000: Hedge Fund Manager
Charles Edwards, founder of the Bitcoin and digital asset hedge fund Capriole Investments, published a detailed examination of Bitcoin’s current market phase suggesting a bullish trajectory, potentially reaching the $100,000 mark. The analysis hinges on the identification of a Wyckoff ‘Sign of Strength’ (SOS), a concept derived from the century-old Wyckoff Method that studies supply and demand dynamics to forecast price movements.
Understanding The Wyckoff ‘SOS’: Bitcoin To $100,000?
The Wyckoff Method, developed by Richard D. Wyckoff, is a framework for understanding market structures and predicting future price movements through the analysis of price action, volume, and time. The ‘Sign of Strength’ (SOS) within this methodology signifies a point where the market shows evidence of demand overpowering supply, indicating a strong bullish outlook.
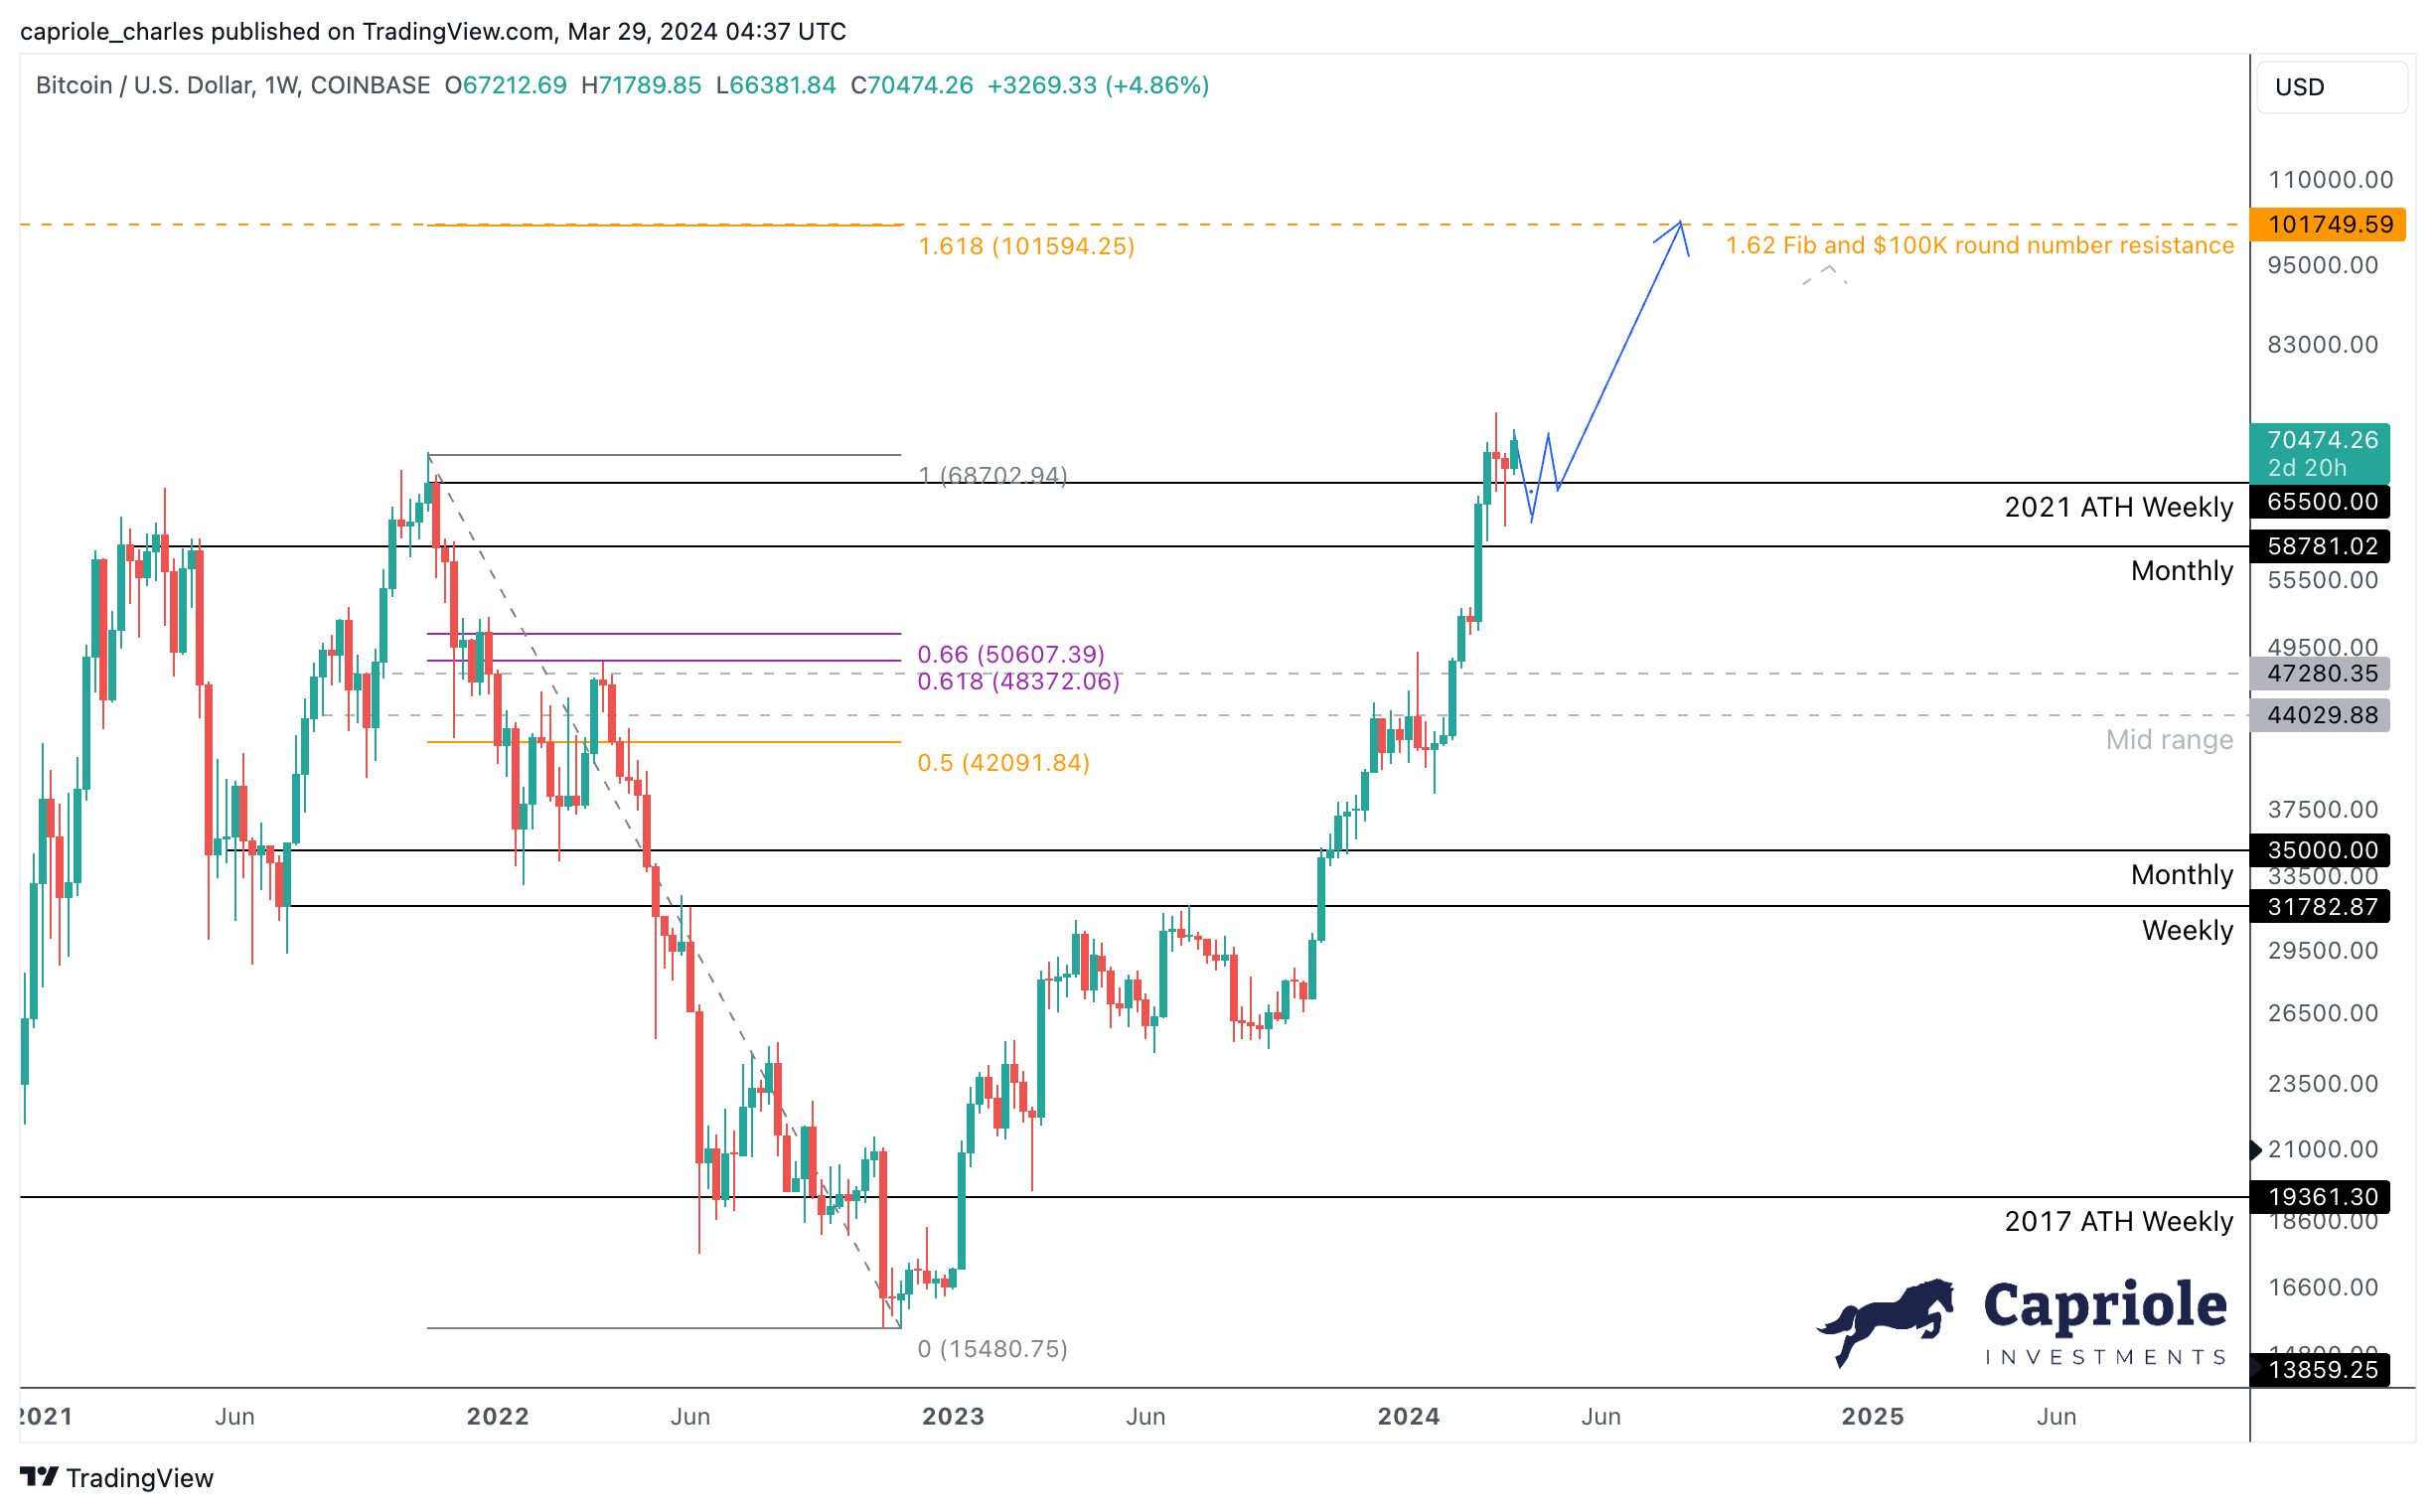
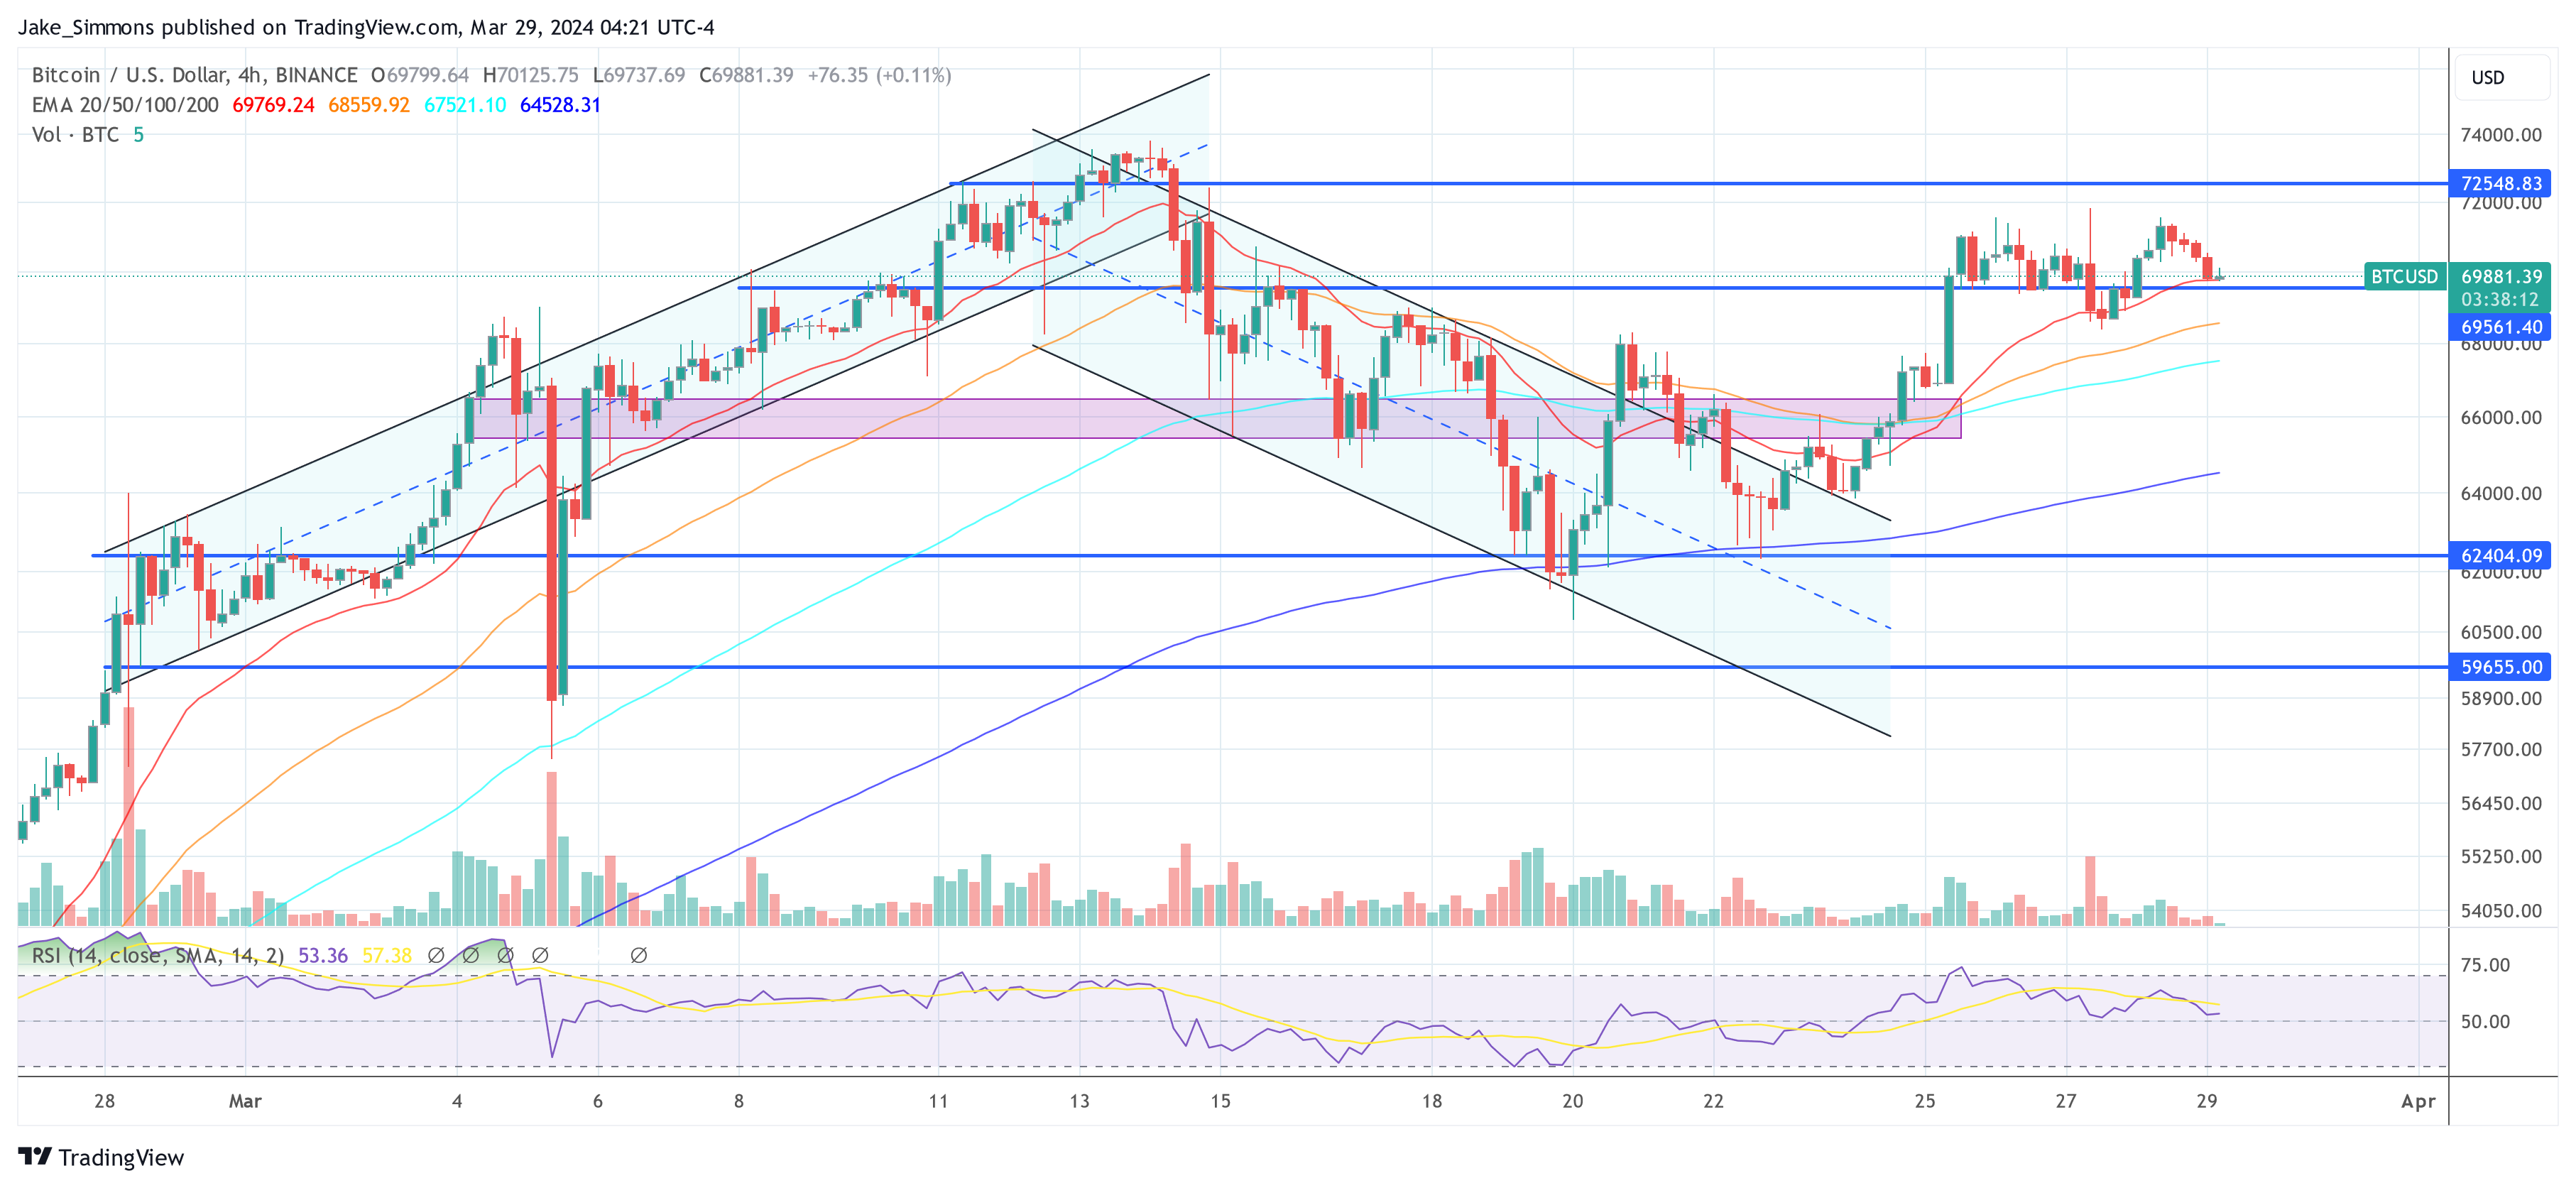
Edwards’s observation of an SOS pattern in Bitcoin’s recent price movements suggests that the market is at a pivotal point, where sustained upward momentum is highly probable. In Capriole’s latest newsletter, Edwards offered a precise depiction of Bitcoin’s market behavior, highlighting a period of volatility and consolidation in the $60,000 to $70,000 range.
This phase was anticipated by the hedge fund. Currently, as Bitcoin ventures above its last cycle’s all-time highs, it aligns with the predicted zig-zag SOS structure. Edwards elucidates, “It would not be surprising to see a liquidity grab at / into all-time highs […] All consolidation above the Monthly level at $56K is extremely bullish. It would be uncommon (but not impossible) for price to continue in a straight line up.”
The “zig-zag” phase also perfectly aligns with the halving cycle as BTC tends to consolidate “both months either side of the Halving.” Edwards added that “the realities of a much lower supply growth rate + unlocked pent up tradfi demand will then kick-in and launch 12 months of historically the best risk-reward period for Bitcoin.”
From a technical perspective, Bitcoin’s foray into price discovery territory above $70,000 is devoid of significant resistance levels. This opens a pathway to psychological and Fibonacci extension levels, with Edwards pinpointing $100,000 as the next major psychological resistance.
The 1.618 Fibonacci extension from the 2021 high to the 2022 low is noted at $101,750, serving as a technical marker for potential resistance. Edwards reflects on investor sentiment, stating, “You can also imagine quite a few investors would be happy seeing six-digit Bitcoin and taking profit in that zone,” acknowledging the psychological impact of such milestones.
BTC Fundamentals Support The Bull Case
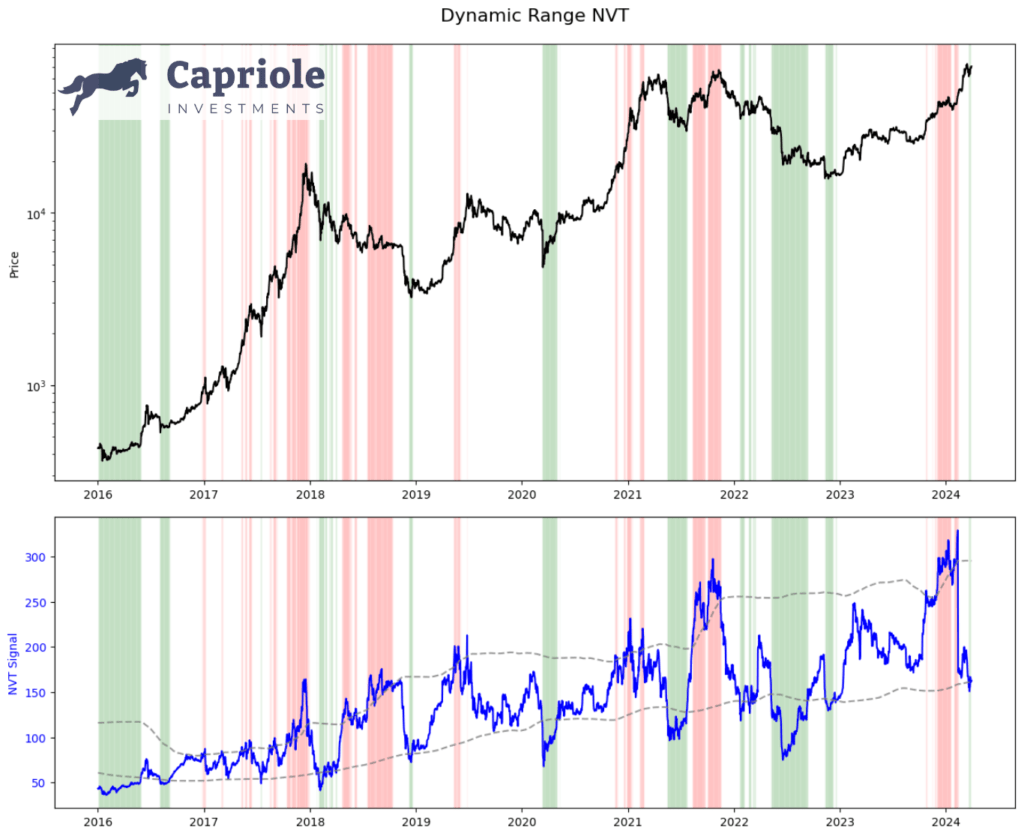
Edwards also delves into the importance of fundamentals, underscoring their role in providing a bullish backdrop for Bitcoin. The introduction of the Dynamic Range NVT (DRNVT), a unique metric to Capriole, indicates that Bitcoin is currently undervalued. Edwards describes DRNVT as “Bitcoin’s ‘PE Ratio’”, which assesses the network’s value by comparing on-chain transaction throughput to market capitalization.
The current DRNVT readings suggest an attractive investment opportunity, given Bitcoin’s undervaluation at all-time price highs. “What’s fascinating at this point of the cycle is that DRNVT is currently in a value zone. With price at all time highs, this is a promising and unusual reading for the opportunity that lies ahead in 2024. It’s something we didn’t see in 2016 nor 2020,” Edwards remarked.
With both technical indicators and fundamental analysis signaling a bullish future for Bitcoin, the anticipation surrounding the upcoming Halving event adds further momentum to the positive outlook. Despite the expectation of volatility and consolidation in the short term, Edwards confidently states, “probabilities are starting to skew to the upside once again.”
At press time, BTC traded at $69,981.
Wyckoff ‘SOS’ Could Catapult Bitcoin To $100,000: Hedge Fund Manager
Charles Edwards, founder of the Bitcoin and digital asset hedge fund Capriole Investments, published a detailed examination of Bitcoin’s current market phase suggesting a bullish trajectory, potentially reaching the $100,000 mark. The analysis hinges on the identification of a Wyckoff ‘Sign of Strength’ (SOS), a concept derived from the century-old Wyckoff Method that studies supply and demand dynamics to forecast price movements.
Understanding The Wyckoff ‘SOS’: Bitcoin To $100,000?
The Wyckoff Method, developed by Richard D. Wyckoff, is a framework for understanding market structures and predicting future price movements through the analysis of price action, volume, and time. The ‘Sign of Strength’ (SOS) within this methodology signifies a point where the market shows evidence of demand overpowering supply, indicating a strong bullish outlook.
Edwards’s observation of an SOS pattern in Bitcoin’s recent price movements suggests that the market is at a pivotal point, where sustained upward momentum is highly probable. In Capriole’s latest newsletter, Edwards offered a precise depiction of Bitcoin’s market behavior, highlighting a period of volatility and consolidation in the $60,000 to $70,000 range.
This phase was anticipated by the hedge fund. Currently, as Bitcoin ventures above its last cycle’s all-time highs, it aligns with the predicted zig-zag SOS structure. Edwards elucidates, “It would not be surprising to see a liquidity grab at / into all-time highs […] All consolidation above the Monthly level at $56K is extremely bullish. It would be uncommon (but not impossible) for price to continue in a straight line up.”
The “zig-zag” phase also perfectly aligns with the halving cycle as BTC tends to consolidate “both months either side of the Halving.” Edwards added that “the realities of a much lower supply growth rate + unlocked pent up tradfi demand will then kick-in and launch 12 months of historically the best risk-reward period for Bitcoin.”
From a technical perspective, Bitcoin’s foray into price discovery territory above $70,000 is devoid of significant resistance levels. This opens a pathway to psychological and Fibonacci extension levels, with Edwards pinpointing $100,000 as the next major psychological resistance.
The 1.618 Fibonacci extension from the 2021 high to the 2022 low is noted at $101,750, serving as a technical marker for potential resistance. Edwards reflects on investor sentiment, stating, “You can also imagine quite a few investors would be happy seeing six-digit Bitcoin and taking profit in that zone,” acknowledging the psychological impact of such milestones.
BTC Fundamentals Support The Bull Case
Edwards also delves into the importance of fundamentals, underscoring their role in providing a bullish backdrop for Bitcoin. The introduction of the Dynamic Range NVT (DRNVT), a unique metric to Capriole, indicates that Bitcoin is currently undervalued. Edwards describes DRNVT as “Bitcoin’s ‘PE Ratio’”, which assesses the network’s value by comparing on-chain transaction throughput to market capitalization.
The current DRNVT readings suggest an attractive investment opportunity, given Bitcoin’s undervaluation at all-time price highs. “What’s fascinating at this point of the cycle is that DRNVT is currently in a value zone. With price at all time highs, this is a promising and unusual reading for the opportunity that lies ahead in 2024. It’s something we didn’t see in 2016 nor 2020,” Edwards remarked.
With both technical indicators and fundamental analysis signaling a bullish future for Bitcoin, the anticipation surrounding the upcoming Halving event adds further momentum to the positive outlook. Despite the expectation of volatility and consolidation in the short term, Edwards confidently states, “probabilities are starting to skew to the upside once again.”
At press time, BTC traded at $69,981.
Bitcoin Price Will Skyrocket To $280,000 Next Year: Hedge Fund Manager
Renowned crypto asset hedge fund manager Charles Edwards has made a bold prediction regarding the future price of Bitcoin. Edwards, founder of Capriole Investments, shared his insights via X (formerly Twitter), outlining a compelling case for Bitcoin’s potential to reach $280,000 in the coming year.
In his statement, Edwards referenced historical data and several key factors that could drive Bitcoin’s price to new heights. He began by comparing Bitcoin’s performance after the 2020 halving event, stating, “If Bitcoin’s post halving returns are the same as 2020, we are looking at $280K Bitcoin next year.”
Bitcoin Price Could Top $300,000 Next Year
As the chart by Edwards shows, the third bull run in 2020 was rather subdued in comparison to the previous ones. The first bull market (halving cycle) in 2012 saw Bitcoin price peak at $1132, marking a dramatic increase of 8,996% over 11 months (335 days). The second bull run in 2016 ended in December 2017 when the price reached approximately $20,000, marking a 2,089% increase over 17 months (518 days).
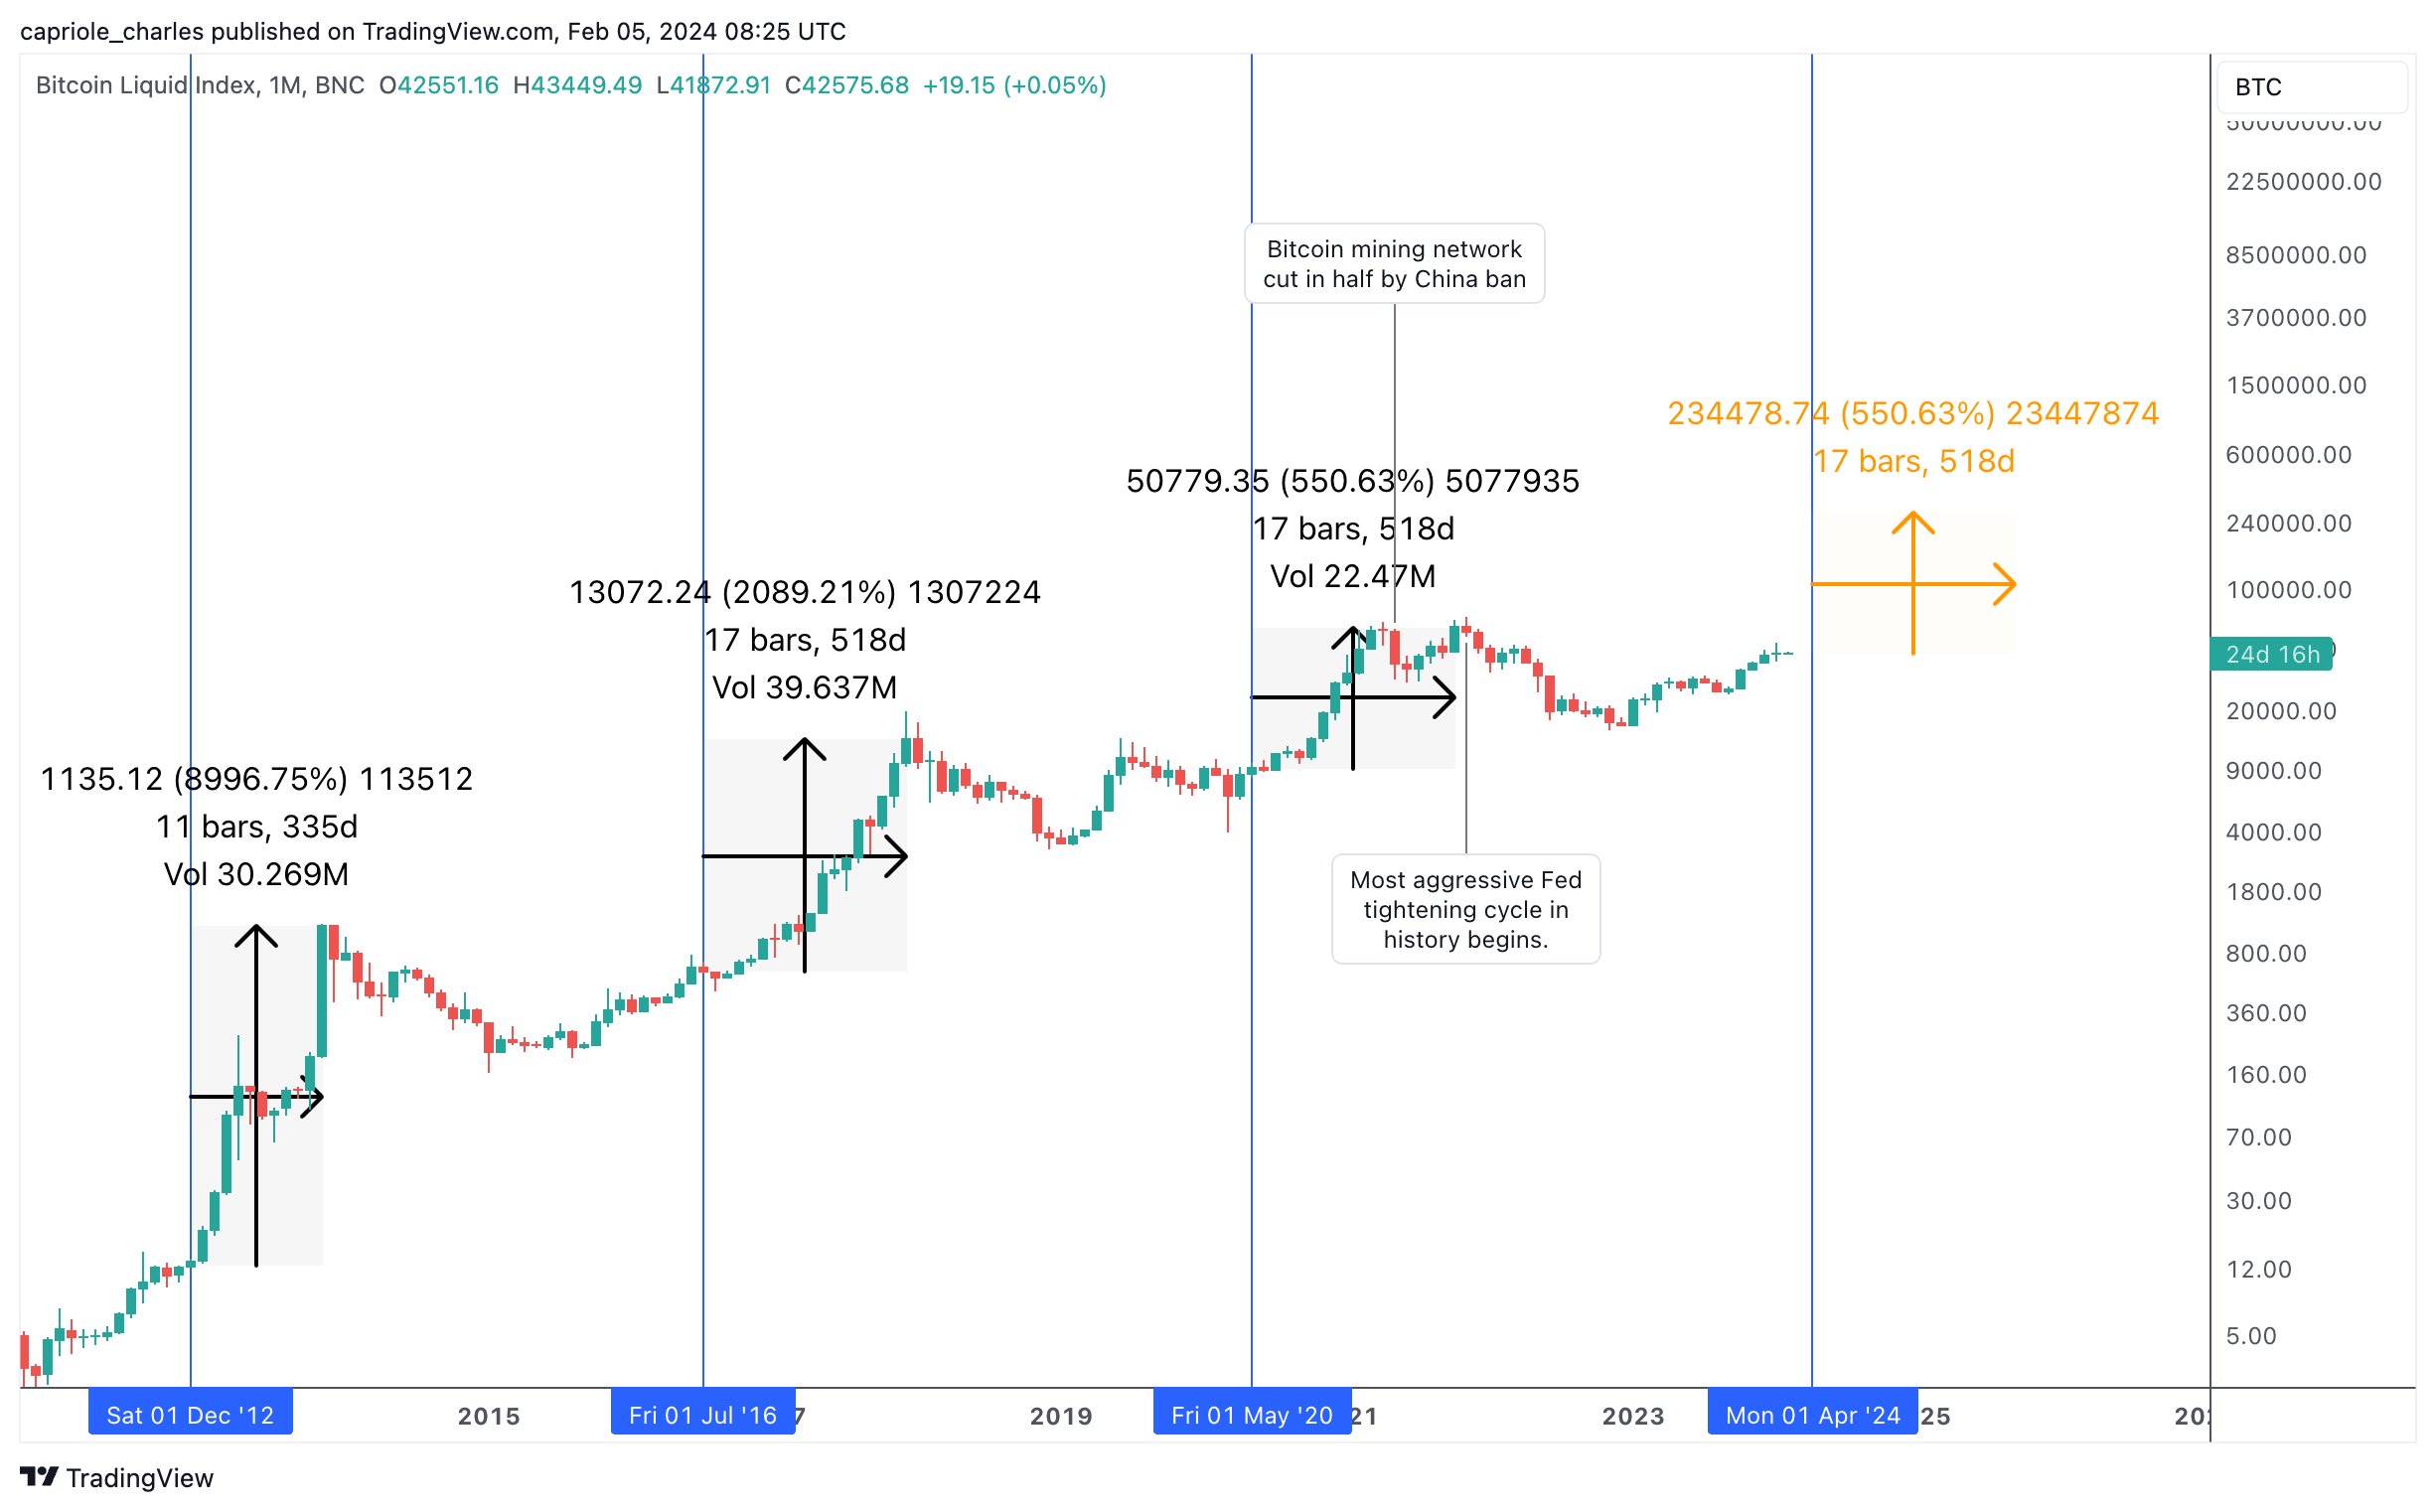
Edwards acknowledged that some might argue that profits diminish with each cycle. However, he made a counterpoint that 2020’s performance was pinned down due to main factors. First, Edwards attributed the lackluster performance of the 2020 bull market to China’s decision to ban Bitcoin mining, which led to a 50% reduction in hash rate and had a stifling effect on Bitcoin.
Second, he highlighted the aggressive tightening measures taken by the Federal Reserve, which negatively impacted Bitcoin’s performance during that period, stating, “2020 was the worst Bitcoin bull market in history. I believe overall performance was pinned down due to the -50% destruction of mining network by China and the most aggressive Fed tightening cycle in history.”
However, Edwards expressed optimism about the future, pointing to a contrasting economic landscape in 2024. He stated, “In fact, 2024 marks the polar opposite to 2021. QE has resumed and the Fed has started easing, with Fed chair Powell expecting 3 cuts this year. A weaker dollar = a stronger Bitcoin.”
He also compared the upcoming launch of Bitcoin ETFs in January to a “second halving,” highlighting the potential market impact, saying, “Further, I consider the January Bitcoin ETF launches as powerful as a ‘second halving’.”
Drawing parallels to the gold market, Edwards emphasized that Bitcoin’s current market cap of around $800 billion is significantly smaller than gold’s market cap when the GLD ETF launched in 2004.
He noted that gold experienced a parabolic rise of over 300% in just seven years following the launch of the ETF, stating, “With a market cap of around $3.3T, Gold commenced a parabolic rise of over 300% to $13T in under 7 years. Bitcoin’s market cap today is just over $800B. Smaller assets are generally capable of experiencing larger upside returns.”
Furthermore, Edwards underscored the rapid growth of Bitcoin, asserting that it is currently outpacing the adoption rate of the Internet, saying, “Bitcoin is currently growing faster than the Internet.”
The hedge fund manager concluded by summarizing his prediction, stating:
A 500% return over the 18 months following the halving would not be unusual for Bitcoin historically. An additional 300% return over the next 2-5 years from the ETFs alone would be a conservative assumption. When you drill it down to the two most important factors for Bitcoin this cycle, and add them together, it’s easy to arrive at a conservative Bitcoin price of $300K in the next couple of years.
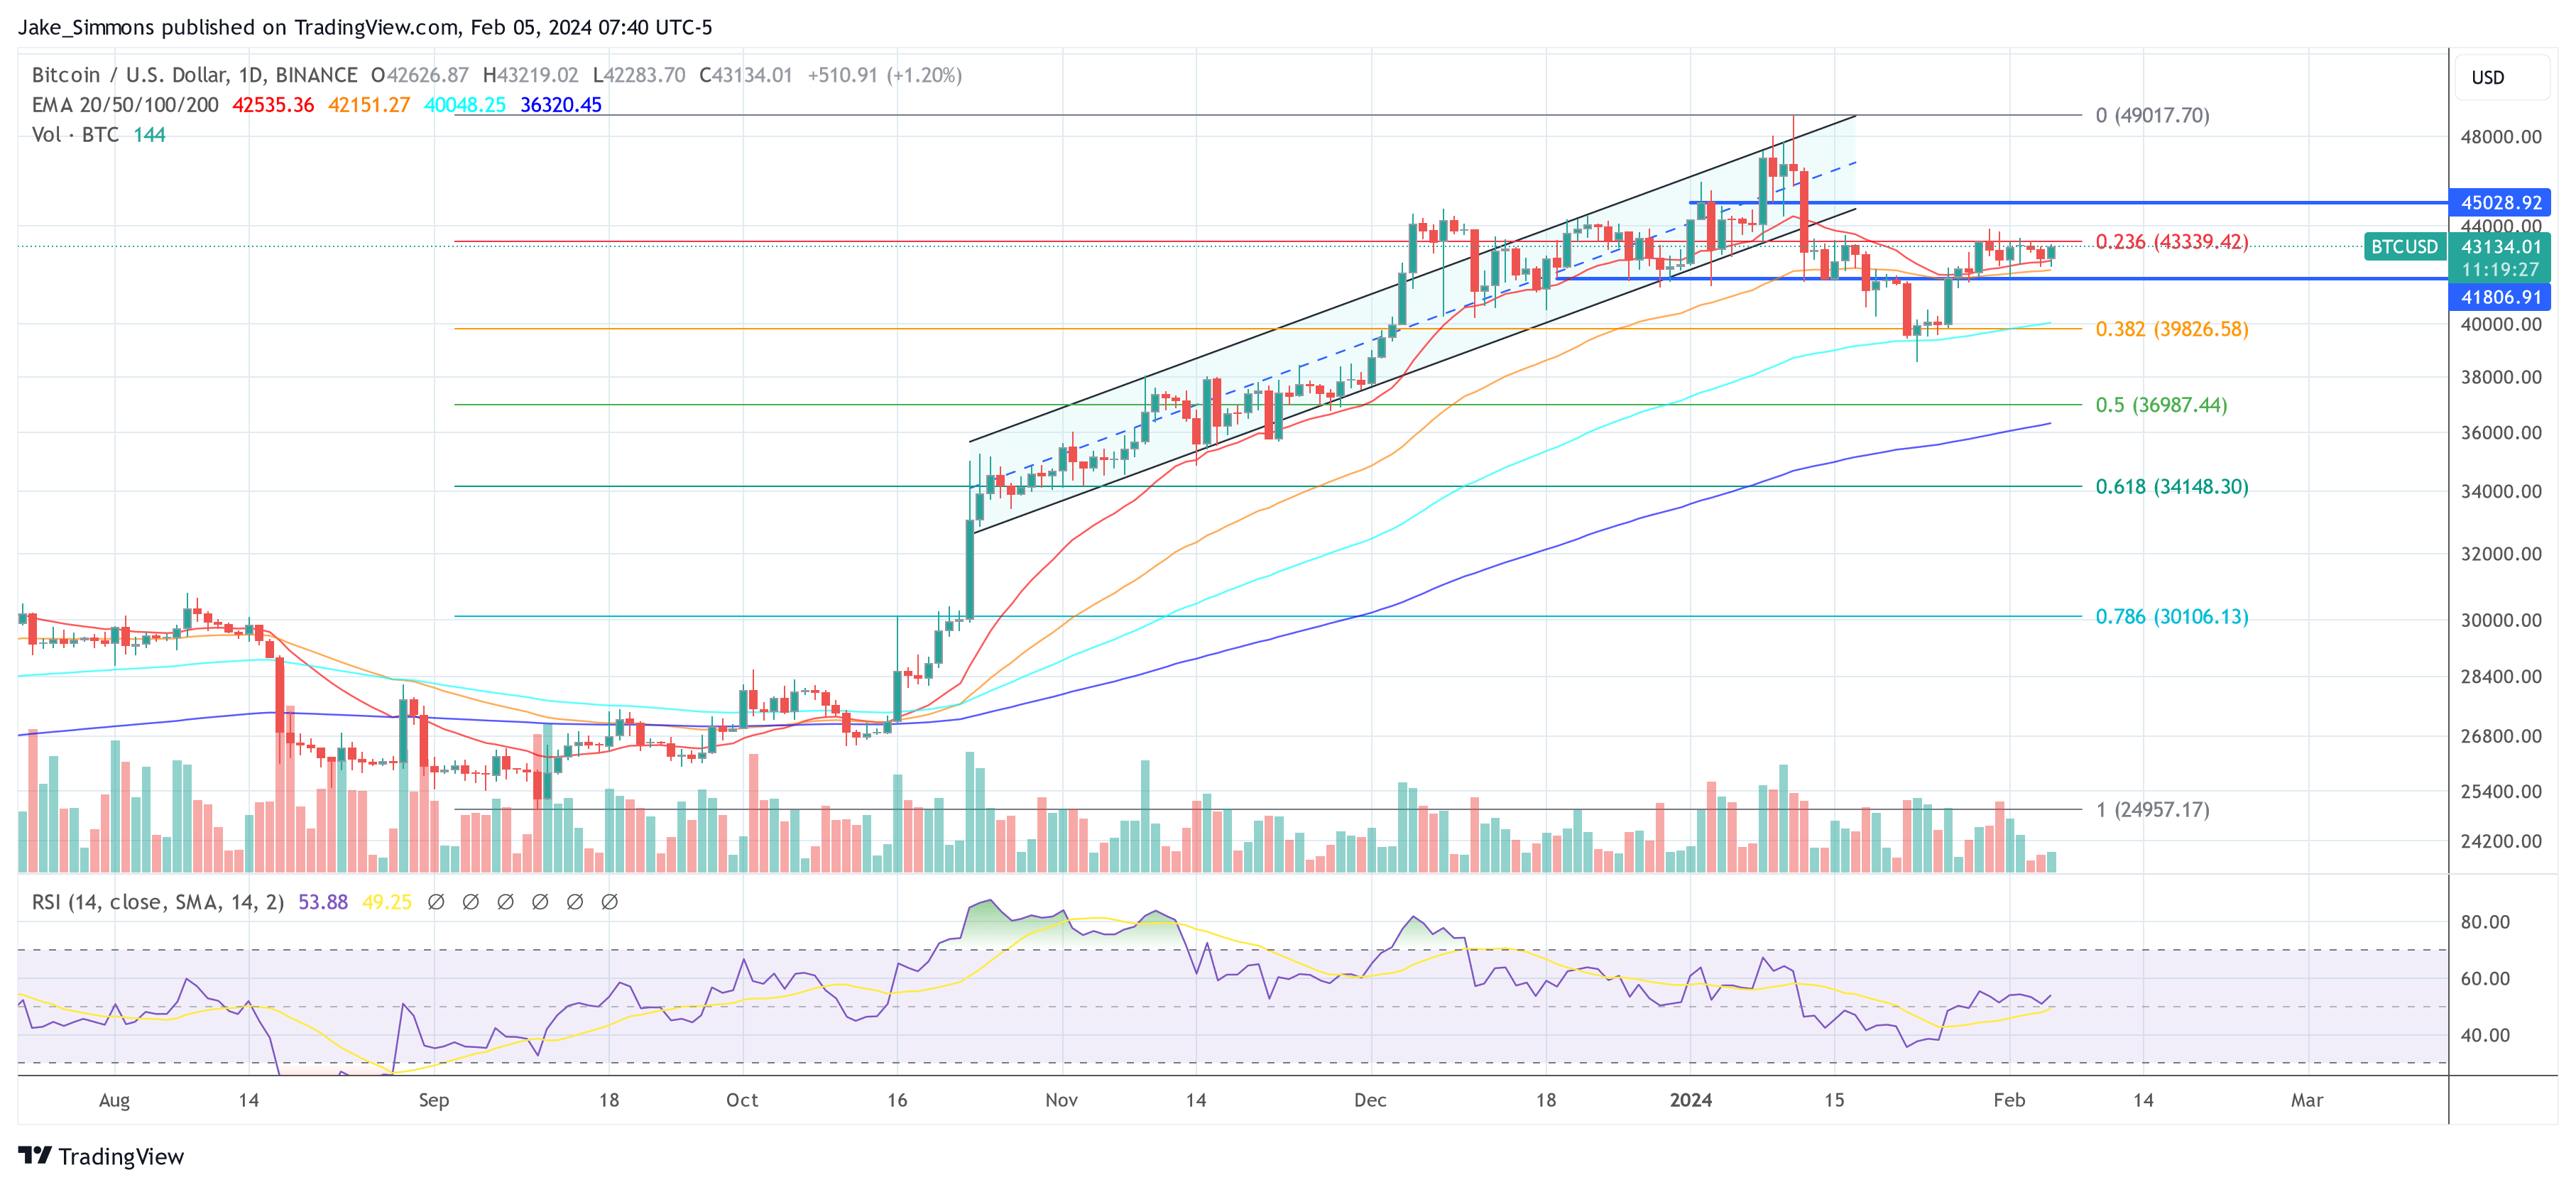
At press time, BTC traded at $43,134.
Bitcoin Macro Index Enters ‘Expansion’, Echoing 400% Bull Run Surge
In a detailed market update, Charles Edwards, founder of Capriole Investment, has provided an in-depth analysis of Bitcoin’s current market position, highlighting a pivotal shift to an ‘expansion’ phase in the Bitcoin Macro Index. This transition is particularly noteworthy as it parallels conditions observed prior to historical price surges in Bitcoin’s valuation.
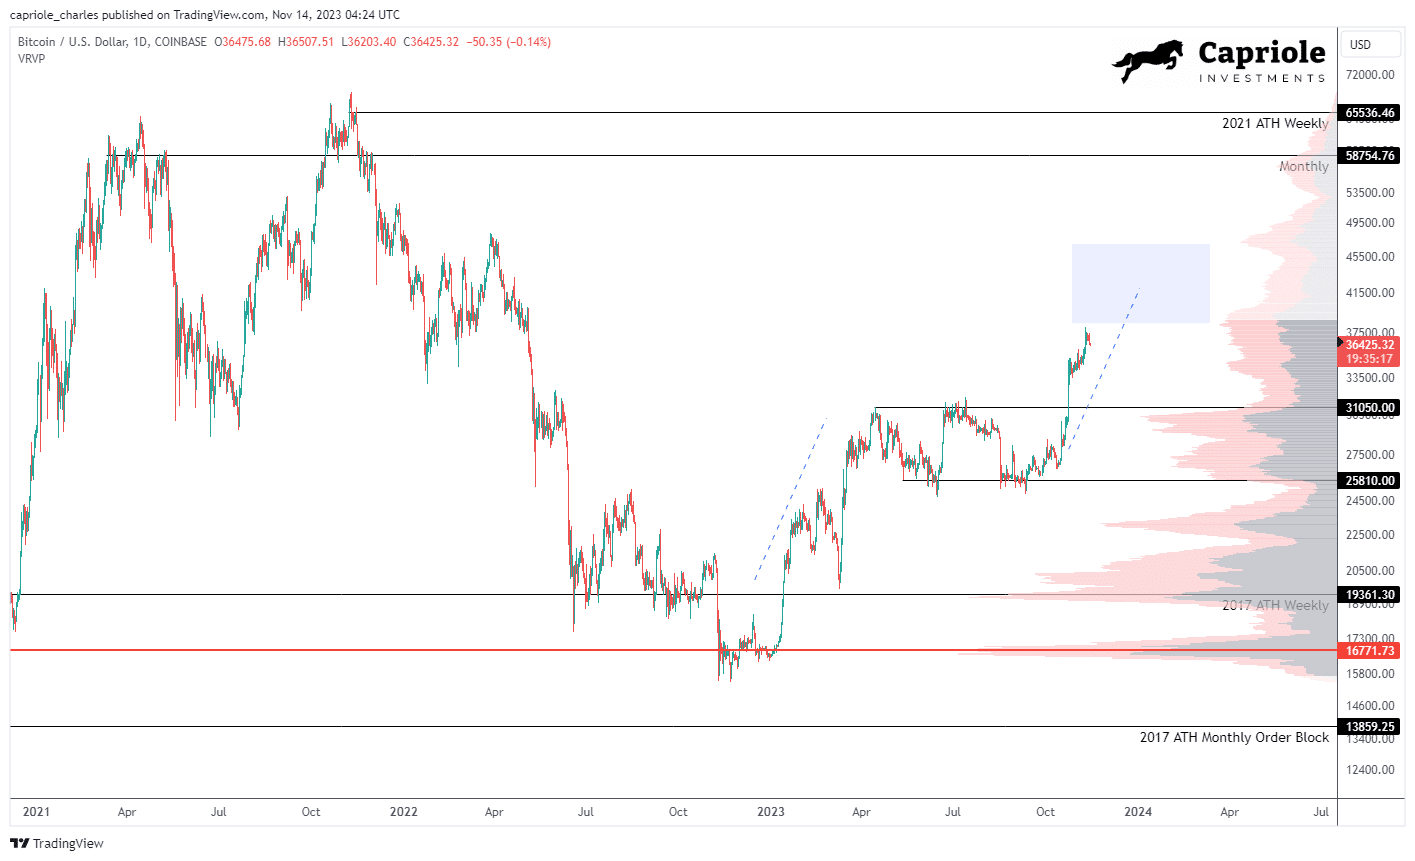
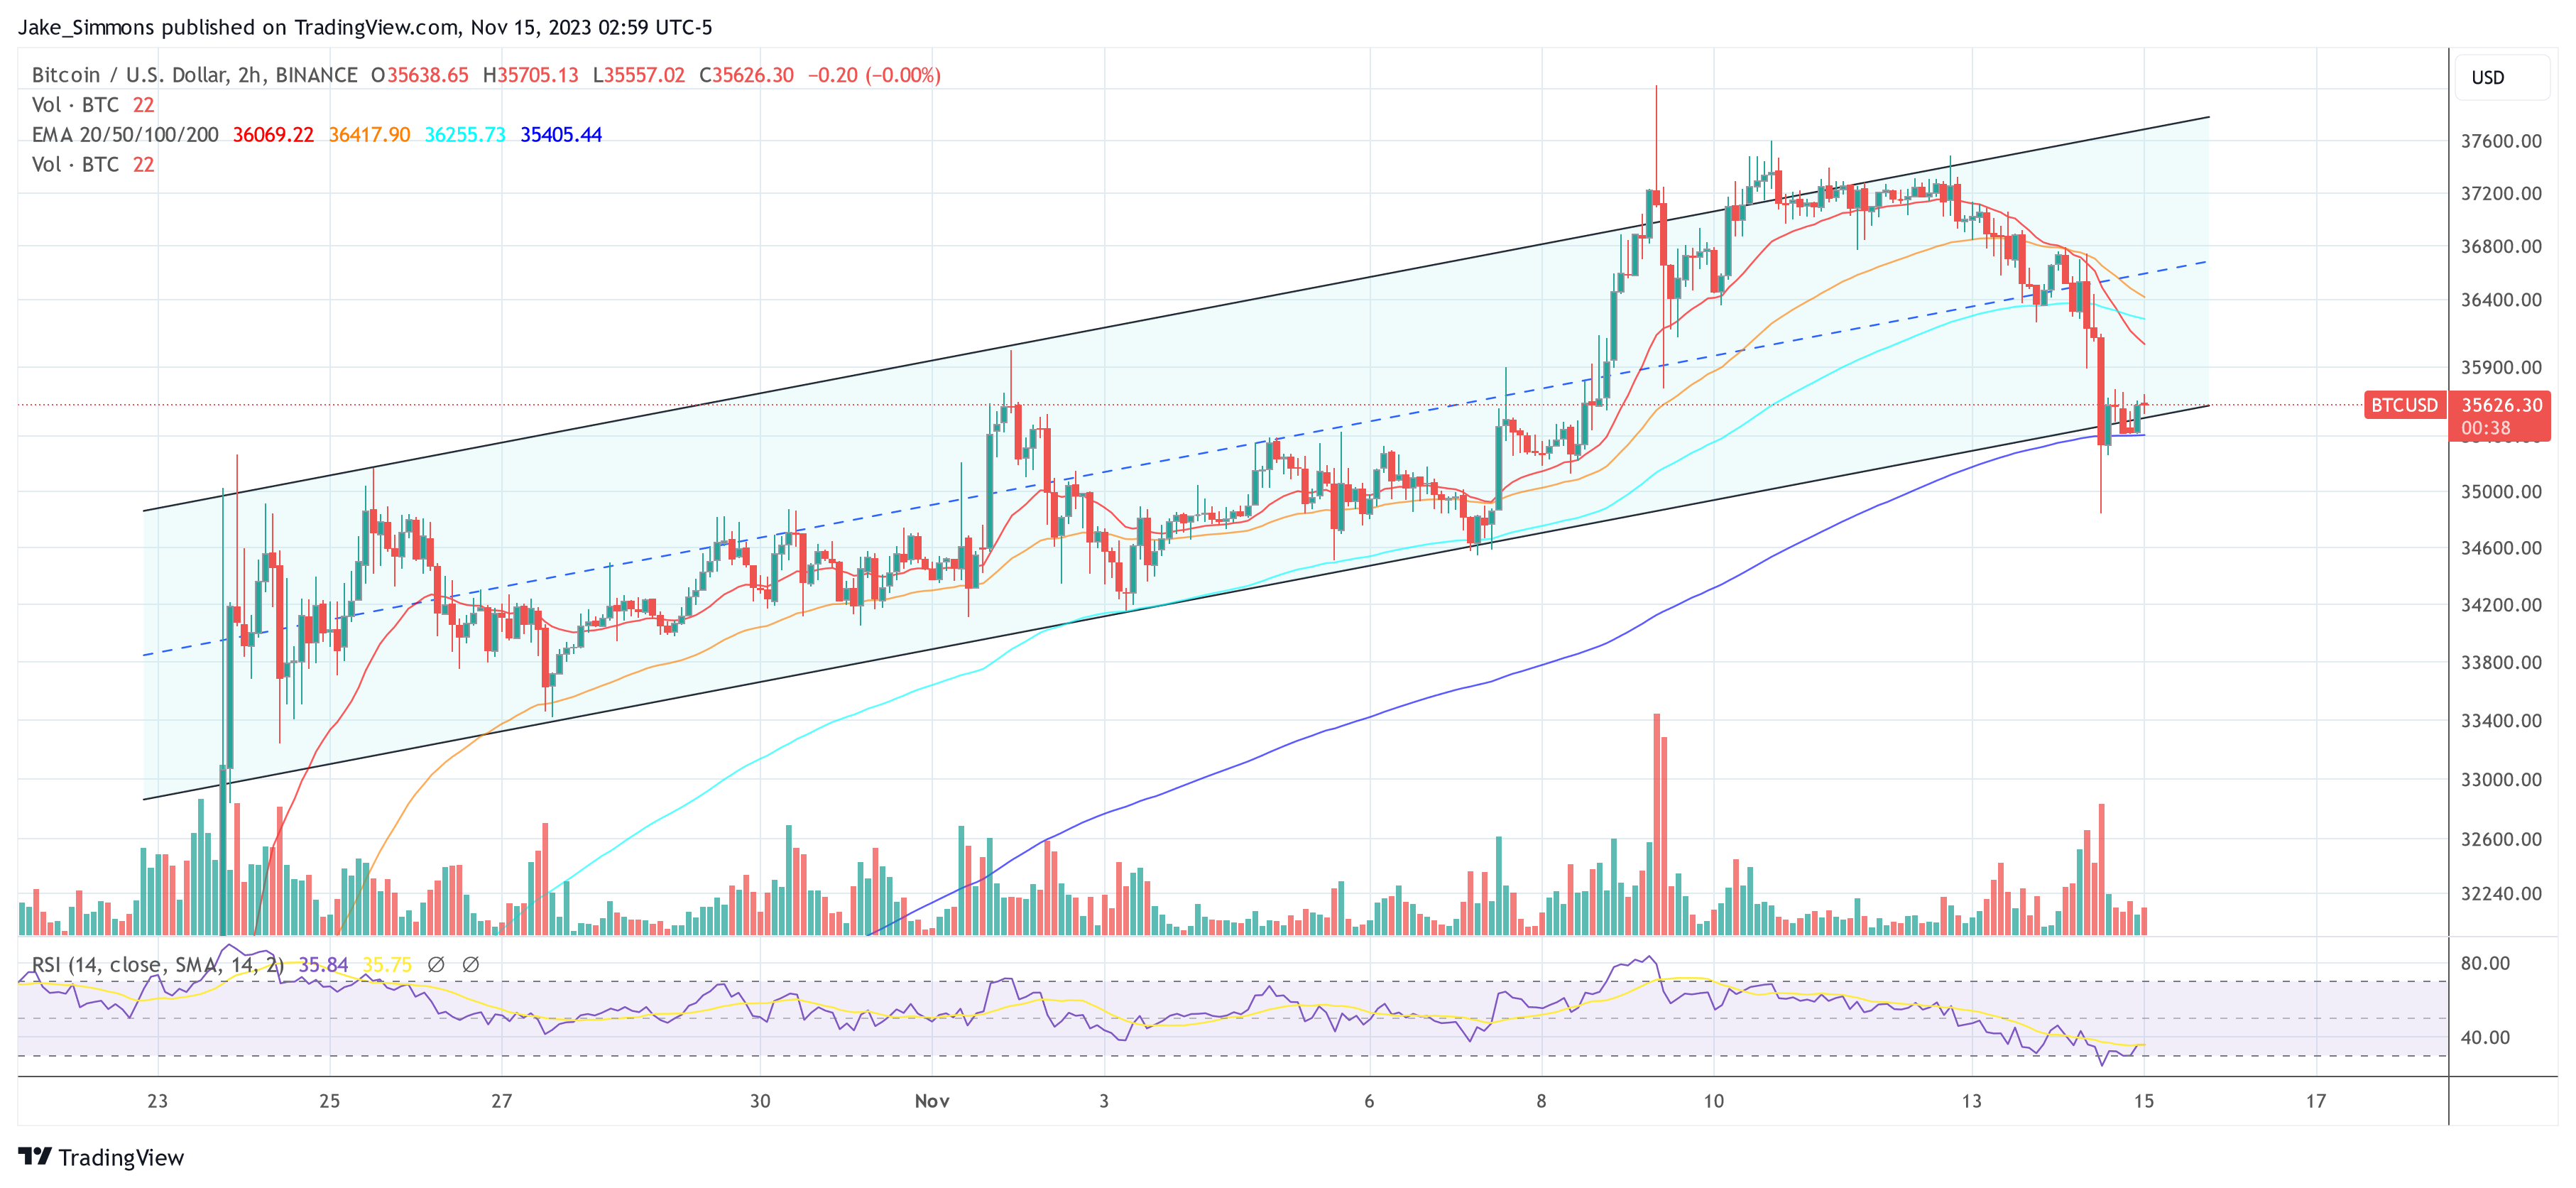
Bitcoin has recently experienced a sharp uptick, ascending from $34,000 to an interim high of $38,000. After a brief period of resistance, the price corrected to approximately $36,500. Edwards highlights this movement as a critical technical victory, with Bitcoin overcoming and holding above the major resistance benchmarks of $35,000 on both the weekly and monthly timeframes.
This consolidation above key resistance levels sets a bullish context in the high timeframe technical analysis, positioning Bitcoin in a strong technical stance according to traditional market indicators. “The recent breakout into the 2021 range offers the best high timeframe technical setup we have seen in years. Provided $35K holds on a weekly and monthly basis in November, the next significant resistance is range high ($58-65K).”
Bitcoin Macro Index Enters Expansion
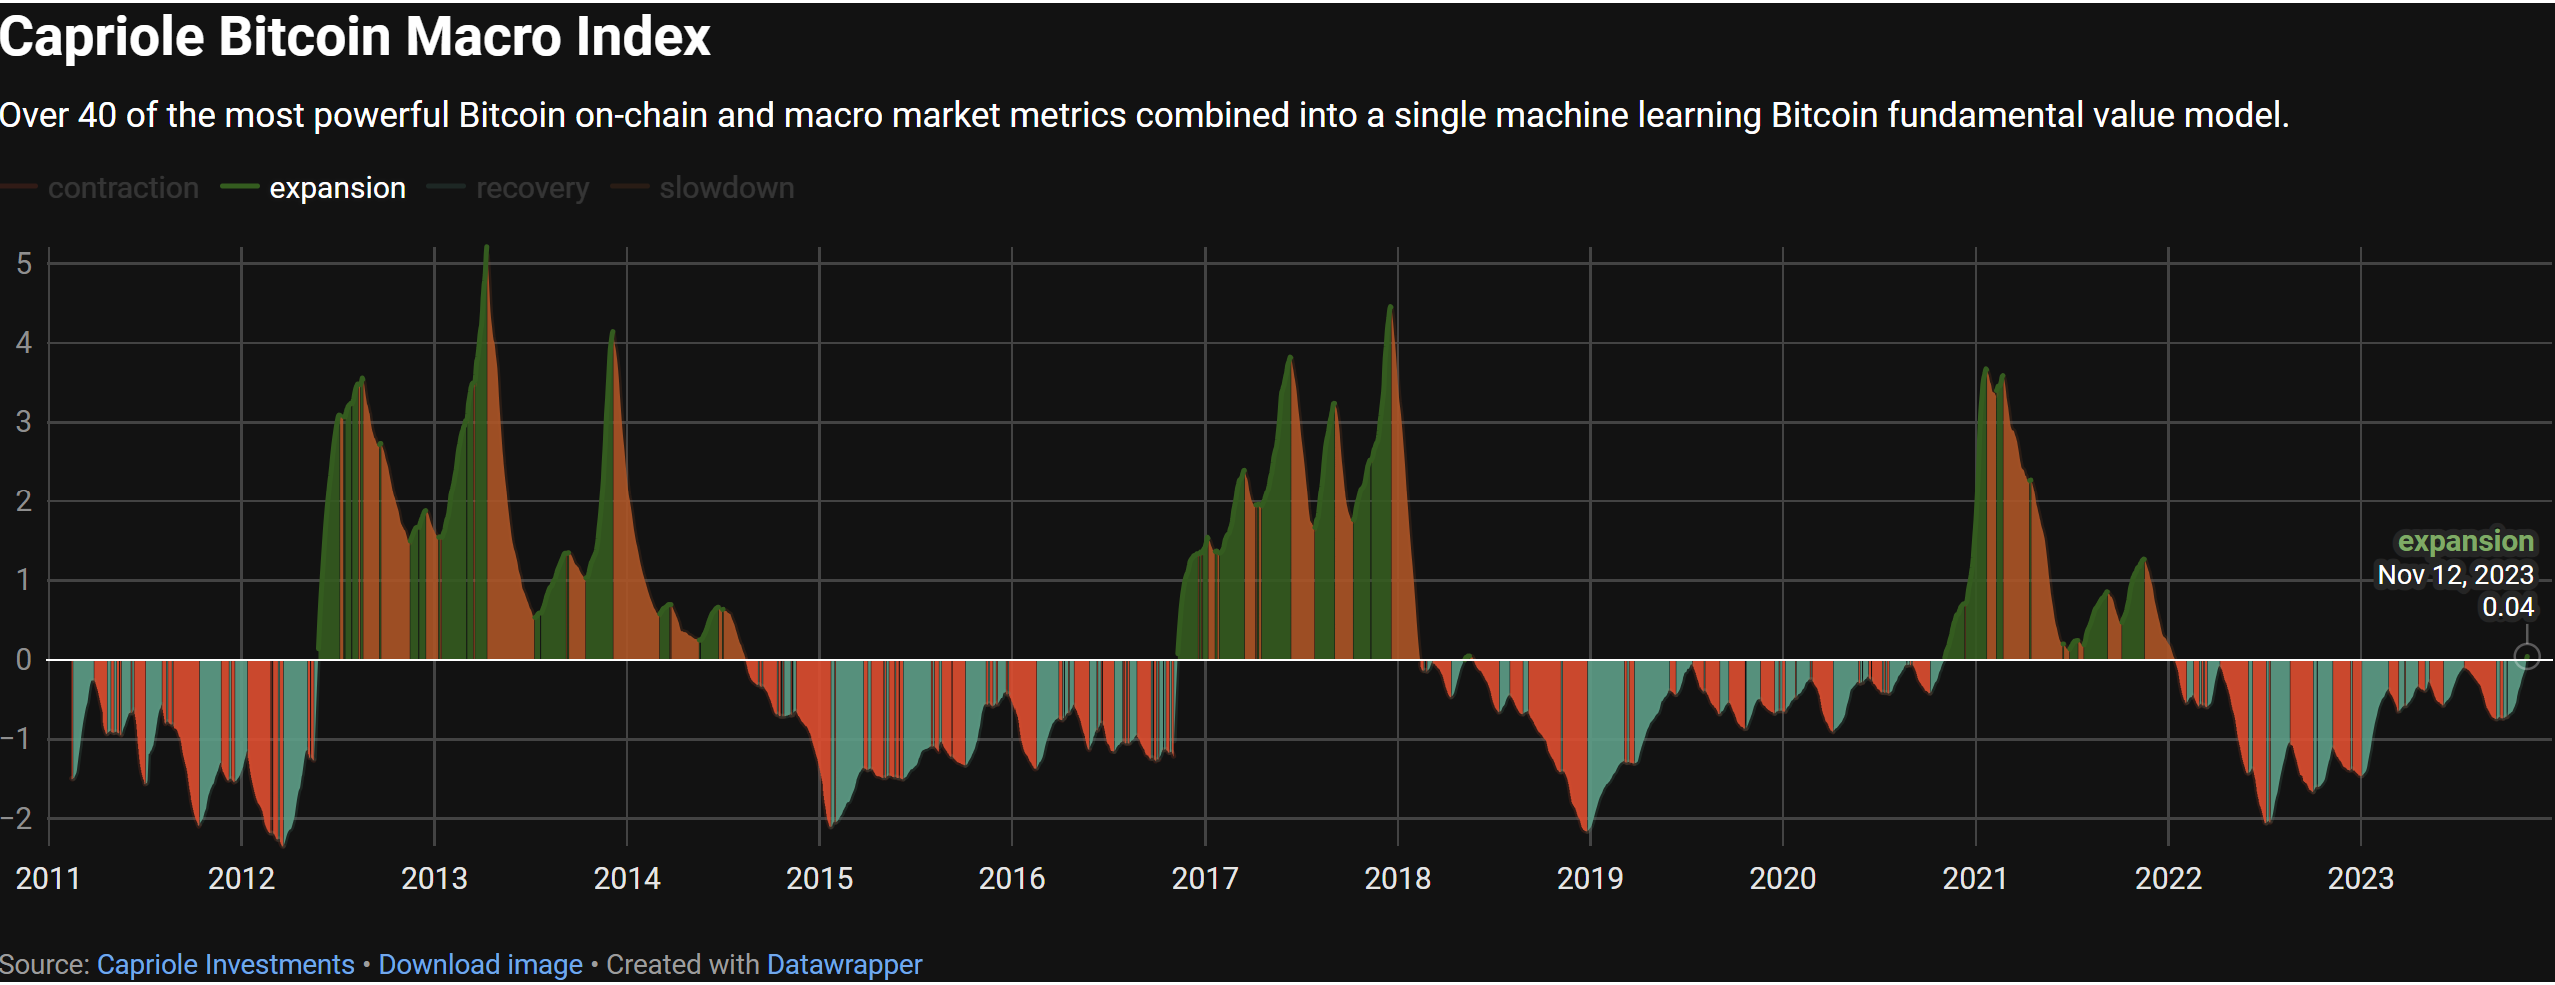
The crux of Edwards’ update is the shift in the Bitcoin Macro Index, a complex model synthesizing over 40 metrics encompassing Bitcoin’s on-chain data, macro market indicators, and equity market influences. The index does not take price as an input, thus providing a ‘pure fundamentals’ perspective.
The current expansion is the first since November 2020, and only the third instance since the index’s inception, with the two previous occasions leading to substantial price rallies in the following periods. Edwards elucidates this with a direct quote: “The transition from recovery to expansion is simply the optimal time to allocate to Bitcoin from a risk-reward opportunity for this model.”
A look at the Bitcoin chart reveals that the Bitcoin price rose by a whopping 400% during the last bull run from early November 2020 to November 2021, after the Macro Index entered the expansion phase. The first historical signal was provided by the Macro Index on November 9, 2016, which was followed by a massive bull run of almost 2,600% until Bitcoin reached its then all-time high of $20,000 in February 2018.
Short-Term Technicals And Derivatives Market Analysis
In the short term, the technical outlook presents a mixed picture, according to Edwards. The derivative markets are indicating an overheated state, with low timeframe analysis suggesting a retracement could be imminent. Edwards introduces the ‘Bitcoin Heater’ metric, recently launched on Capriole Charts, which aggregate various derivatives market data and quantify the level of market risk based on the open interest and heating level of perpetuals, futures, and options markets.
The below chart shows that most of the time when the Bitcoin Heater is above 0.8, the market corrects or consolidates. “But there are large exceptions to the rule: such as the primary bull market rally from November 2020 through to Q1 2021. […] We should expect this metric to be high more frequently in 2024 (much like Q4 2020 – 2021),” Edwards stated.
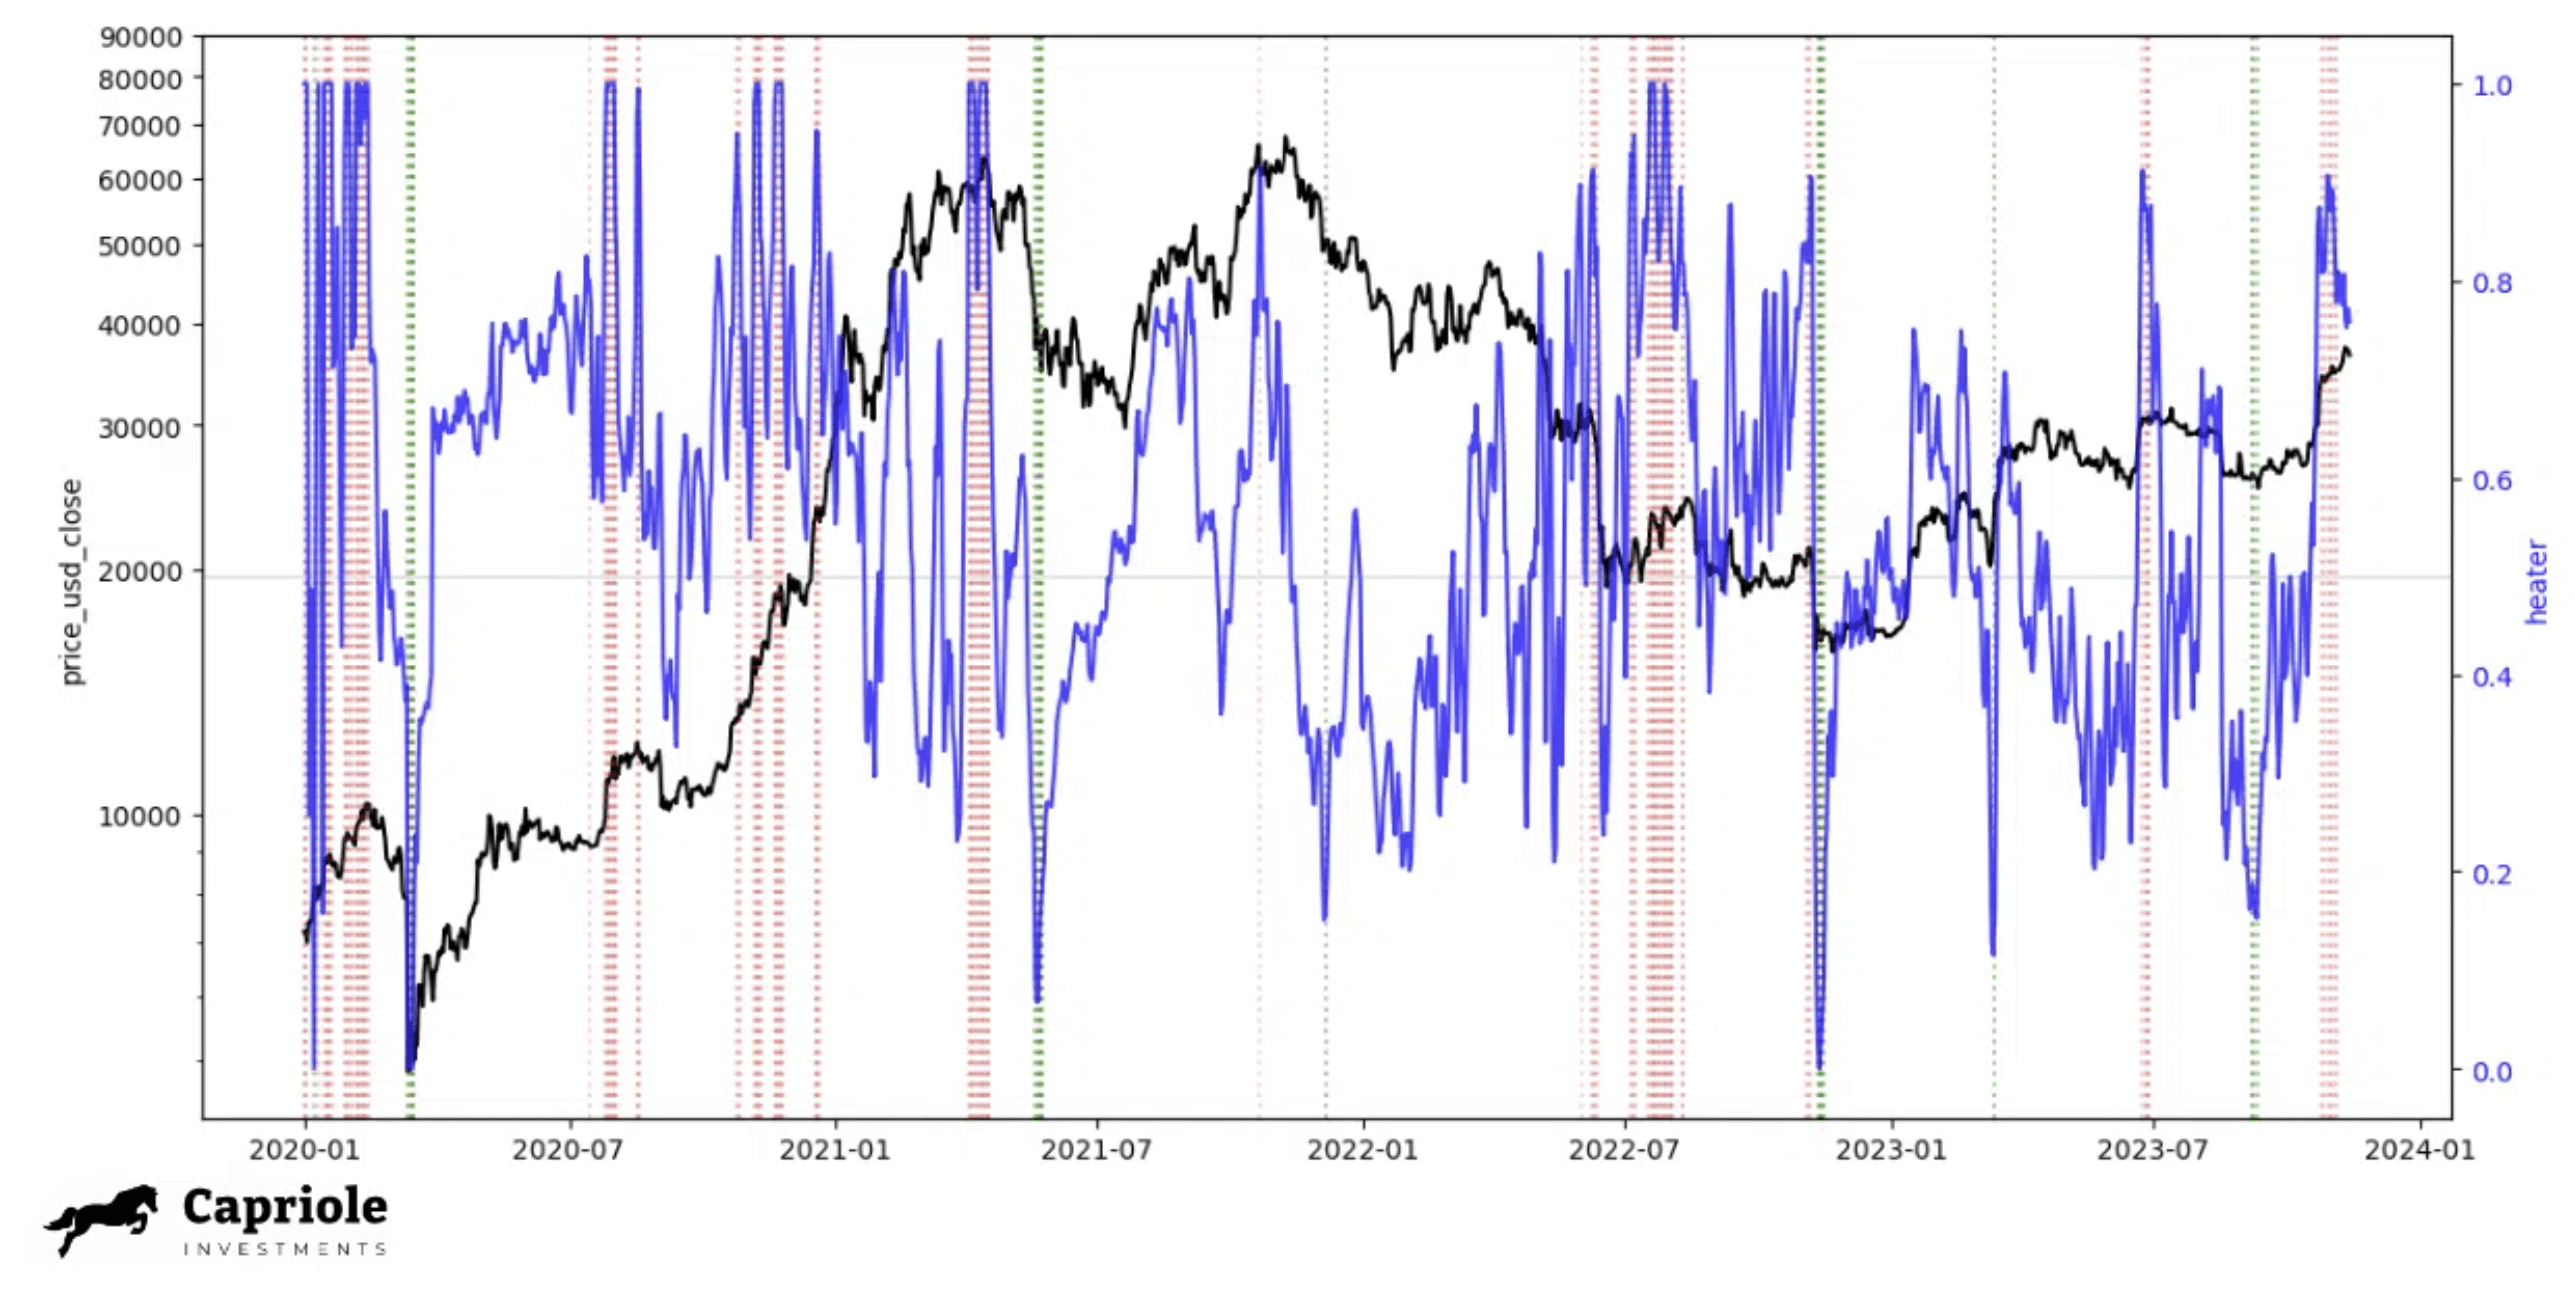
The analyst concluded that the overall trend for Bitcoin remains positive, with major data points indicating a strong bullish scenario. However, he also cautioned about potential short-term risks in the low timeframe technicals and derivatives market. These, according to him, are common in the development of a bull run and could offer valuable opportunities if dips occur.
At press time, BTC traded at $35,626.
Bitcoin Retreats From $35K; Miner Selling Pressure May Cap Prices, Crypto Hedge Fund Says
BTC could run towards $40,000-$45,000 after consolidating around current prices, Capriole Investments said.
Bitcoin Is Up 100% This Year. It’s Not Just Because of Spot BTC ETF Hype
As BTC has gained over 100% this year, most observers tied its recent strength to a looming approval of a spot BTC ETF. But its increasingly constrained supply, underinvested market participants and bitcoin’s rejuvenated shine as a safe haven from spiraling debt levels, banking crises and geopolitical turmoil may also have played a role.
Bitcoin Analysis: Why 2024 Will Be The Highest Returning Year This Cycle
In a recent comprehensive report by Capriole Investments, Charles Edwards presents a compelling case for why 2024 will be a pivotal year for Bitcoin, potentially offering the highest returns in its current four-year cycle. The report delves into multiple facets of Bitcoin’s future, including its role as an inflation hedge, the upcoming Halving event, and the impact of imminent ETF approvals.
A Confluence Of Catalysts For Bitcoin
Edwards begins by addressing the skepticism surrounding Bitcoin’s performance as an inflation hedge. “Bitcoin gets a hard rep for its performance coming out of 2021 amidst growing inflation,” he notes. Contrary to popular belief, Edwards asserts, “Bitcoin was a great inflation hedge – it was when it needed to be.”
He emphasizes Bitcoin’s impressive 1000% rise from Q1-2020 to Q1-2021, outpacing all other asset classes. This surge, he explains, was a direct response to the Federal Reserve’s multi-trillion-dollar QE packages announced in March 2020. “Markets today move incredibly fast and are forward looking. As soon as macro announcements are made, the pricing-in begins,” Edwards states.
Drawing a comparison between Bitcoin and traditional hedges, Edwards points out that Bitcoin’s performance during the liquidity boom was unparalleled. “There is no doubt that Bitcoin dominated the crisis as the best inflation hedge,” he asserts, adding, “There is no second best. Bitcoin was the greatest inflation hedge we have ever seen.”
The second crucial catalyst for Bitcoin is the upcoming halving in April 2024. Edwards highlights the gravity of this event, stating, “The upcoming Bitcoin halving in April will drop Bitcoin’s supply growth rate to 0.8% p.a. and below that of Gold (1.6%) for the first time ever.” This means that “In April 2024, Bitcoin will for the first time become harder than Gold.”
Addressing the common argument that the Halving is already priced in, Edwards counters, “If there is one thing we have learnt from Bitcoin’s past it’s that the halving is never priced in.” He argues that 80% cycle drawdowns reset all interest in Bitcoin. Furthermore, Edwards draws parallels to previous cycles, noting that many on-chain metrics indicate that the current cycle mirrors those of 2019 and 2015 exactly.
Third, Edwards also touches upon the regulatory landscape, highlighting the clarity brought about by the CFTC’s classification of Bitcoin as a commodity in 2021. He also mentions the significant announcement of Blackrock’s Bitcoin ETF application and the federal appeals court’s order for the SEC to reconsider its rejection of the Grayscale spot ETF. His base case expectation is that the SEC will approve the spot ETF either in October 2023 or January 2024.
Discussing the potential impact of ETFs on Bitcoin, Edwards draws a parallel to Gold, noting the significant bull run that followed the approval of the Gold ETF in 2004. “When the Gold ETF approval hit, what followed was a massive +350% return, seven-year bull-run,” the analyst remarked, adding, “so, we have three incredible catalysts on the very near horizon,” he states, listing the upcoming halving, imminent ETF approvals, and Bitcoin’s status as the best inflation hedge.
In conclusion, Edwards presents a bullish yet cautious outlook. While he acknowledges the short-term bearish signals, he remains optimistic about the long-term prospects. “In Bitcoin’s four-year cycles, there’s typically 12-18 months where 90% of returns happen, followed by 2-3 years of sideways and down,” he observes, adding, “I am expecting that the single highest returning year of this cycle will be 2024 and I believe the data supports that thesis.”
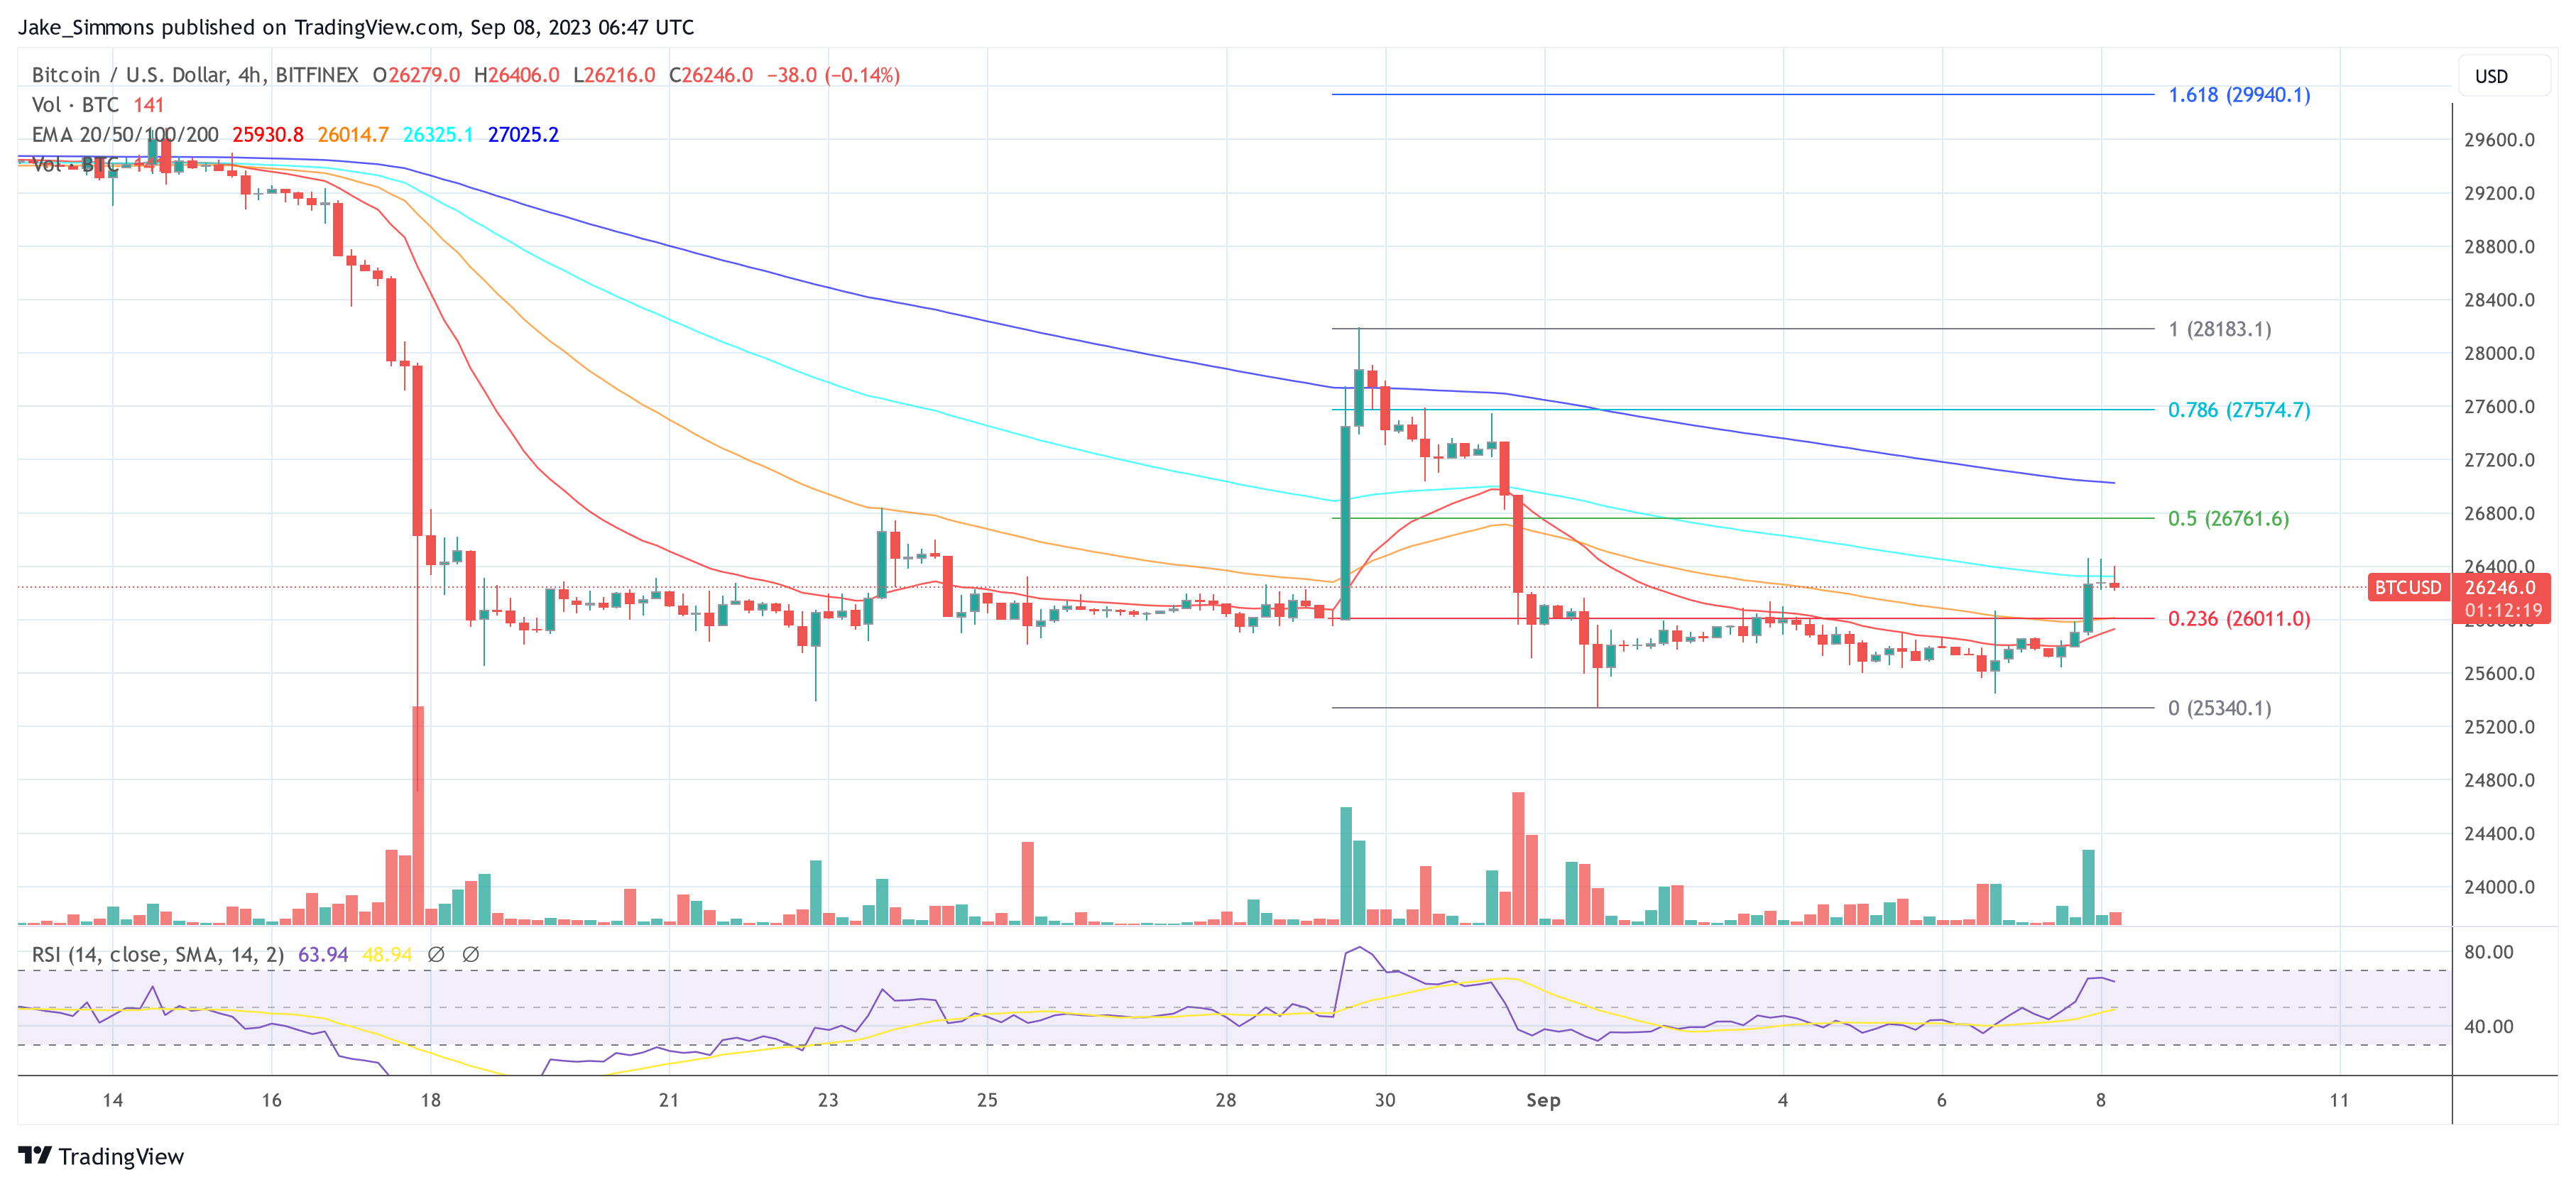
At press time, BTC surged to $26,246, up 1.8% in the last 24 hours.
Low Bitcoin Volatility Mirrors 2016: A Bullish Breakout On The Horizon?
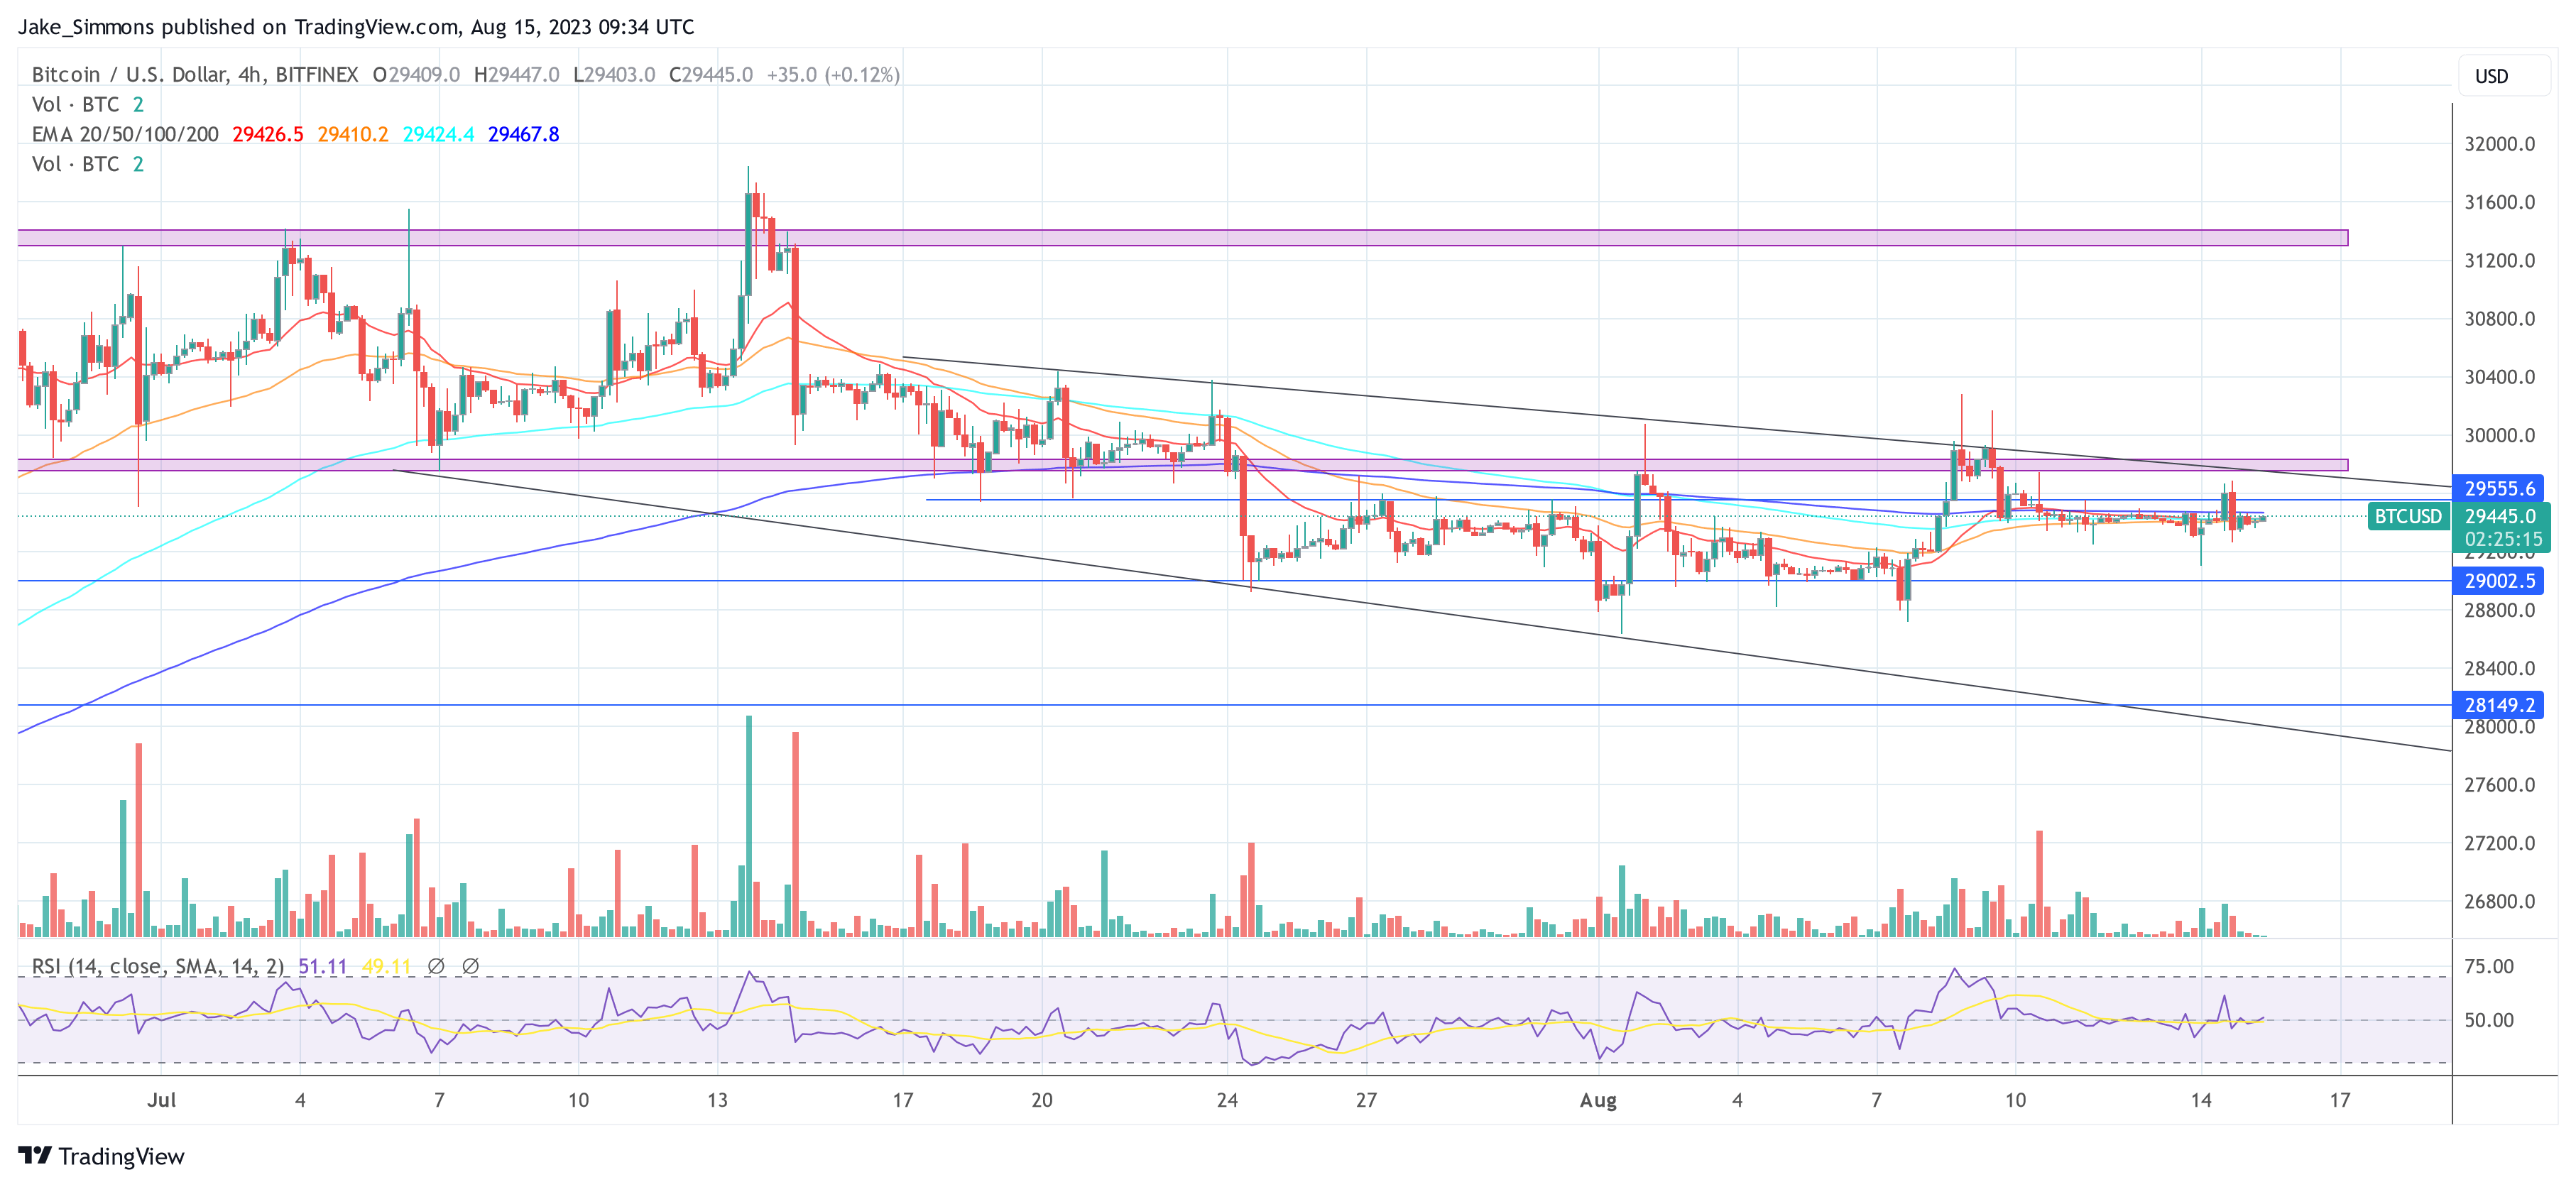
In today’s micro update from Capriole, founder Charles Edwards presented a compelling analysis that draws parallels between the current low volatility of Bitcoin and its historical behavior in 2016. With Bitcoin’s price stagnating around the $29,000 mark, experts are closely watching for signs of a potential bullish breakout.
“Bitcoin’s price remains at $29K, in a sideways consolidation that has created one of the absolute lowest volatility periods in Bitcoin’s 14 year history,” Edwards states. This prolonged period of low volatility is reminiscent of 2016, suggesting that a significant price movement could be imminent.
Bitcoin Breakout Imminent?
While the technicals indicate a bearish breakdown from the $30,000 mark, the absence of a downward momentum offers a glimmer of hope for bullish investors. “If price was going to collapse, we would usually have seen that follow through by now,” the report notes. However, for a more concrete bullish sentiment, “a close back above $30K on the daily timeframe is required at the minimum as a technical confirmation of a failed breakdown.”
On the fundamental front, Bitcoin’s on-chain data continues to contract, albeit at a decelerating rate. The imminent decisions on several Bitcoin ETF approvals could potentially disrupt the current low volatility phase. “An approval could cause a break from the current low volatility range. Best not to pre-empt this though, as these decisions often get pushed. Confirmations are key to mitigate risk,” Edwards cautions.
Diving deeper into the technicals, the report highlighted two key observations:
Since 2010, Bitcoin’s historic volatility has only been lower than today in 2016. Suggesting a big price move is on the horizon when volatility expansion (reversion to the mean) occurs.
Bitcoin’s $30K breakdown has (so far) failed to follow through… A close back into the Wyckoff structure at $30K would signify a failed breakdown and therefore be a very positive technical signal.
BTC On-Chain Indicators Are Neutral
Capriole’s Bitcoin Macro Index, a comprehensive tool that amalgamates over 40 Bitcoin on-chain, macro market, and equities metrics into a machine learning model, currently scores at -0.36, indicating “Contraction”. This suggests that while the short-term outlook remains neutral, the long-term perspective appears bullish. Remarkably, this strategy takes long-only positions in Bitcoin. In slowdowns and contractions, cash is held.
“The Macro Index today remains in a period of relative value (below zero), suggesting decent long-term value for multi-year horizon investors,” the report elucidated.
A noteworthy addition to Capriole’s analysis toolkit is the “Bitcoin Production Cost” model, which evaluates the cost of mining a Bitcoin based on global average electrical consumption. Currently, this model indicates that Bitcoin is trading within a long-term value region, with the report speculating, “I would be surprised if this holds into 2024.”
In conclusion, the analysis from Capriole paints a picture of potential long-term value amidst the current bearish technicals. Drawing parallels with 2016, the report suggests that Bitcoin’s current low volatility phase could be a precursor to a bullish breakout.
“All else equal, Bitcoin is like a beach ball submerged underwater. Nonetheless, we remain in a technical breakdown. We don’t know how long that hand will hold the ball underwater for. Prudent risk-management will await a technical confirmation before acting.”
With the cyclical nature of Bitcoin’s expansion and contraction cycles, only time will tell if history will indeed repeat itself; especially with the backdrop of a totally different macro environment. At press time, the BTC price remained stagnant, trading at $29,445.