Crypto Analyst Says Cardano “Ready For A Parabolic Bull Run,” Here’s Why

An analyst has explained how, if the historical pattern followed by the ADA price is to be believed, Cardano seems ready to go on a parabolic bull run.

Cardano May Be Set For A Bull Run Based On Historical Trends

In a new post on X, analyst Ali Martinez has discussed what hints history may contain regarding where ADA’s price would go next from here. First, here is a chart shared by the analyst that shows the trend the cryptocurrency followed back in 2019:

Cardano 2019 Trend

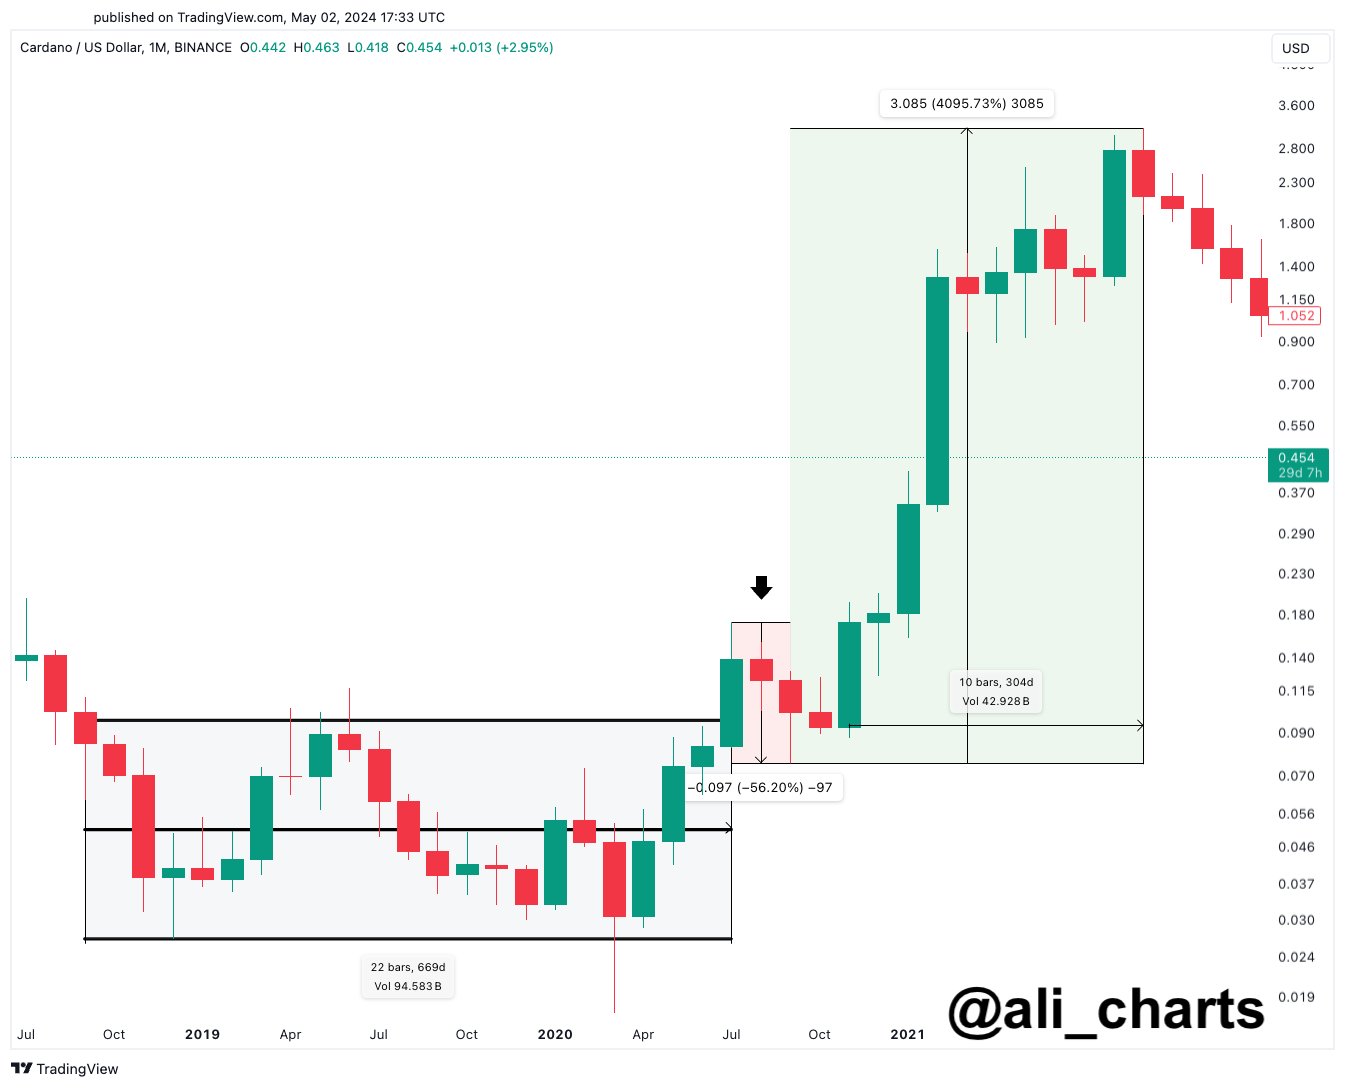
From the graph, it’s visible that the asset had first consolidated inside a parallel channel during this period. A “parallel channel” in technical analysis (TA) refers to the region bounded by two parallel trend lines.

The upper line of the pattern connects the tops in the price, while the lower one joins the bottoms. When consolidating inside the channel, the price is probable to find resistance at the upper end and support at the lower one.

A break out of either of these lines can imply a continuation of the trend in that direction. As is visible in the chart, ADA managed to break out of this past parallel channel with a 75% surge. The asset then followed this rally up with a correction of around 56% before finally lifting off into a massive 4,095% bull run.

Interestingly, just like in 2019, Cardano was stuck inside a similar parallel channel in 2023. The chart below shows this recent pattern for the cryptocurrency.

Cardano 2023 Pattern

As displayed in the graph, Cardano broke out of this latest parallel channel a while ago, this time with a rally of around 72%. Recently, though, the asset has lost this bullish momentum, as it has seen a drawdown of 50%. According to the analyst, however, this can, in fact, set the stage for a new bull run.

History doesn’t repeat itself, but it often rhymes! If that is the case for Cardano, we should be positioning ourselves for what’s coming, understanding that the recent price correction might just be one of the last buy-the-dip opportunities ADA will give you.

It now remains to be seen whether ADA will repeat the pattern from the last bull run or not. This is more about the long-term view, though, so where might the asset go in the short term? This may be answered by a signal that the analyst has shared in another X post.

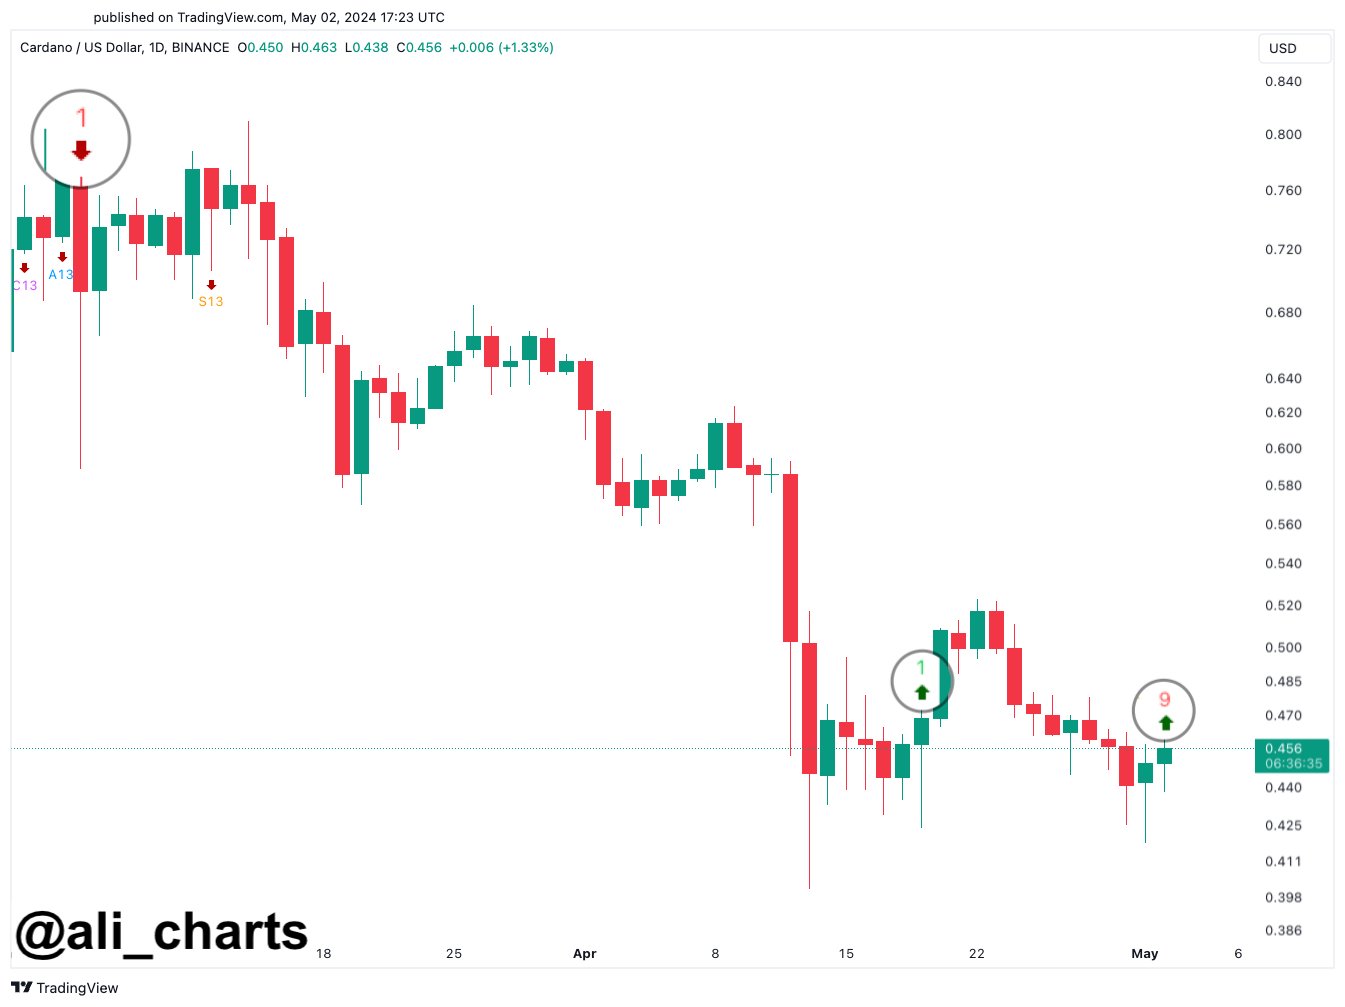
Cardano TD Sequential

As Martinez explains:

The TD Sequential, which timed the Cardano top, now presents a buy signal on the ADA daily chart. It anticipates a one to four daily candlesticks rebound that could put an end to the ADA corrective phase.

ADA Price

At the time of writing, Cardano is trading around $0.464, down 3% over the past week.
Cardano Price Chart

Cardano (ADA) Prints ‘Undeniable Bull Run’ Signal: Crypto Analyst

The price of Cardano (ADA) has experienced a decline in recent weeks. Following a peak at a 23-month high at $0.808 on March 11, the price of ADA has fallen by over 28%, and it is now hovering just below the $0.60 level. Notably, Cardano has underperformed compared to its competitors, slipping to the 10th position among the largest cryptocurrencies by market cap.

However, a crypto analyst, known as Trend Rider (@TrendRidersTR) on X, has declared that ADA is showing clear signs of a bull run based on technical analysis of its Relative Strength Index (RSI) and Simple Moving Average (SMA) crossovers.

What This Means For Cardano Price

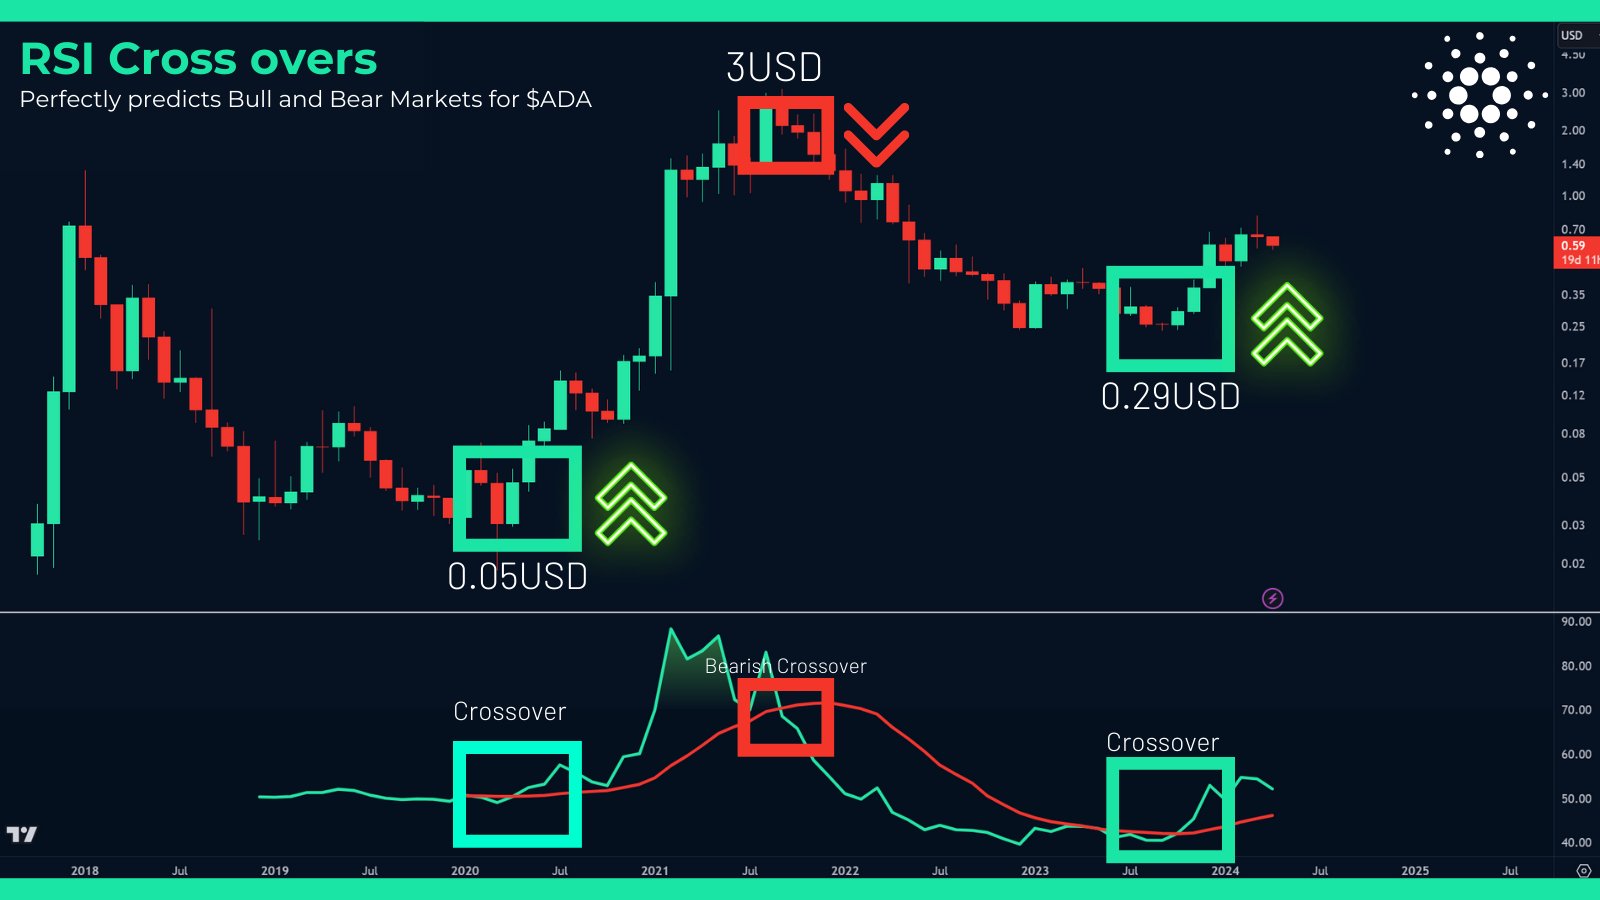
According to Trend Rider’s recent post on X, Cardano’s current market behavior mirrors a rare pattern in the one month chart (ADA/USD) observed only once before, which led to a significant price surge from $0.05 to $3.00.

The analyst emphasized, “ADA’s undeniable bull run is here. With its second RSI crossover in history, it’s reminiscent of when prices soared from $0.05 to $3. This rare event, marking a potential trend shift as the RSI crosses its SMA, has flawlessly predicted past cycles shifts at it’s early stages.”

The analysis presented by Trend Rider focuses on the RSI, a momentum oscillator that measures the speed and change of price movements, and its crossover with the SMA, a common trading signal interpreted as a potential bullish or bearish market indicator.

Cardano price analysis

The post details three critical phases in Cardano’s recent market activity. The first crossover occurred shortly after the COVID-19 pandemic onset when ADA traded at $0.19, marked by a substantial price increase following the crossover event.

At the end of the 2021 bull run, a bearish crossover took place that heralded a prolonged bear market. “Notice how perfect the bearish crossover anticipated the bear market. This is an extremely strong validation for this indicator. Making it very relevant to predict ADA long term cycles,” the analyst states.

The second bullish crossover of the RSI with the SMA occurred in October and November 2023, this event was initially met with market rejection a few months earlier, adding credibility to the indicator’s reliability in predicting long-term market trends.

Trend Rider concludes, “The RSI and its SMA crossovers are an extremely reliable source to identify ADA bull runs and bear markets at its early stages.” This analysis suggests that Cardano is currently entering a bull market phase, reinforcing the optimistic outlook for ADA.

Moreover, the analyst warned the one-month chart reflects a macro perspective for holders, “each candle represents one month, so you can expect huge volatility within each candle.” Furthermore, he cautioned of the inherent risks in crypto investments, noting the importance of a personalized investment strategy to navigate potential market volatility and unforeseen events, often referred to as ‘black swan’ events.

“VERY IMPORTANT: Personally, these macro charts help me see the bigger picture, but I always use my own process to secure profits and protect myself from any black swan event,” Trend Rider added.

If history is any indicator, the current patterns could spell a lucrative phase for Cardano holders, but as always in crypto markets, caution remains a critical companion to enthusiasm.

Cardano (ADA) To Break $8 In Bull Run: Analyst Predicts Timeline

An analyst has explained that if history repeats for Cardano (ADA), its price could break $8. Here’s when this might happen for the asset.

Cardano Has Been Mirroring Past Price Pattern Recently

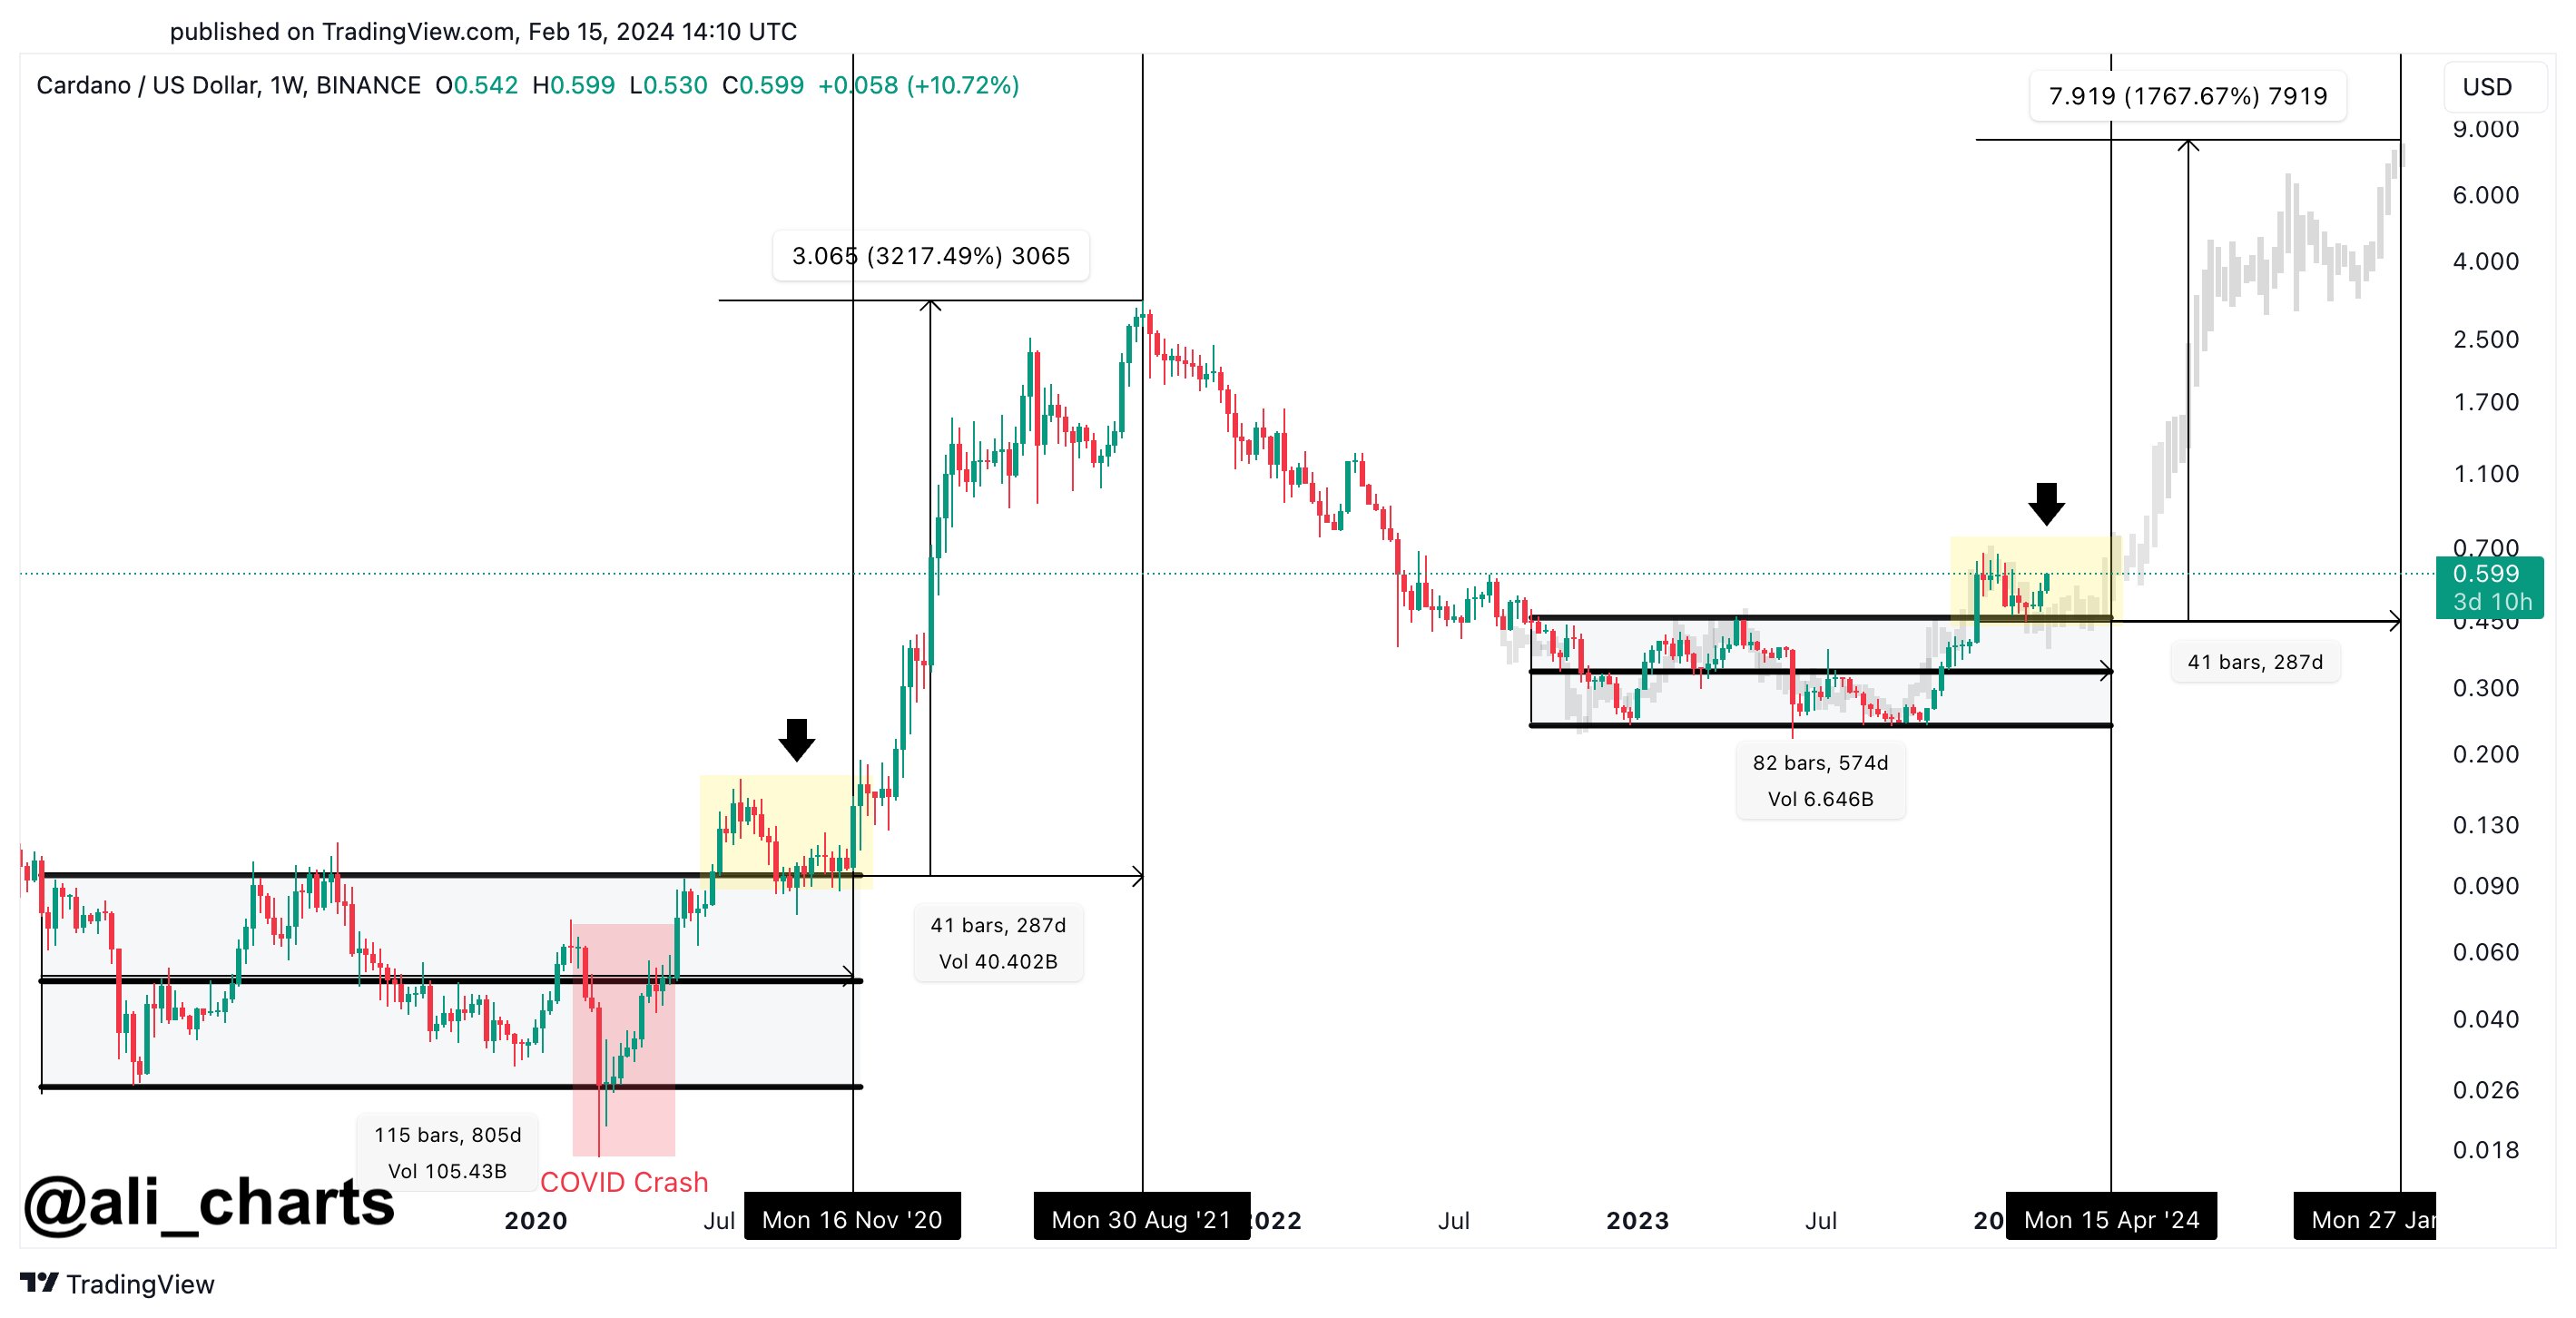
In a new post on X, analyst Ali has discussed a potential breakout happening in the weekly price of Cardano. ADA has appeared to have surged above a long parallel consolidation channel in this latest breakout.

Below is the chart shared by the analyst that shows this recent pattern in the price of cryptocurrency.

Cardano Breakout

As the graph shows, ADA had been moving inside a parallel channel until the recent surge toward the upside came. In technical analysis, a “parallel channel” refers to the region enclosed by two parallel trendlines.

This pattern forms when the asset trades sideways inside a specific range. The upper line of the channel can be a source of resistance for the asset; thus, reversals towards the downside can likely take place after retests of it. Similarly, the lower line can be a probable point for bottoms to take form.

However, breaks out of either of these lines imply a potential strong continuation of the trend in that direction. This means an escape above the channel can be a bullish signal for the price, while a drawdown under it can be a bearish predictor.

During 2019-2020, Cardano was also stuck in consolidation inside a parallel channel similar to the one witnessed recently, as Ali highlighted in the chart.

In this previous period, the cryptocurrency had eventually managed to break above the channel, leading to the 2021 bull run. In total, the asset enjoyed a rally of 3,200% back then.

The coin’s trajectory inside the latest channel ended up being similar to that one, and recently, the ADA price has also broken beyond the channel in a fashion that has been reminiscent of the break of the previous one.

After the previous break, the coin rallied for a bit and then returned to retest the upper level of the channel, which has been repeated this time as well.

The difference this time, however, is that Cardano appears to be heading up now, which took a bit more time to happen last time around.

“The Cardano breakout may come earlier than expected!” notes the analyst. “Still, if history repeats itself, we are anticipating ADA to rise to $0.80, retrace to $0.60, and then enter a bull run toward $8 by January 2025!”

If the cryptocurrency follows this path set by history, the rally toward the $8 level would mean a total uplift of more than 1,200% from the coin’s current price.

ADA Price

Cardano has enjoyed a surge of more than 11% in the past week and has risen to the $0.60 mark.

Cardano Price Chart

Why Cardano (ADA) Is A Top Altcoin Pick In The Next Bull Run

Dan Gambardello, the founder of Crypto Capital Venture, has laid out a bullish narrative for Cardano going into the next bull run. Based on his analysis, the crypto token has the potential to be one of the best-performing coins during that period. 

History Could Repeat Itself For Cardano

In a video posted on his YouTube Channel, Gambardello mentioned how Cardano was currently in the same technical area it was in the last two market cycles before the Bitcoin Halving. He further noted that on those two occasions, ADA managed to surpass expectations and ended up clocking a new all-time high (ATH) in the process. 

Specifically, ADA is said to have seen a 2700% gain on its way to its current ATH of $3 after the 2020 Bitcoin Halving. Gambardello believes that this time will be no different despite ADA being significantly down from its ATH. Although he was trying to be cautious with his price predictions, he raised the possibility of Cardano seeing an 1800% gain on its way to $10 in the next bull run. 

Interestingly, that isn’t the crypto analyst’s most bullish prediction so far. He once stated that ADA could rise to $11 at a market cap of $400 billion. Then, he hinted that ADA could enjoy a similar run as ETH did in the last bull run due to its DeFi functionalities. 

This time around, he once again made the ADA and ETH comparison, noting that the former hitting a market cap of $350 billion in the next bull run is still way less than ETH’s market cap in the last bull run. 

Cardano ADA price chart from Tradingview.com

Bitcoin Halving Is The Key To Unlocking The Next Bull Run

Before now, Gambardello had hinted that the Bitcoin Halving was going to kickstart the next bull run. In his recent video, he once again suggested that the next bull run was going to start after the Halving in April, noting how the bull cycles always take place after this event. He further highlighted how the Bitcoin chart was also indicating that the next bull run is imminent. 

According to the crypto analyst, “a simple zoom out on a Bitcoin chart” shows that there is so much to be bullish about. Altcoins are not left behind, as Gambardello also claimed that the charts of altcoins like ADA and ETH suggested that something was getting ready to happen, implying that a massive rally was on the horizon. 

Meanwhile, Gambardello wasn’t only bullish on the crypto market from a technical analysis perspective. He alluded to fundamentals like recent developments around the Spot Bitcoin ETFs, which show increased demand for the flagship crypto token, Bitcoin. 

Cardano Price Poised To Rally 650% By July 2024: Crypto Analyst

According to crypto analyst Ali Martinez, Cardano (ADA) is exhibiting a price consolidation pattern that is highly bullish. Drawing parallels to the consolidation phase of 2018-2020, Martinez points out that ADA’s current trend is a mirror image, albeit without the disastrous COVID-19 crash.

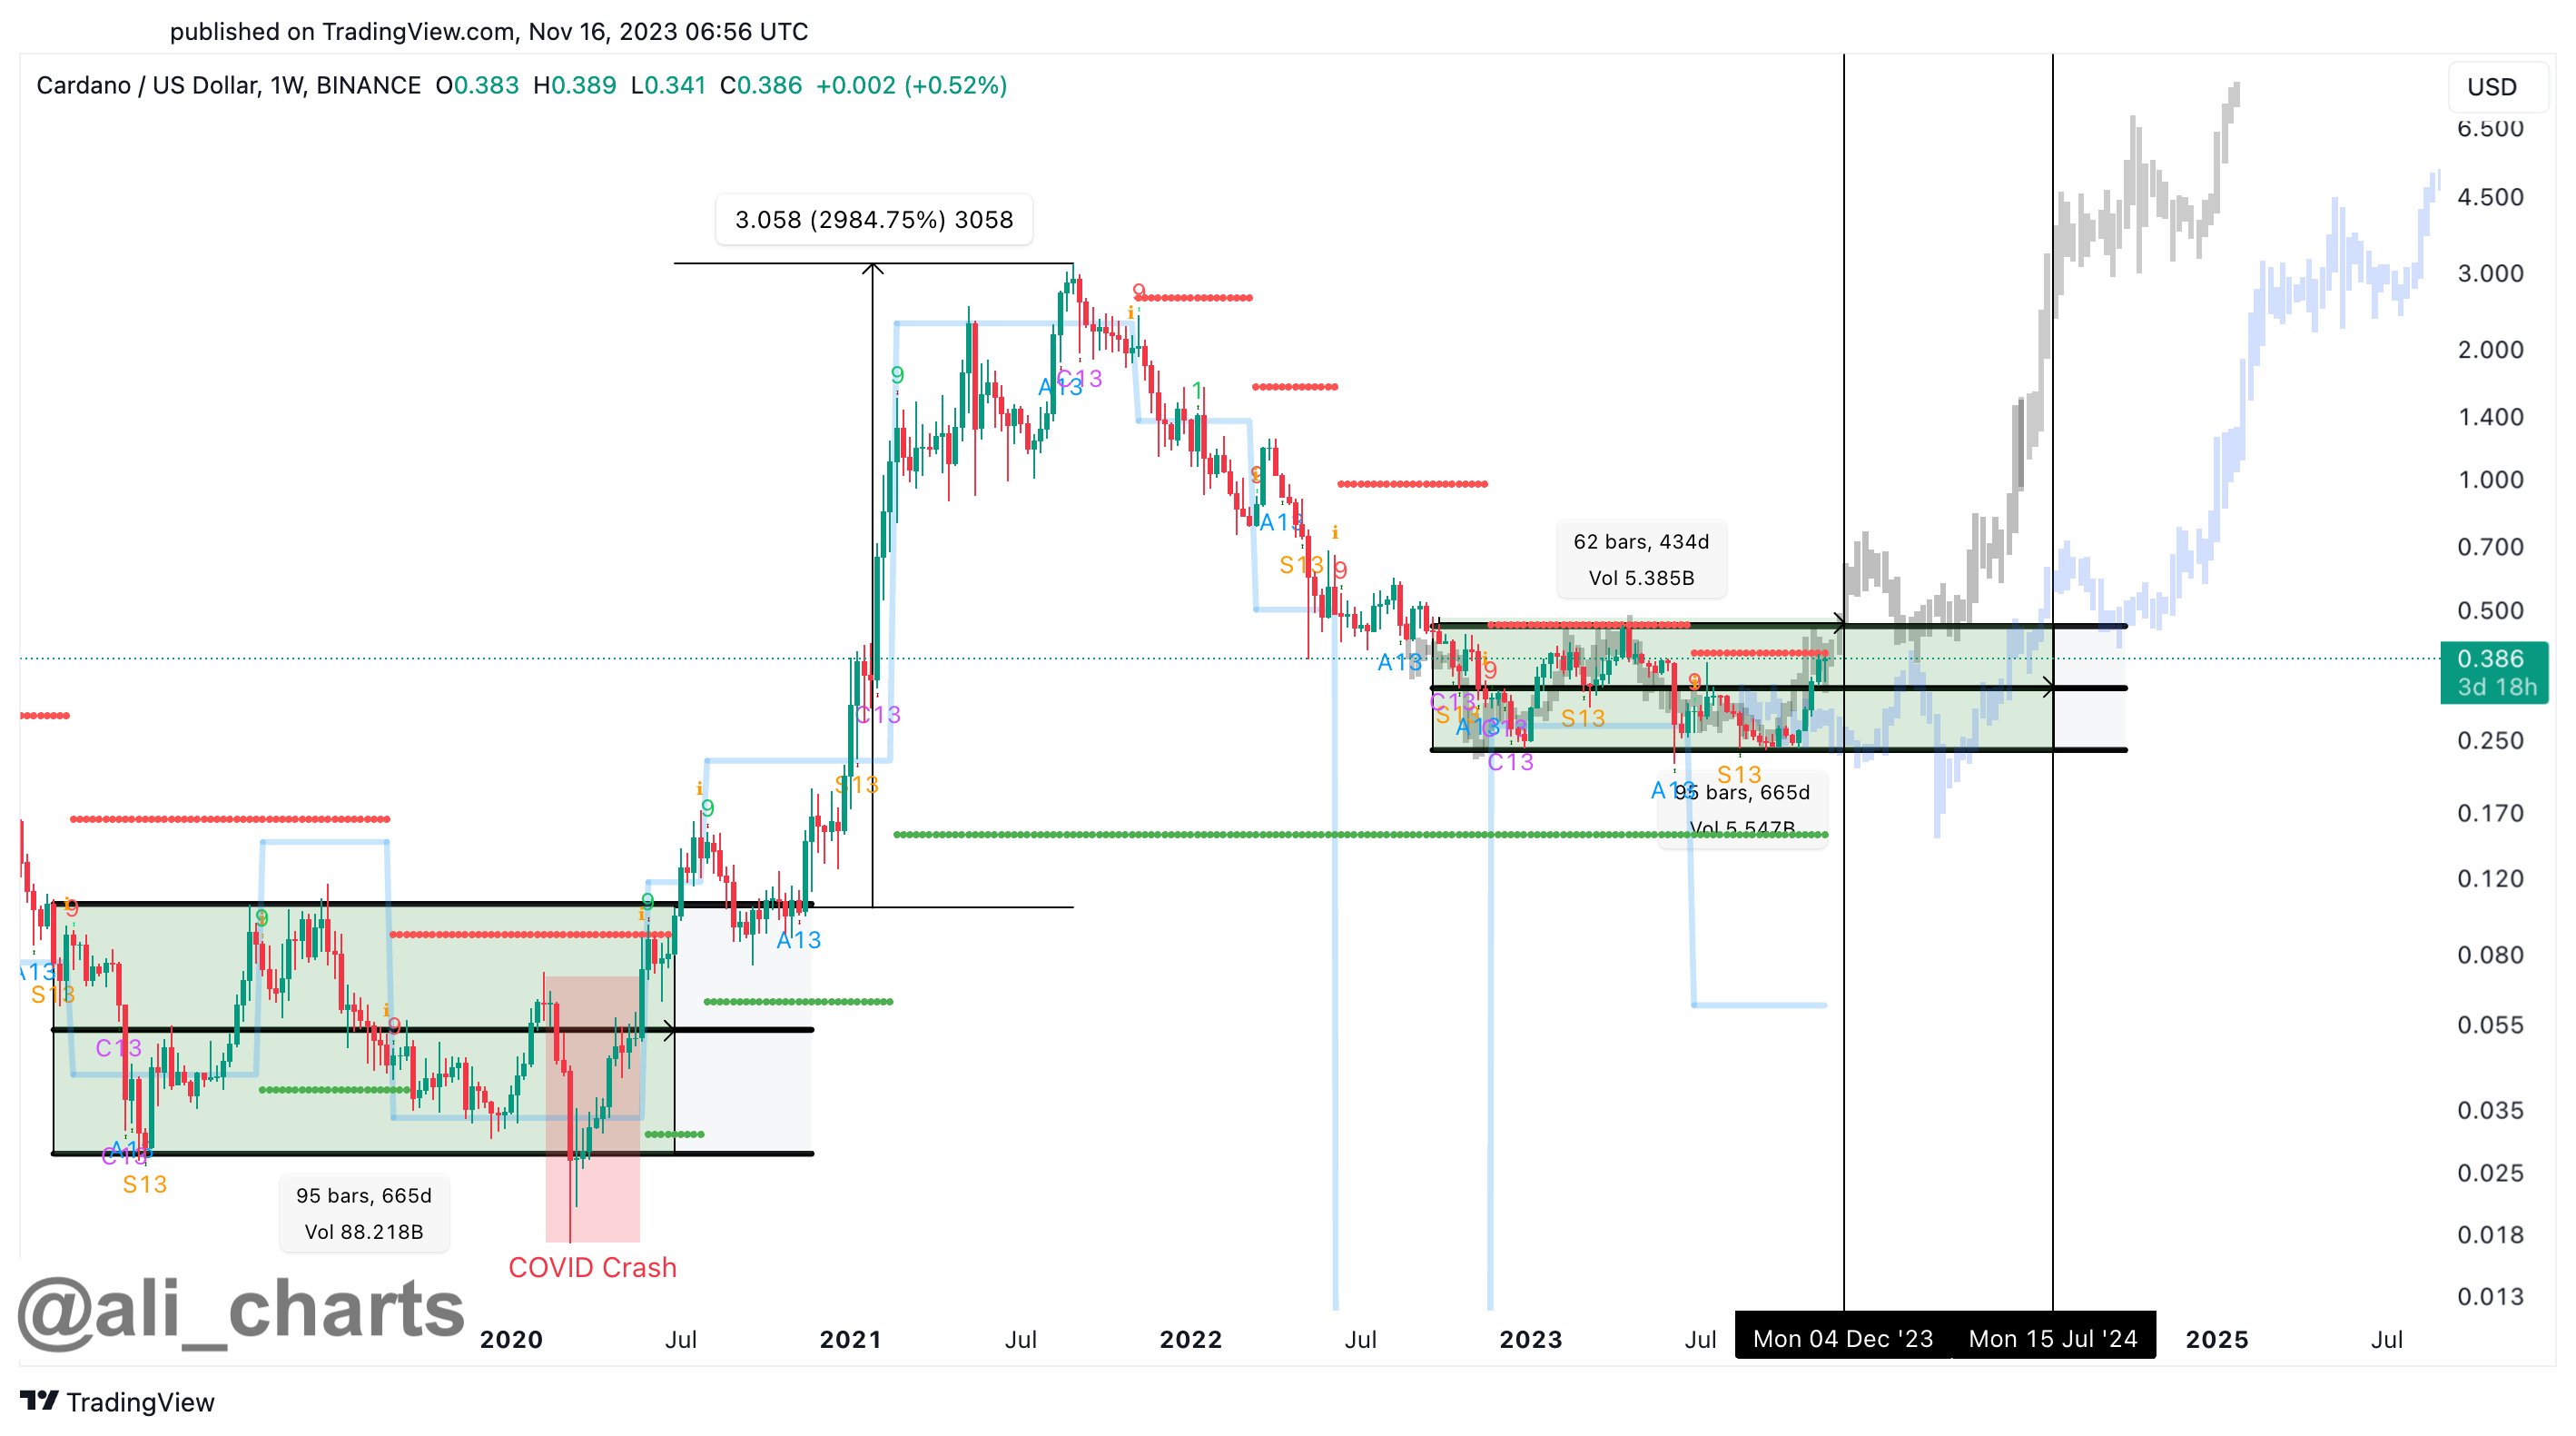
“Cardano’s current consolidation trend eerily mirrors the 2018-2020 phase without the COVID-19 crash! If so, ADA could break through the $0.45 resistance around the first week of December. The upswing could send ADA to $0.75 by late December,” Martinez shared in a recent post on X.

The one-week chart for ADA/USD indicates a prolonged consolidation phase spanning 665 days until July 2020, after which ADA experienced a 2,984% rally, peaking at $3.058. A significant aspect of this ascent was the retest of the upper consolidation box line, which took several months from summer 2020 to early 2021. Interestingly, after dipping back into the consolidation box, ADA initiated a second breakout that led to the massive bull run.

Cardano mirrors the 2018-2020 phase

Cardano Poised For 650% Rally Till July?

Martinez’s analysis suggests that ADA could be on the brink of its first breakout from its current consolidation range of sub-$0.25 to $0.45, which has lasted for 434 days. He outlines two possible trajectories for ADA’s price in the forthcoming period, using a gray and a blue line in his chart.

The more bullish scenario (gray line) anticipates a breakout above the consolidation zone that could catapult ADA to $0.75 by the end of December, assuming it surpasses the crucial resistance at $0.45. Following the historic pattern, a retest of the breakout mark could occur over several months.

This could potentially set the stage for an explosive rally beginning in early summer 2024, leading ADA to climb approximately 650% from its present value and surge past the $3 mark. However, Martinez does not see this as the zenith of ADA’s potential growth. The gray line suggests a continued upward movement, with ADA possibly reaching $6.50 before the closure of 2024.

The second, more conservative scenario (blue line) posits that the Cardano price consolidation may extend until July 2024, with potential dips below $0.25 if a market crash akin to the COVID-19 downturn occurs. In this case, a breakout towards $0.75 would be expected around July, followed by a retest at $0.45 by the end of 2024, eventually propelling ADA towards the $3 threshold by mid-2025.

Short-Term Price Analysis

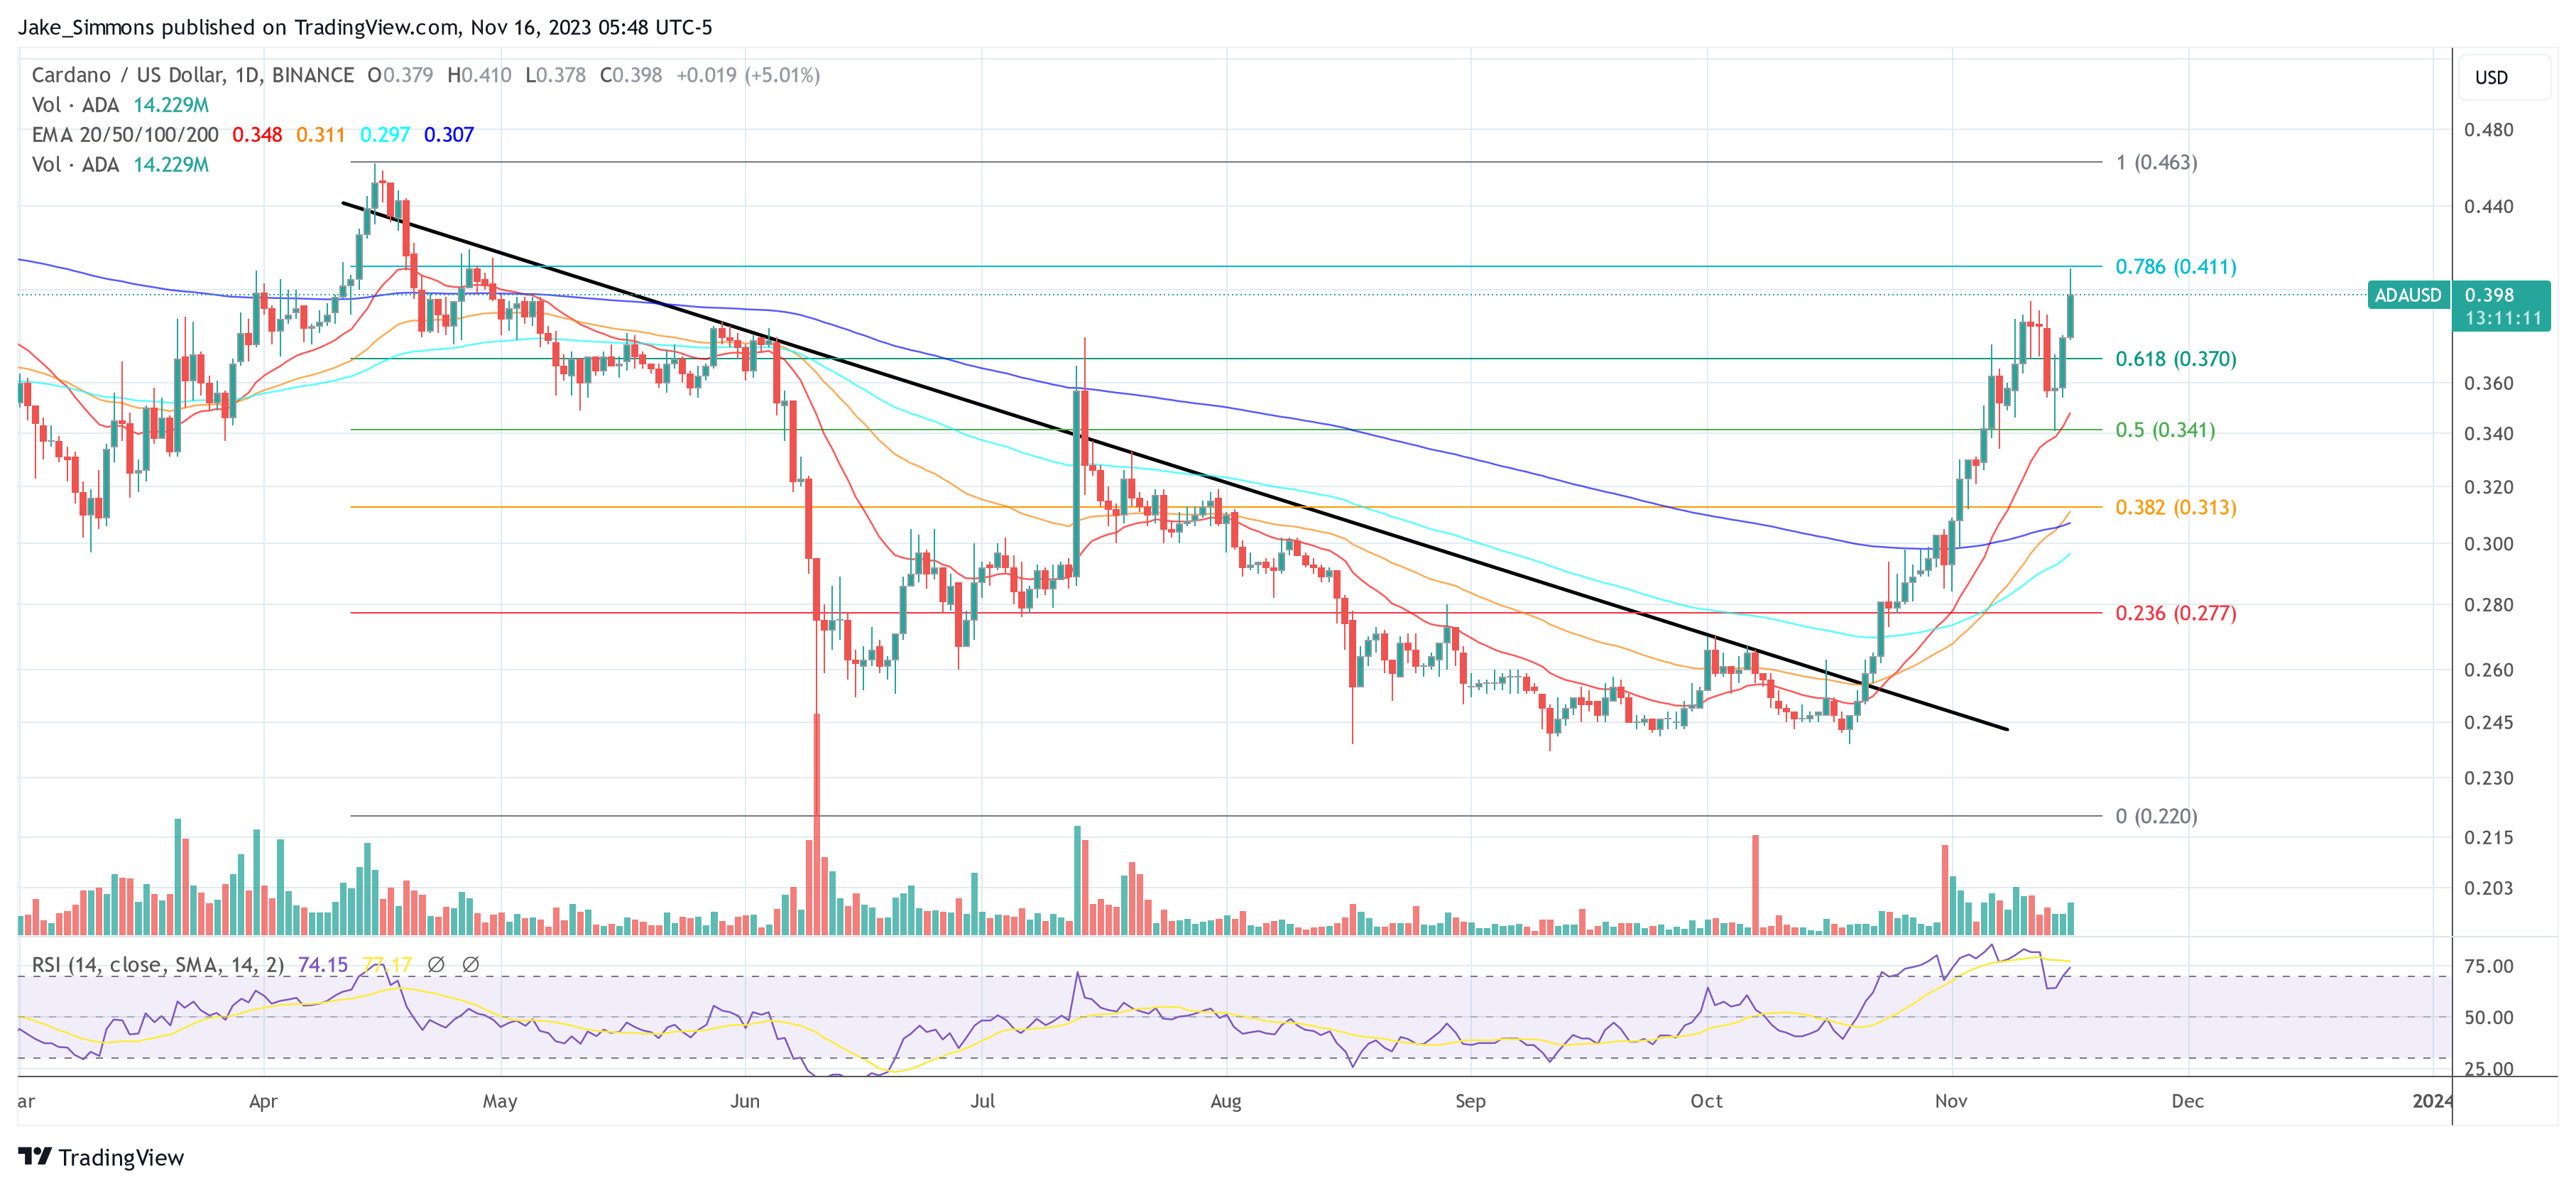
On the lower time frames, ADA is currently making strong moves. The price has successfully retested the 0.5 Fibonacci retracement level ($0.341) and soared above the 0.618 Fibonacci retracement level ($0.37). In the first attempt, ADA failed at the 0.786 Fibonacci retracement level ($0.0.411). However, if this resistance is broken, the door to the yearly high at $0.463 is clearly open.

Cardano price