Chainlink (LINK) Breakout: Accumulation Zone Points To Upside Potential, $20 In Sight

The decentralized Oracle network Chainlink and its native token LINK have grown impressively in the past month. Despite experiencing a correction since late December, where LINK reached a 20-month high of $17.6, the token has shown signs of renewed bullish momentum. 

Key Resistance Levels For LINK’s Price Rally

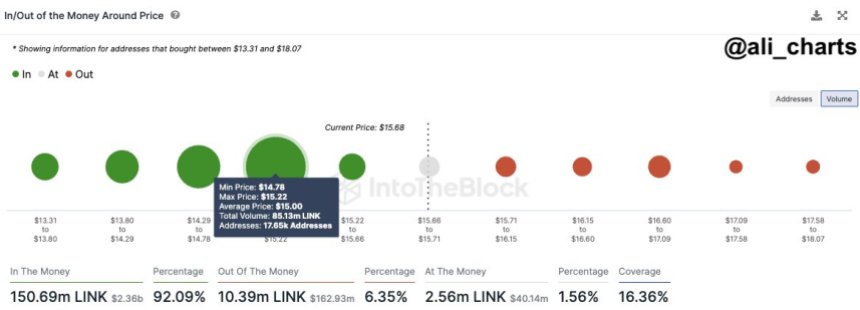
Renowned crypto analyst Ali Martinez has identified a robust demand zone for Chainlink between $14.8 and $15.2, slightly below its current trading price of $15.415. 

Within this range, many addresses (17,650) purchased 85.12 million LINK. With limited resistance, LINK appears to be well-positioned to advance towards the $20 mark.
Chainlink

Based on the analyst’s observations, if the current bullish momentum witnessed over the past seven days persists, LINK could swiftly reach the $20 price level. Looking at LINK’s 1-day chart, the next resistance levels to overcome before potentially climbing toward $20 are $15.55, $16.69, and $16.92. Breaching these levels would pave the way for a clear path towards the $20 milestone.

However, it is important to note that in the absence of major resistance walls, the battle for the next direction of LINK’s movements remains equally balanced. In the event of another price correction or selling pressure, the token lacks significant support walls to rely on.

Chainlink

Analyzing LINK’s 1-day chart, the first support level in the event of a drop would be around $14.22. If this level is breached, the next support stands at $13.31. A further decline could test the support at the $11 price level. A breach of this level could signify a breakdown in the four-month bullish structure of LINK.

Chainlink Ecosystem Growth

Despite the battle for supremacy between LINK’s bulls and bears, the protocol’s ecosystem has shown notable growth in key metrics since the last update. For example, Chainlink’s circulating market capitalization is $8.35 billion, reflecting a positive growth rate of 3.58%.

According to Token Terminal data, in terms of revenue over the past 30 days, Chainlink has generated $11.67 thousand. However, this figure shows a decline of 54.16% compared to the previous period, indicating a decrease in earnings during this timeframe.

Considering the fully diluted market capitalization, which considers the maximum number of Chainlink tokens that could exist in the future, the value stands at $14.82 billion. This metric has experienced a slight increase of 3.48% recently.

When it comes to revenue on an annual basis, Chainlink has generated $219.81 thousand. This represents a positive growth rate of 2.64%, indicating an upward trend in the company’s earnings over a year.

Regarding financial ratios, Chainlink’s price-to-fully-diluted ratio is calculated at an astonishing 68,246.47x. This metric compares the company’s market capitalization to its fully diluted market capitalization. It reflects the premium investors will pay for each unit of potential future tokens.

Similarly, based on the fully diluted market capitalization, the price-to-sales ratio is reported to be 68,246.47x. This ratio measures the company’s valuation relative to its annualized revenue and indicates how much investors will pay for each dollar of sales generated.

Featured image from Shutterstock, chart from TradingView.com 
Chainlink Staking Program Exceeds Expectations, Drives LINK Price Up By 12%

In a significant development for the blockchain data-oracle project, Chainlink (LINK) has witnessed a significant response to its enhanced crypto-staking program, amassing over $632 million worth of its LINK tokens within a remarkably short period. 

The company announced a recent press release highlighting the “overwhelming demand” during the early-access period, which filled the staking limit in just six hours.

Chainlink Unveils Staking v0.2

Chainlink, recognized as the industry-standard decentralized computing platform, unveiled Chainlink Staking v0.2, the latest upgrade to the protocol’s native staking mechanism. 

The Early Access phase has commenced, inviting eligible participants to stake up to 15,000 LINK tokens. This phase will last four days before transitioning into the General Access phase, enabling investors to stake up to 15,000 LINK tokens as long as the staking pool remains unfilled. 

Per the announcement, the upgrade introduces an expanded pool size of 45,000,000 LINK tokens, equivalent to 8% of the current circulating supply. This enlargement aims to enhance the accessibility of Chainlink Staking, enabling a more diverse audience of LINK token holders to participate. 

Staking forms an integral part of Chainlink Economics 2.0, which brings an additional layer of cryptoeconomic security to the Chainlink Network. Specifically, Chainlink Staking empowers ecosystem participants, including node operators and community members, to support the performance of Oracle services by staking LINK tokens and earning rewards for contributing to network security.

While v0.1 served as the initial phase of the Staking program, v0.2 has been restructured into a fully modular, extensible, and upgradable Staking platform. Building upon the lessons learned from the previous release, the v0.2 beta version focuses on several key objectives. 

Chainlink is introducing several new features to enhance its staking program. These include a new unbinding mechanism that provides more flexibility for Community and Node Operator Stakers.

Additionally, security guarantees for Oracle services are being reinforced by slashing node operator stakes. A modular architecture is being adopted to support future improvements and additions, and a dynamic rewards mechanism is being introduced to seamlessly accommodate new external sources of rewards in the future, such as user fees.

Following the conclusion of the Early Access phase on December 11, 2023, the v0.2 staking pool will transition to General Access. At this stage, anyone will have the opportunity to stake up to 15,000 LINK tokens.

LINK Surges To New Yearly High

Given Chainlink’s successful upgrade, LINK, the native token of the decentralized computing platform, experienced a significant surge of 12%, reaching a price as high as $17.305. 

This price level has not been seen since April 2022, signifying a new yearly high for the cryptocurrency. However, LINK has retraced slightly and is currently trading at $16.774.

Crypto analyst Ali Martinez has highlighted a critical support zone for Chainlink. Martinez noted that over 17,000 addresses purchased 47 million LINK tokens from $14.4 to $14.8. 

This accumulation by many addresses suggests strong buying interest in this price range, potentially acting as a support level for the token.

Chainlink

While the support zone may hold and trigger a rebound in the price of LINK, Martinez cautions that investors should remain vigilant. Any signs of weakness, such as a breach of the support zone or negative market sentiment, could prompt investors to sell their LINK holdings to avoid losses.

It remains to be seen whether LINK can maintain its position above these critical levels and whether the broader cryptocurrency market will enter an accumulation phase or experience a retracement after the significant upward movement witnessed in recent weeks. 

Such a retracement could potentially impact LINK’s price and lead to a test of the support above levels. On the other hand, the token faces immediate resistance at $17.483, $18.069, and $18.910. These represent the final hurdles to overcome before LINK reaches the $20 milestone.

Featured image from Shutterstock, chart from TradingView.com 

Chainlink MVRV Enters Bearish Zone As LINK Breaks $10, Correction Soon?

On-chain data shows the Chainlink MVRV ratio has shot up as LINK has rallied above $10, a sign that a steep correction may be due for the asset.

Chainlink 30-Day MVRV Ratio Has Crossed The Bearish 20% Mark

As explained by an analyst in a post on X, the last three times the LINK MVRV ratio hit similar levels as now, the cryptocurrency registered a sharp drawdown. The “MVRV ratio” (where MVRV stands for Market Value to Realized Value) is an indicator that measures the ratio between the Chainlink market cap and the realized cap.

The realized cap here refers to a LINK capitalization model that assumes the true value of each coin in circulation isn’t the same as the asset’s spot price, but rather the price at which the coin last moved on the blockchain.

This price at which the coin was last transferred could be imagined to be the value at which its holder bought it, so the realized cap takes into account the prices at which each investor in the market acquired their LINK.

Thus, the realized cap is essentially a measure of the total amount of capital the holders as a whole have invested into Chainlink. Since the MVRV ratio compares the market cap with this metric, it can provide us with info about the profit/loss situation of the investors.

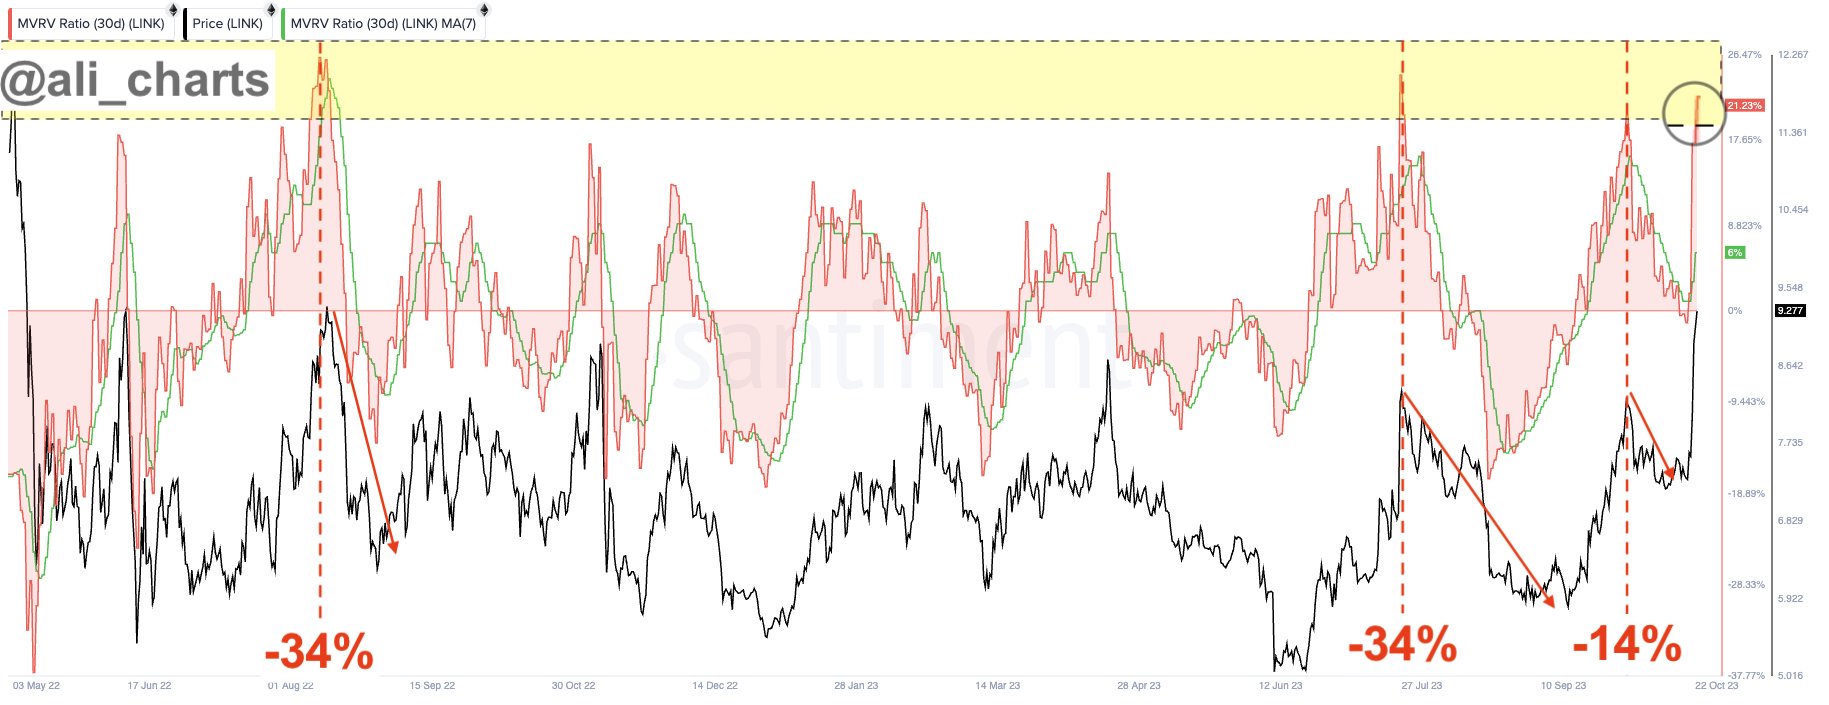
Now, here is a chart that shows the trend in the 7-day moving average (MA) of the ChainlinK MVRV ratio over the past year and a half:

Chainlink MVRV ratio

Note that in the above graph, the MVRV ratio shown isn’t just the ordinary version, but rather the 30-day one. What this means is that this indicator only takes into account the data of coins that were moved within the past month.

From the chart, it’s visible that the Chainlink 30-day MVRV ratio has observed a strong rise recently as the price of the cryptocurrency has enjoyed sharp upward momentum.

The metric has crossed the 21% mark with this increase, suggesting that the investors who bought within the last 30 days are holding 21% more in value than what they put in.

Usually, the more the profits held by the investors, the greater their probability of giving in to the allure of profit-taking. As such, whenever the investors are carrying a high amount of profits, the risk of a correction taking place can become significant.

In the current case, the Chainlink investors are those who only bought within the past 30 days, which means that this cohort is bound to have fickle-minded hands who would easily be tempted to harvest their gains.

As the analyst has marked in the chart, it would appear that the last three times the MVRV ratio crossed above 20% for this group, the LINK price observed a sharp decline.

In the first two cases, this drawdown was 34% each, while in the third and latest one, it was about 14%, which is still quite a notable drop. If this pattern is anything to go by, Chainlink may see another such correction soon.

LINK Price

Chainlink has seen another 9% rise during the last 24 hours as its price has now broken above the $10.1 mark.

Chainlink Price Chart