Chainlink Declines 6%: Rally Over Or Is There More To Go?

The Chainlink rally has slowed down recently; here’s what the various LINK on-chain metrics look like to see if the surge has hope of a restart.

Chainlink Has Registered Some Drawdown In The Past 24 Hours

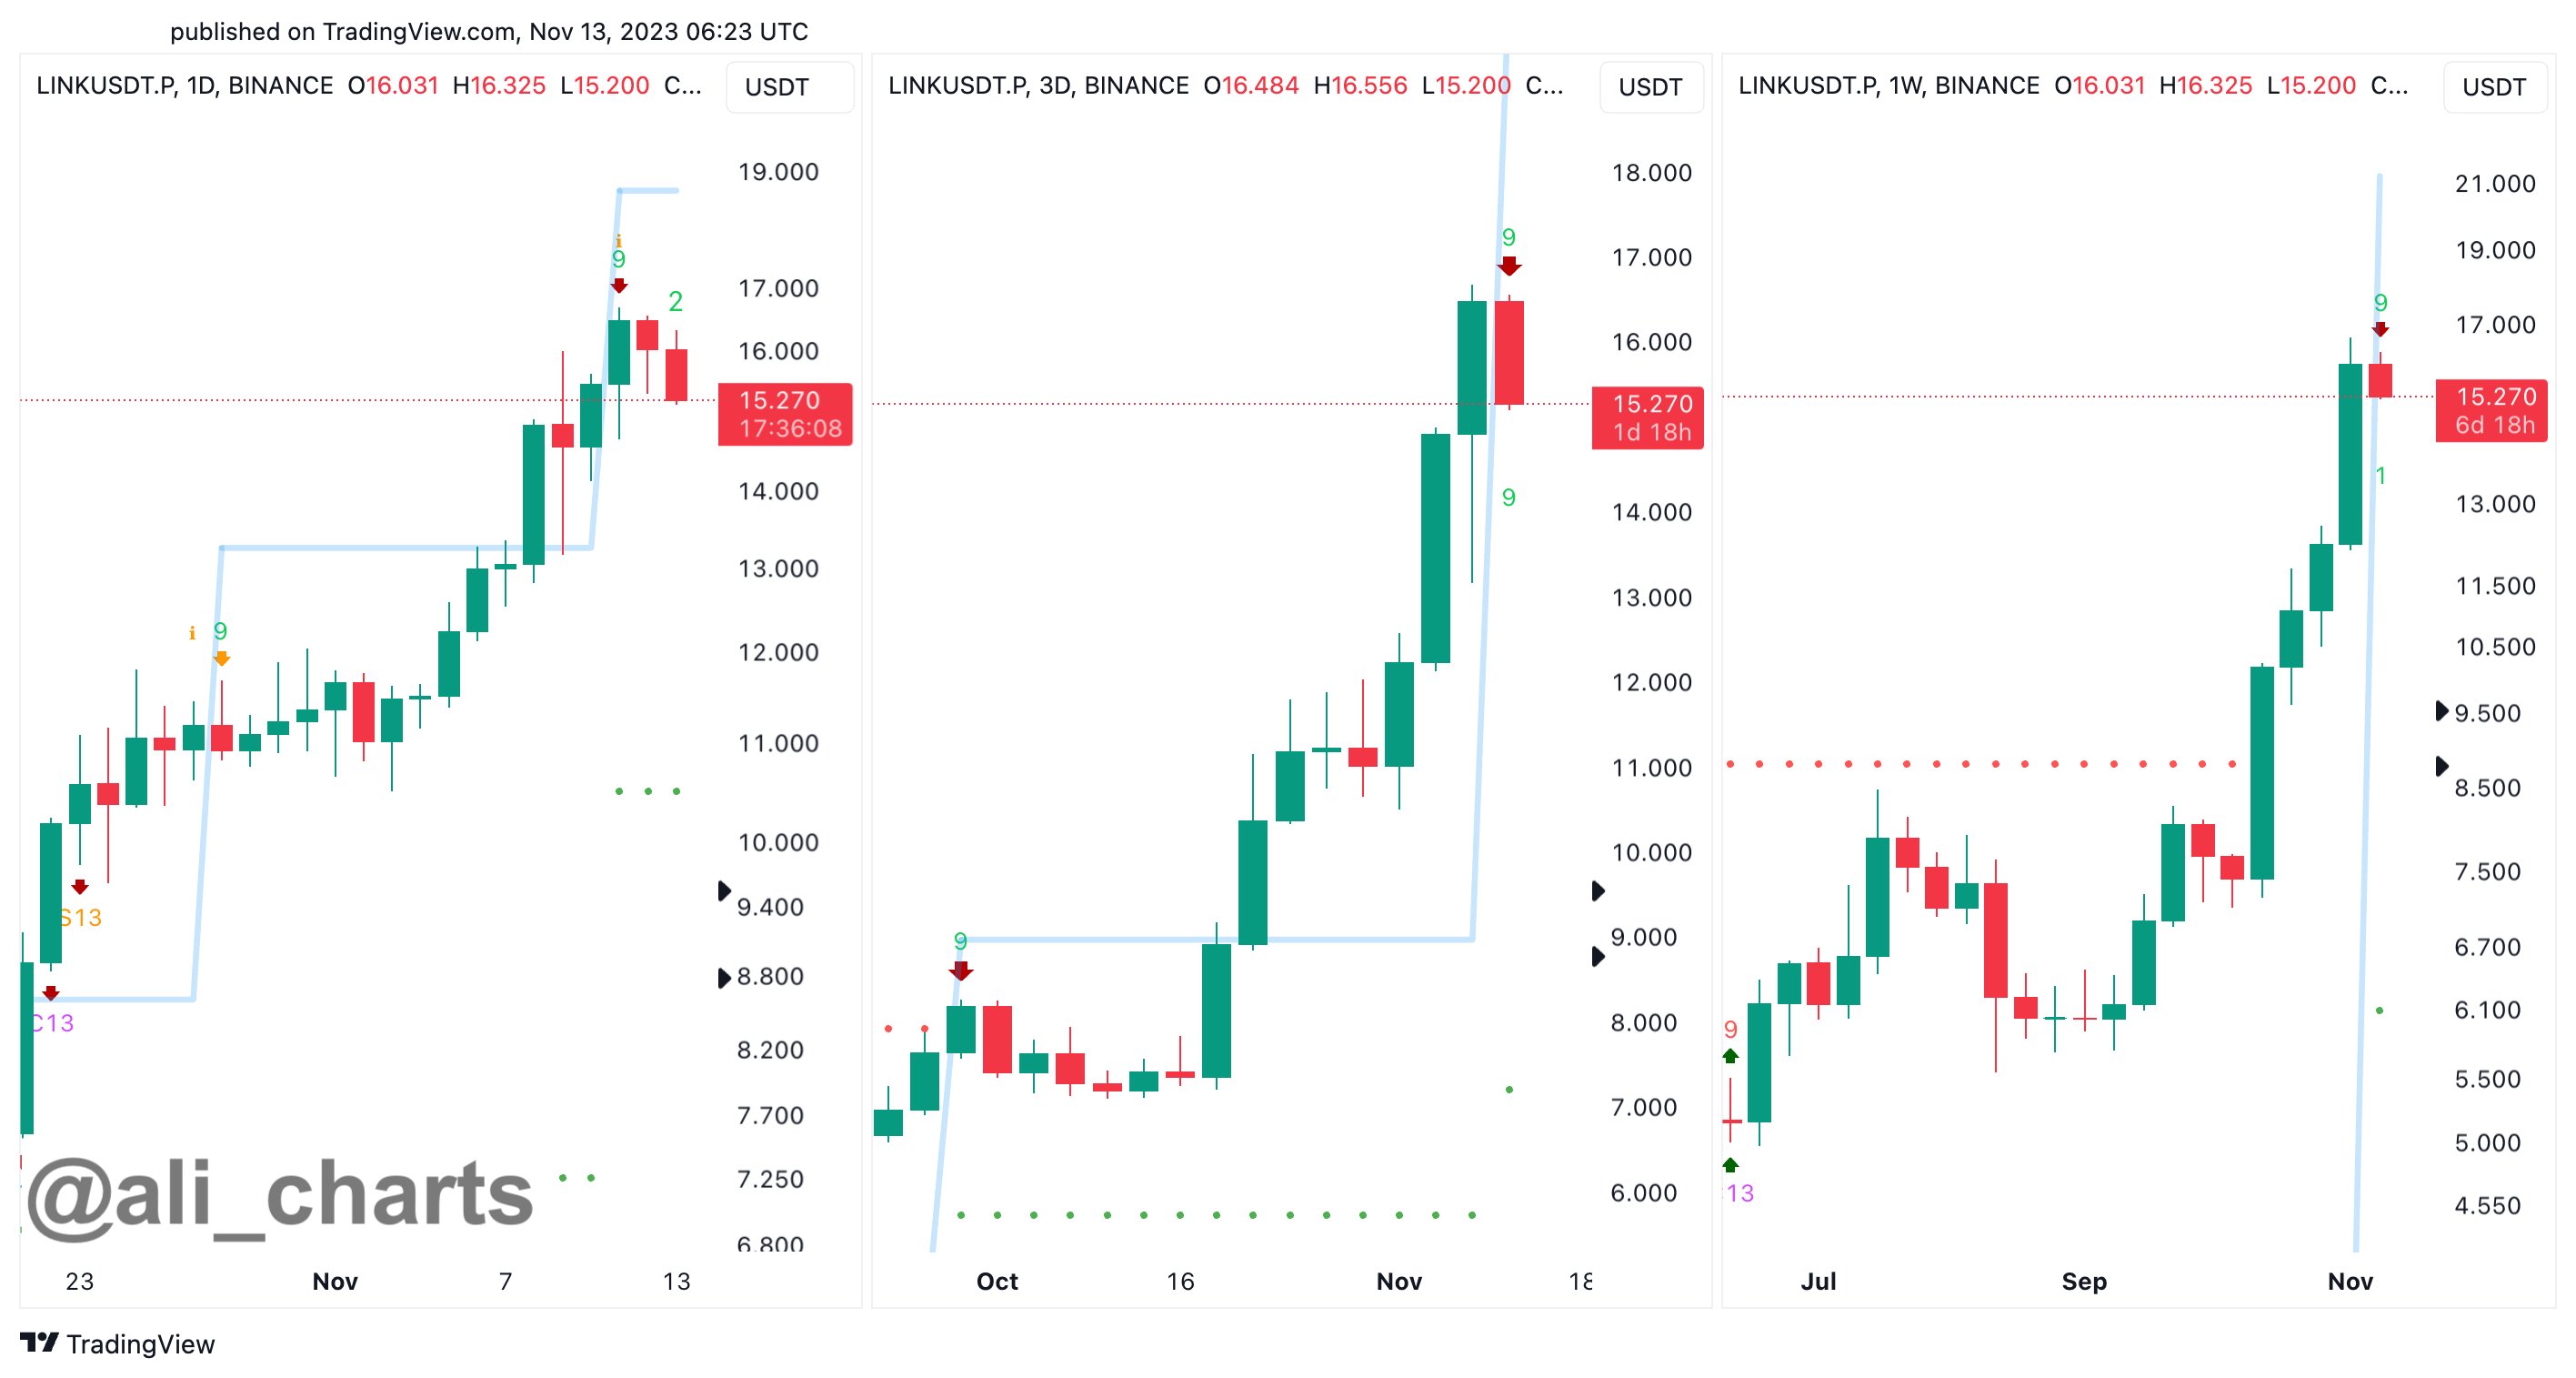
Just during the weekend, Chainlink had been floating above the $16 mark, but winds seem to have shifted for the coin in the past couple of days, as it has registered some drawdown.

During the last 24 hours alone, LINK has dropped around 6%, leading to its price slipping below the $14 level. The chart below shows how the cryptocurrency has performed in the past month.

Chainlink Price Chart

As displayed above, Chainlink had been riding some sharp bullish momentum in this period before this latest plunge, as the asset had more than doubled in value. Despite the decline, LINK is still up over 90% in the past month, which is an impressive return.

Naturally, the investors may be wondering now if the asset has already hit its peak for this rally or if there is more to come shortly. It’s hard to say anything about that, but perhaps on-chain data could provide some hints.

LINK Activity Has Been Relatively High Recently

In a new post on X, the market intelligence platform IntoTheBlock has shared the data of some Chainlink on-chain indicators. First, when the firm made the post, about 56% of the asset’s investors were sitting on some profit.

Chainlink Profit

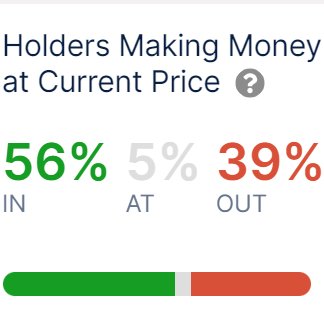
The cryptocurrency had then been floating at higher levels than currently (although not too high), so more LINK addresses would have entered a state of loss by now.

Generally, investors in profit are more likely to sell at any point, so a large amount of them being in the green could raise the probability of a selloff. Some Chainlink investors are currently harvesting their profits, but the profitability ratio is still not skewed that much towards profits.

Next, IntoTheBlock has talked about the number of transactions on the network.

Chainlink Transactions

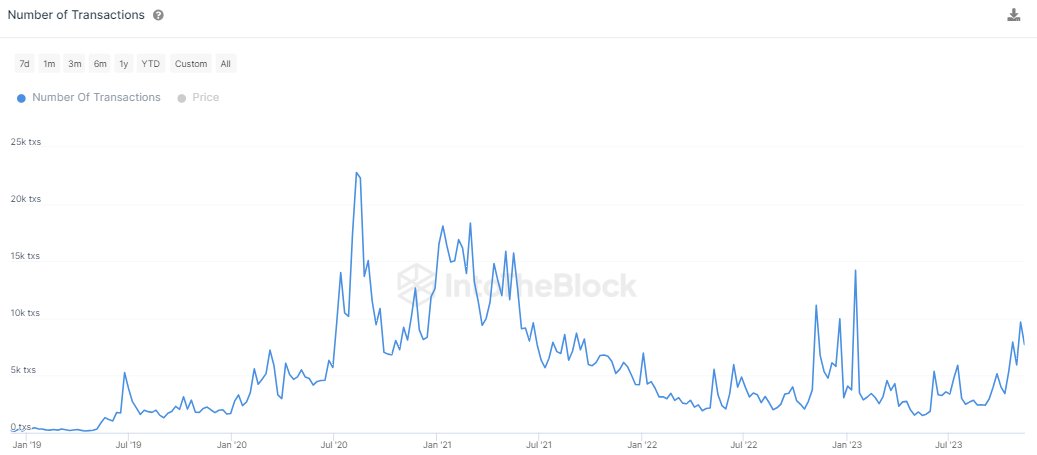
“The Chainlink network is showing many positive signs in terms of transaction data,” says the intelligence platform. “Notably, we see a healthy increase in the number of transactions.”

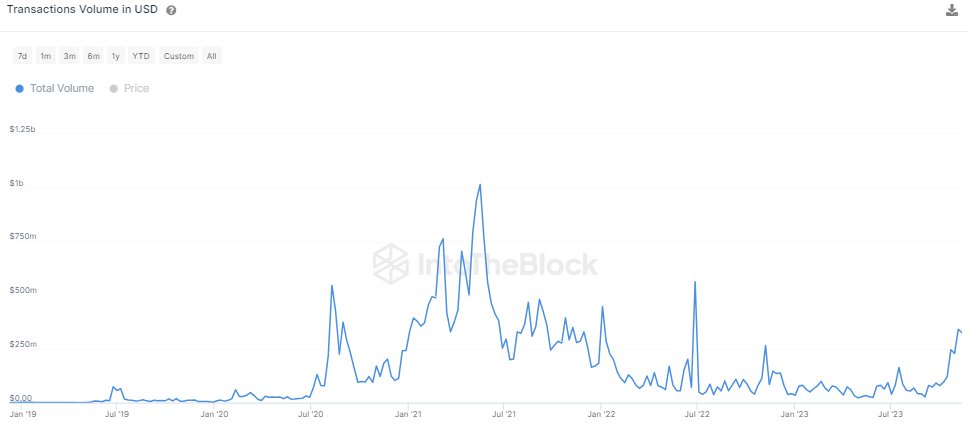
The number of transactions is up 436% from the monthly lows, and as is usually the case, the volume has also spiked alongside this rise.

Chainlink Volume

The transaction activity being high suggests there is interest behind the asset, and so, the price action shouldn’t go stale just yet. However, the volatility due to this activity can go either way, as the asset is already witnessing.

A metric that could more solidly point at a direction for the cryptocurrency is the large holder netflow, which keeps track of the net accumulation/distribution behavior over the last month for LINK holders carrying more than 1% of the supply.

Chainlink Whale Netflow

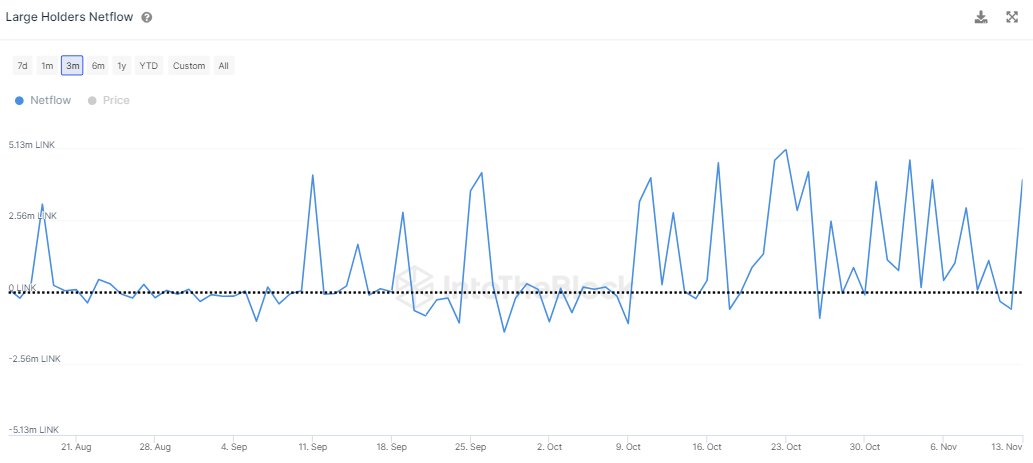
As is visible in the chart, the large Chainlink holders have been buying recently, which could potentially be a positive sign for the asset. This doesn’t have to mean that the rally would restart shortly, of course, but it does provide some support for the idea.

Chainlink Forms Sell Signal, Analyst Predicts Pullback To This Level

An analyst has pointed out how Chainlink is forming a TD Sequential sell signal right now, which could lead to a retracement to this level.

Chainlink Could Decline To $12.50 Following The Sell Signal

As explained by analyst Ali in a new post on X, LINK could be heading toward a correction based on what the TD Sequential signal says. The “Tom Demark (TD) Sequential” is a popular indicator in technical analysis that is used to pinpoint reversals in the price of any asset (which, in the current discussion, is naturally Chainlink).

The metric gives a signal whenever the asset has seen nine candles following a reversal in its price. The signal is a sell one if the candles are green, while it’s a buy one if the candles are red.

This phase is called the “setup phase.” Once the setup is done, a 13-candle long countdown phase kicks off. At the end of these 13 candles, the price could be believed to have hit another probable bottom or top (depending on whether the phase started with a sell or buy signal).

Chainlink has recently been enjoying some very rapid growth, which has led to the asset’s price hitting heights not seen since April of last year. This run, however, may be going toward at least a temporary setback, as according to Ali, a TD Sequential setup phase seems to have finished for the cryptocurrency recently. The signal has in fact appeared on not just one, but three of the coin’s price charts: daily, 3-day, and weekly.

Here are the charts as shared by the analyst:

Chainlink Sell Signal

As displayed in the above graph, the Chainlink TD Sequential setup phase has finished with green candles on all of these LINK charts, implying a reversal towards the bearish side may be imminent for the cryptocurrency.

Ali anticipates that the retracement would be towards the $12.50 level, which would mean a drawdown of more than 18% from the current price level of the asset. “Failing to hold above this critical support area could extend the losses to $10.50,” the analyst further adds.

Such a decline all the way to $10.50 would suggest a decrease of over 31% for Chainlink, but even if such a steep drop happens, LINK still wouldn’t have fully undone the recovery it has made since the last third of October, showing just how sharp the asset’s bullish momentum has been recently.

It now remains to be seen what trajectory the asset takes from here considering this bearish signal. So far, chances are not looking in the favor of the coin, as it has seen two red candles already since the pattern has formed, implying that the countdown phase might have begun.

LINK Price

Chainlink had risen above the $16.5 mark during the weekend, but the coin has taken a hit in the past day as it’s now close to the $15 level.

Chainlink Price Chart