Chainlink Becomes Crypto Winner With 21% Rally: What’s Driving This?

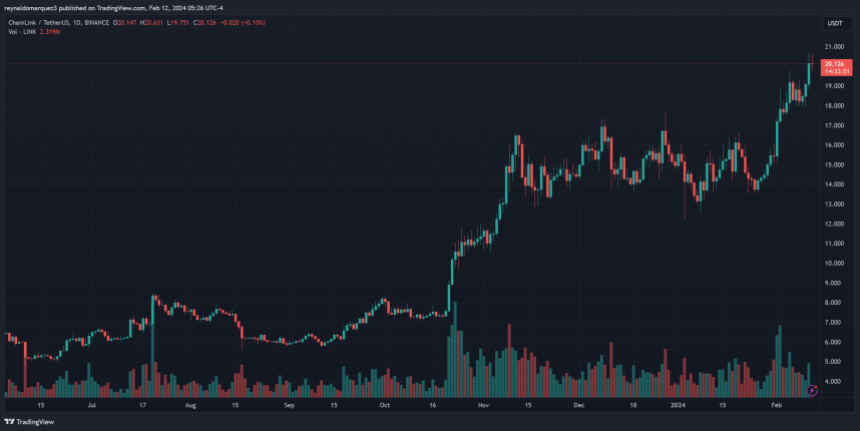
Chainlink (LINK) has enjoyed a sharp surge of more than 21% over the past 24 hours. Here’s what data suggests could be behind this rally.

Chainlink Has Surprised Crypto Market With Breakout In The Past Day

While most cryptocurrency sectors have seen flat or small green returns over the last 24 hours, Chainlink has shown a decoupling as it has observed some sharp bullish momentum in this window.

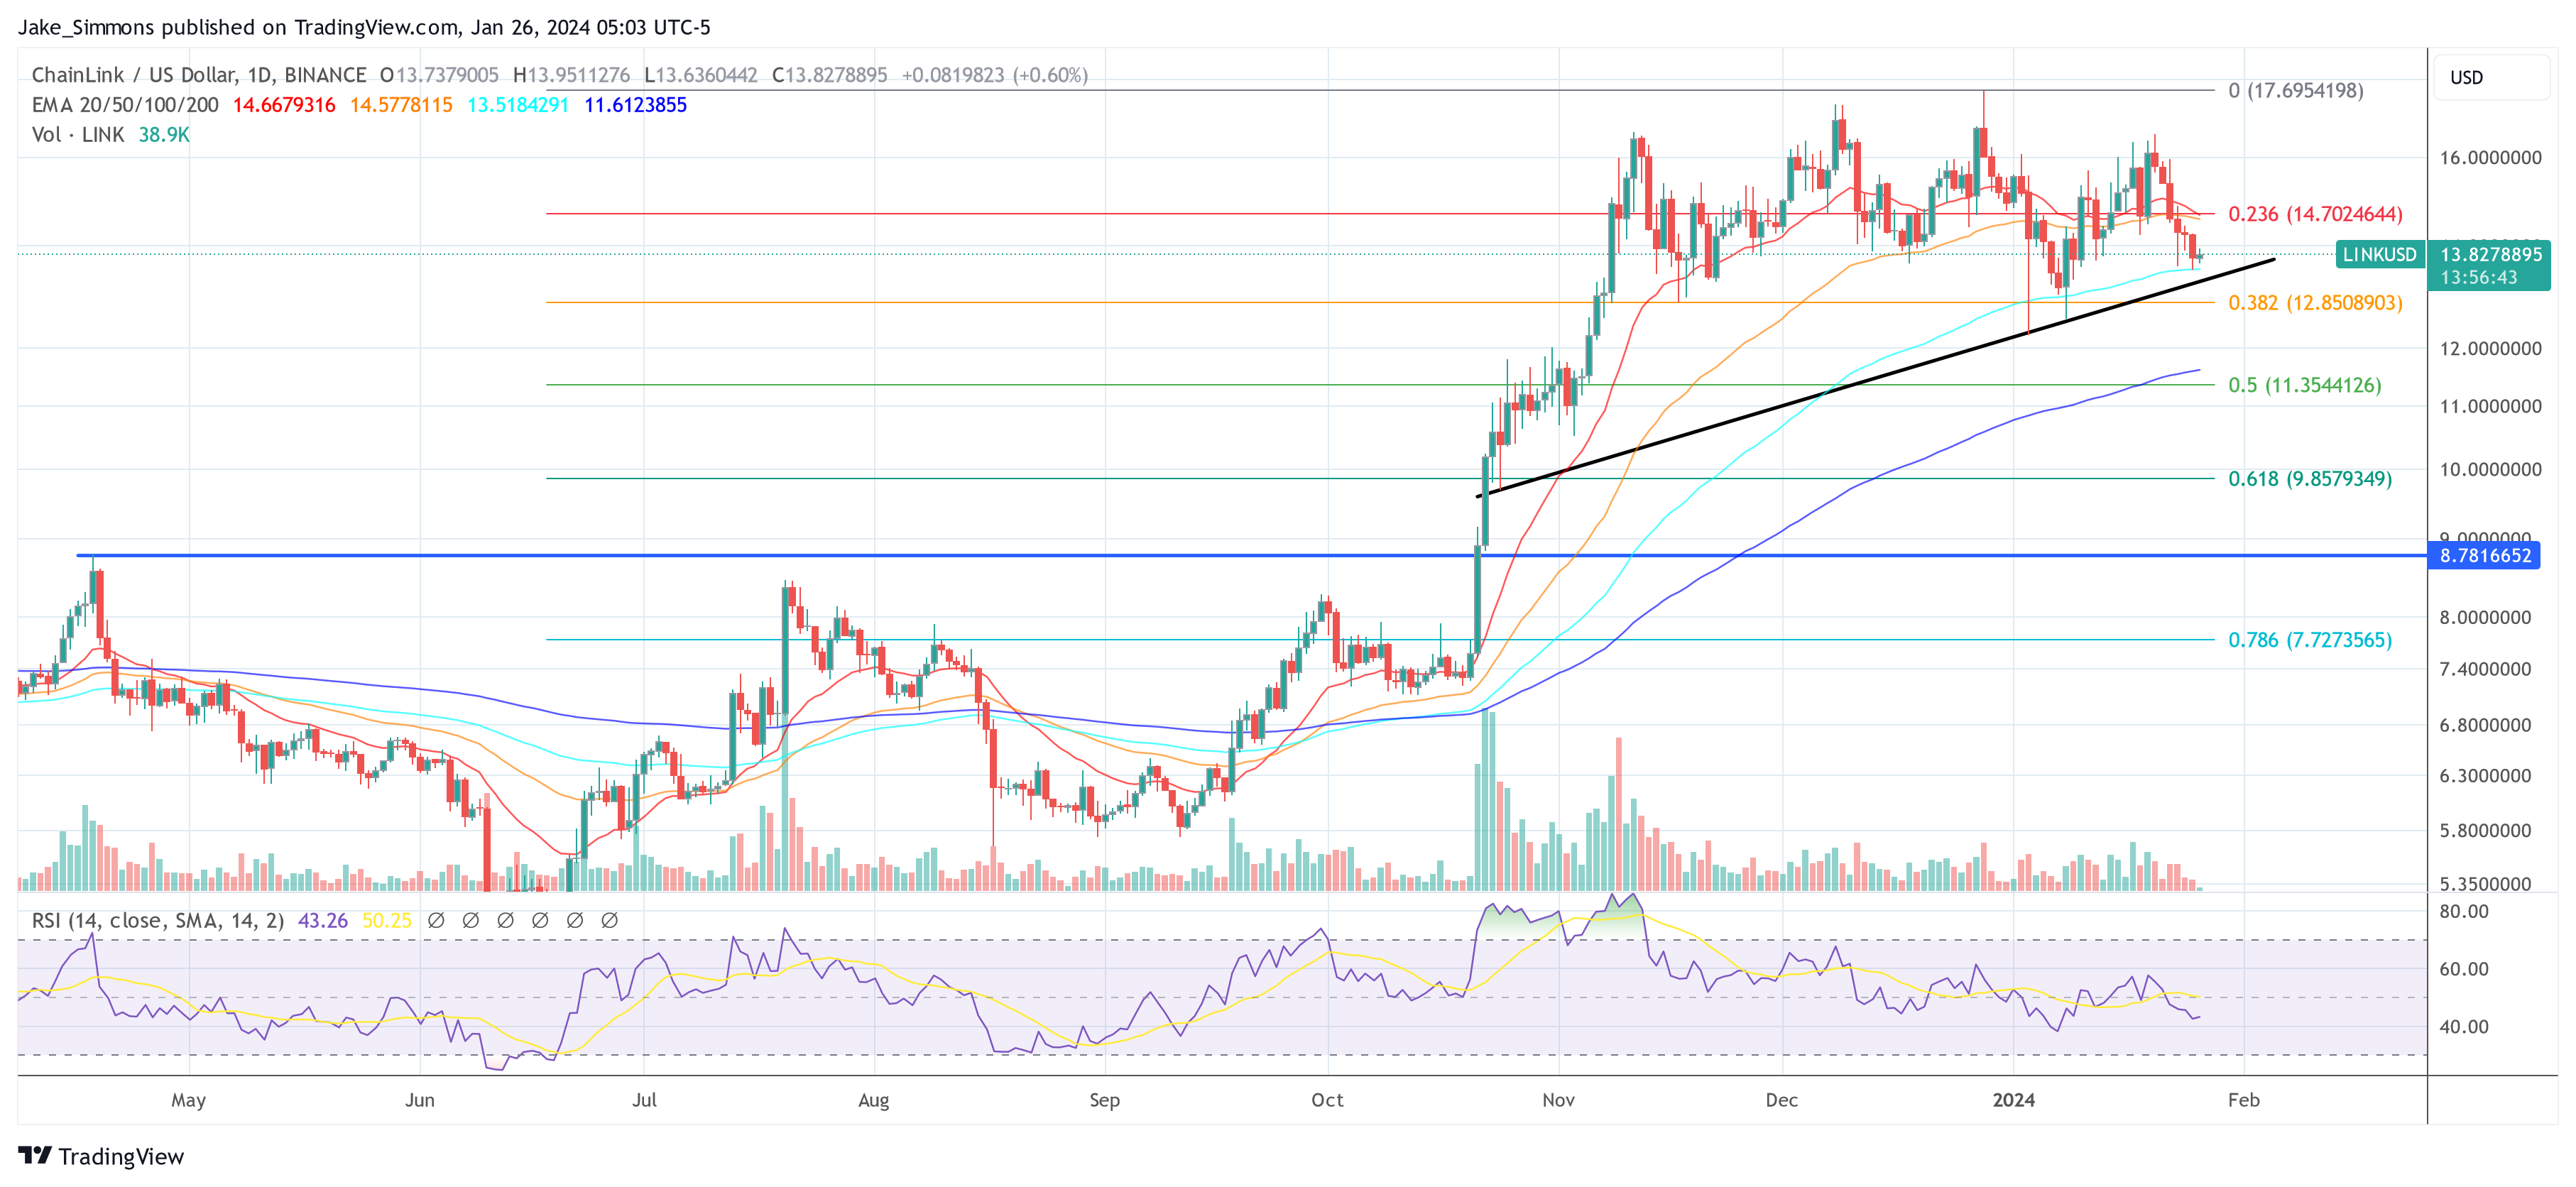
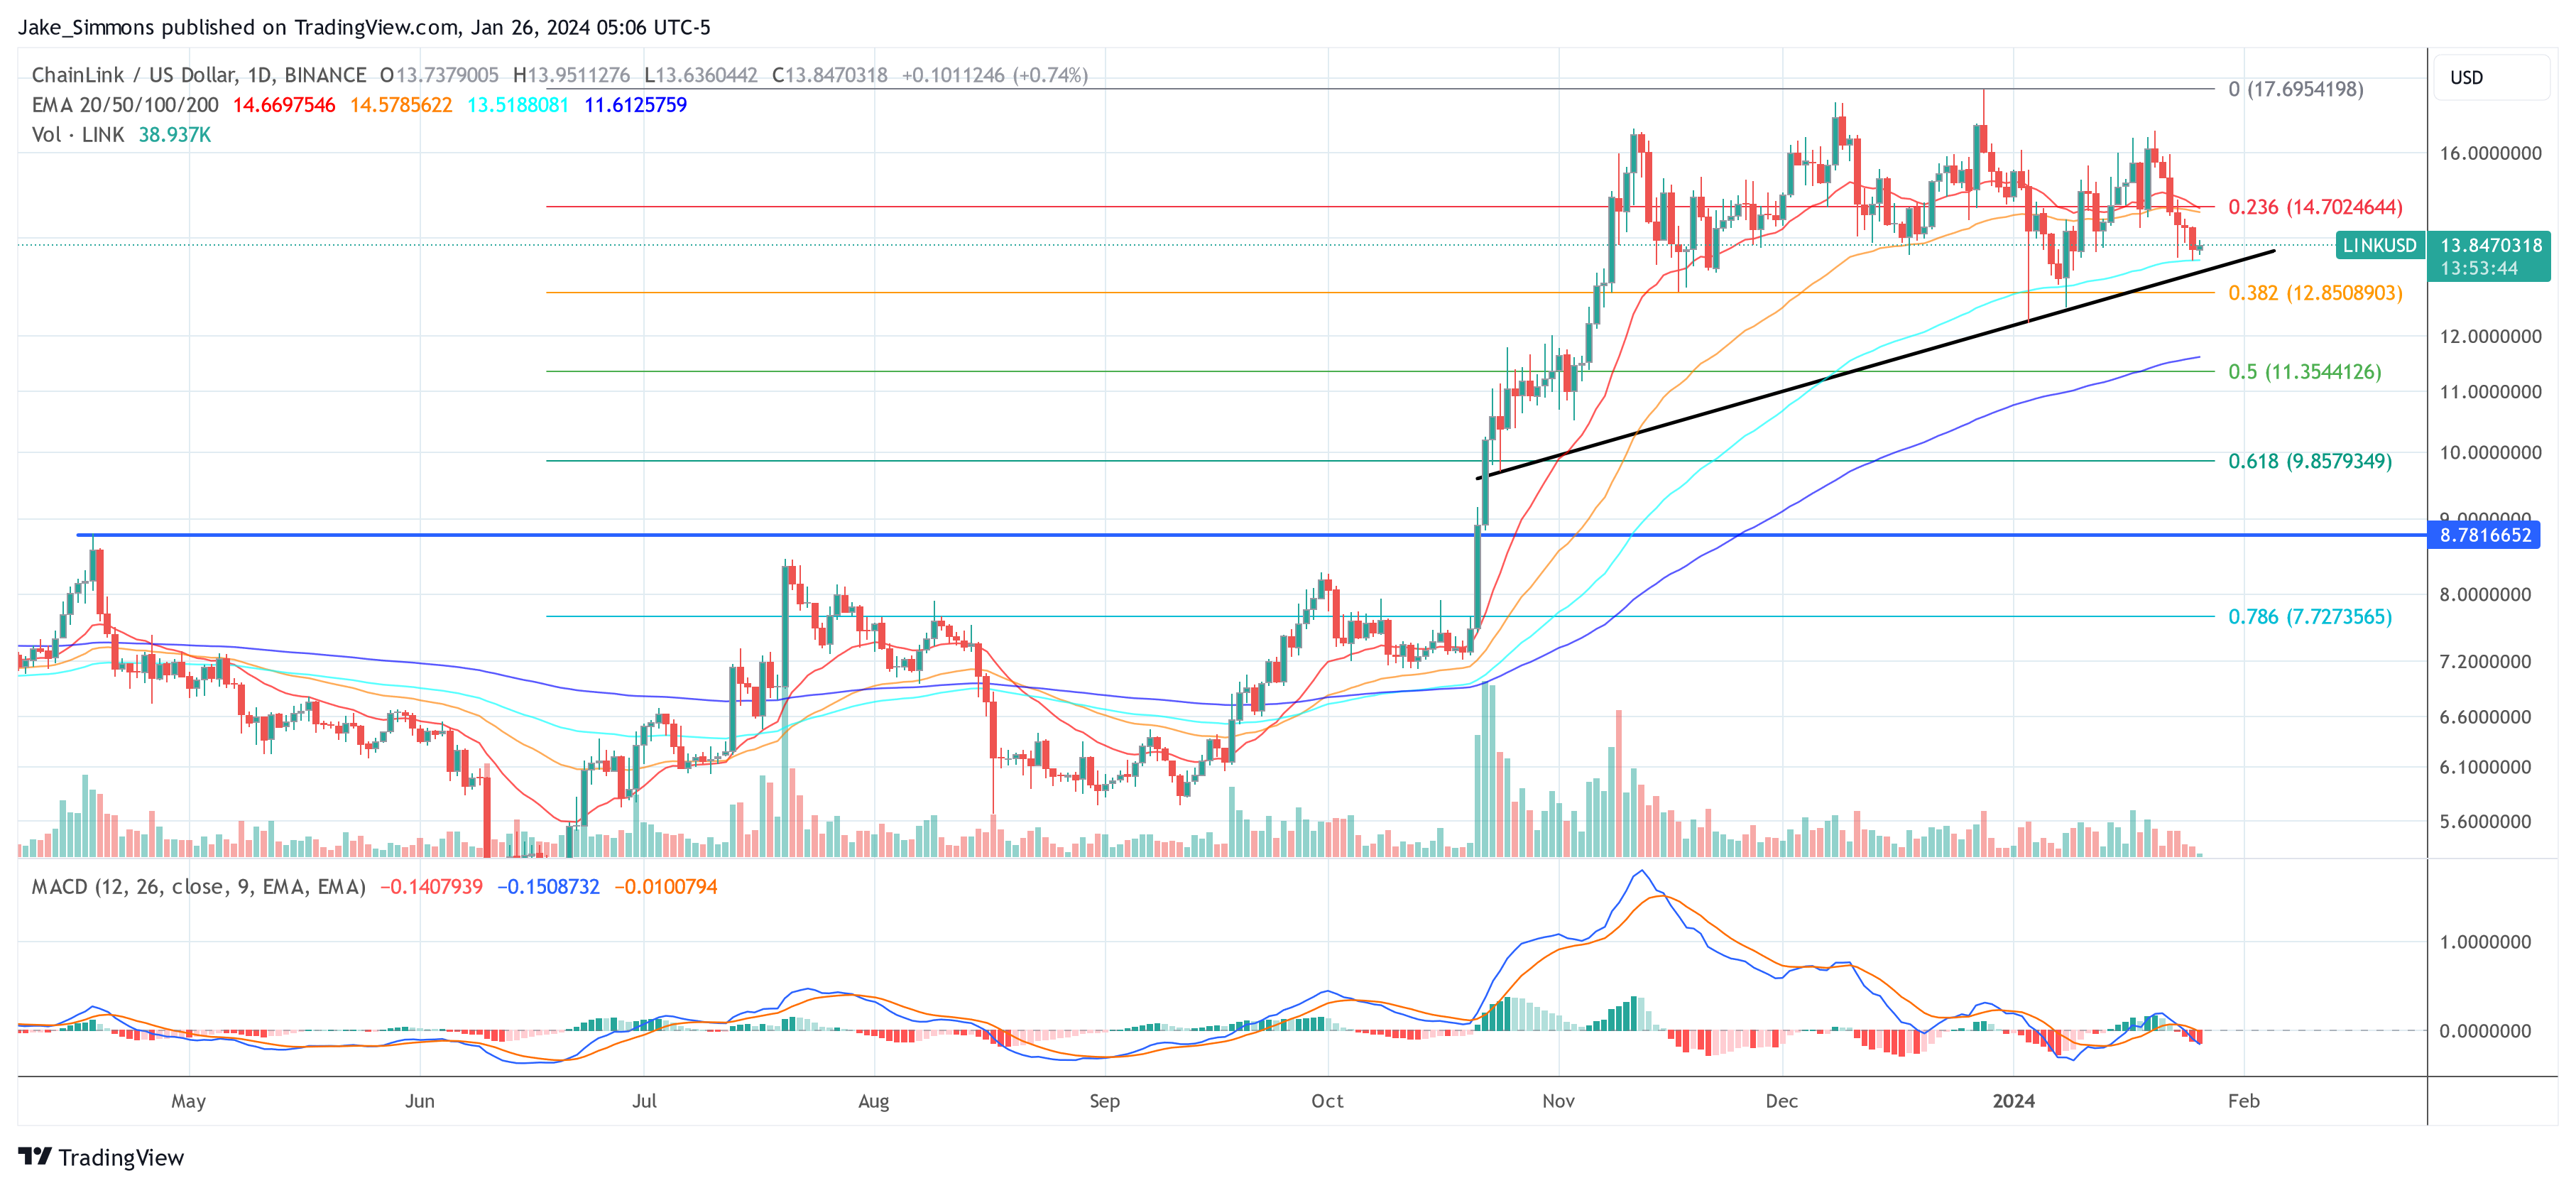
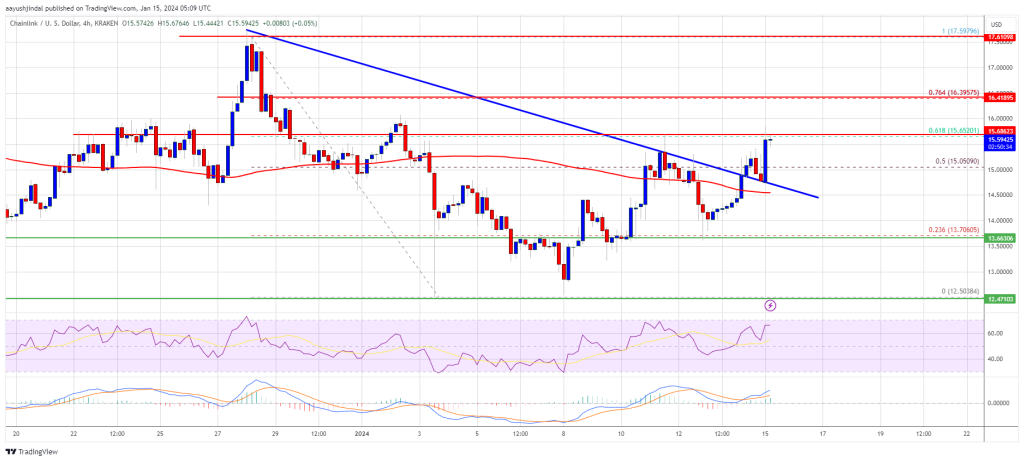
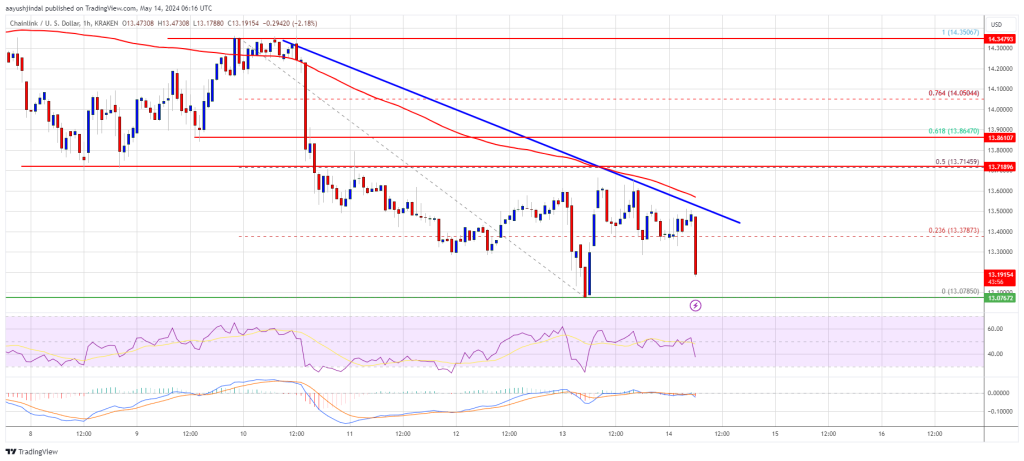
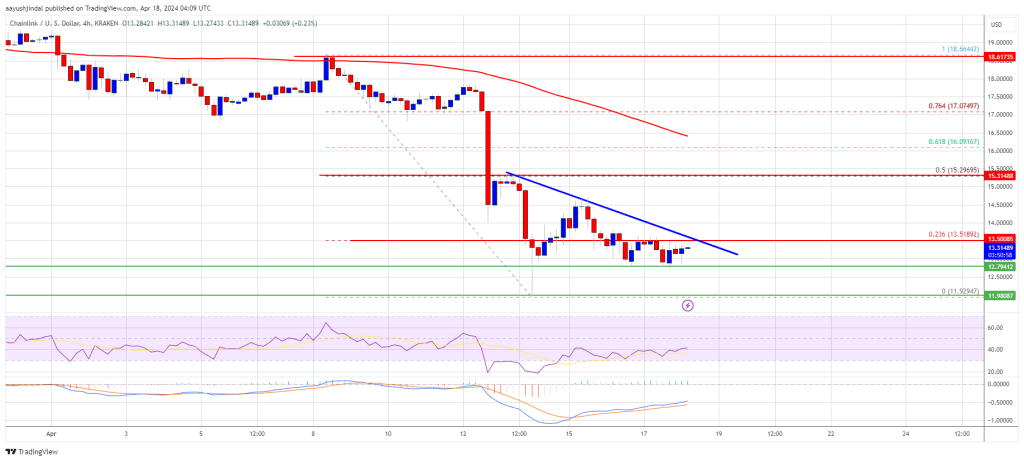
Here is a chart that displays how LINK’s recent performance has looked like:

Chainlink Price Chart

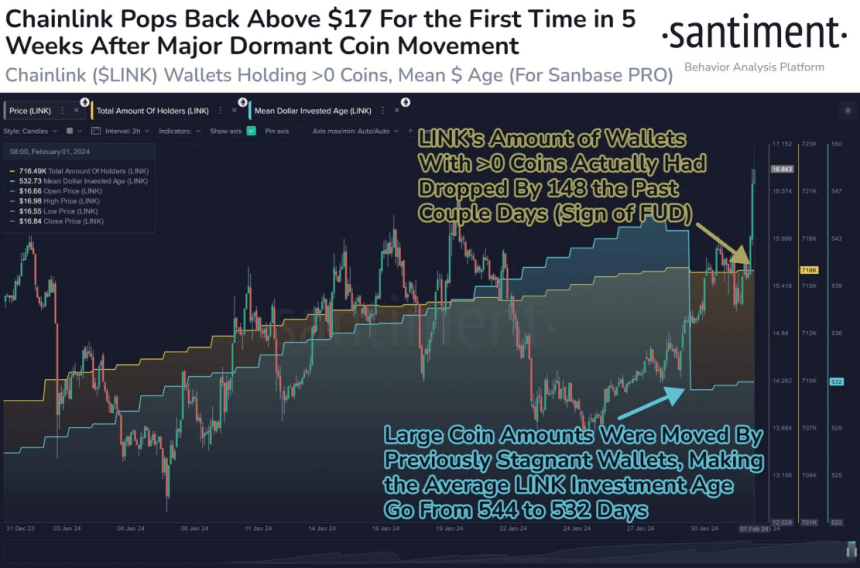
With this sudden burst, Chainlink has touched the $16.7 mark for the first time since the crash during the first half of April. While the asset has now retraced a major part of this plunge, it still hasn’t made a full recovery.

Should LINK’s bullish momentum continue, though, it may not be too long before the cryptocurrency can reclaim the $17.8 level it was trading at just before the crash.

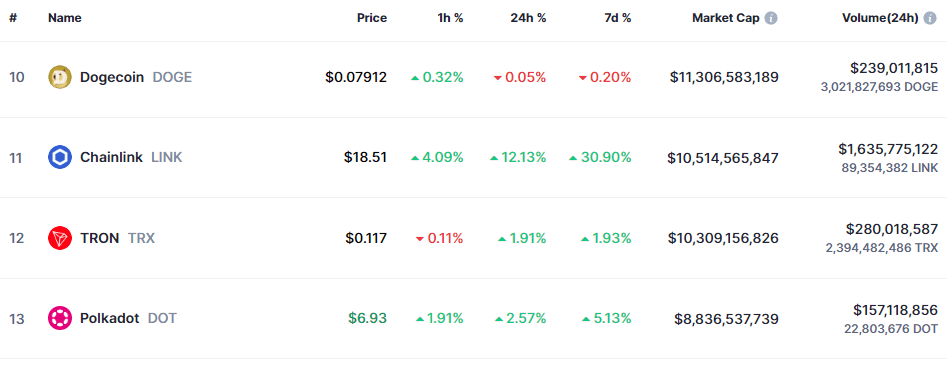
As for where Chainlink stands in the wider market, the table below shows that, based on market cap, it’s currently the 15th largest coin.

Chainlink Market Cap

LINK isn’t too far off from Polkadot (DOT) now, so it’s possible that if the price rise continues, the coin will dethrone DOT and take over the 14th spot on the list.

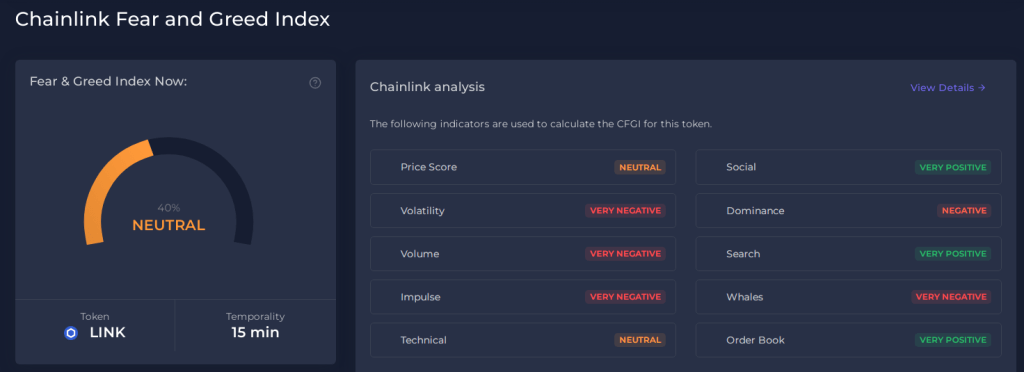
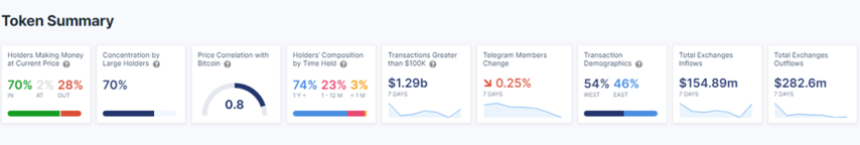
Now, what could be the reason for Chainlink’s sudden decoupling from the rest of the market? Data from the on-chain analytics firm Santiment may perhaps provide some hints.

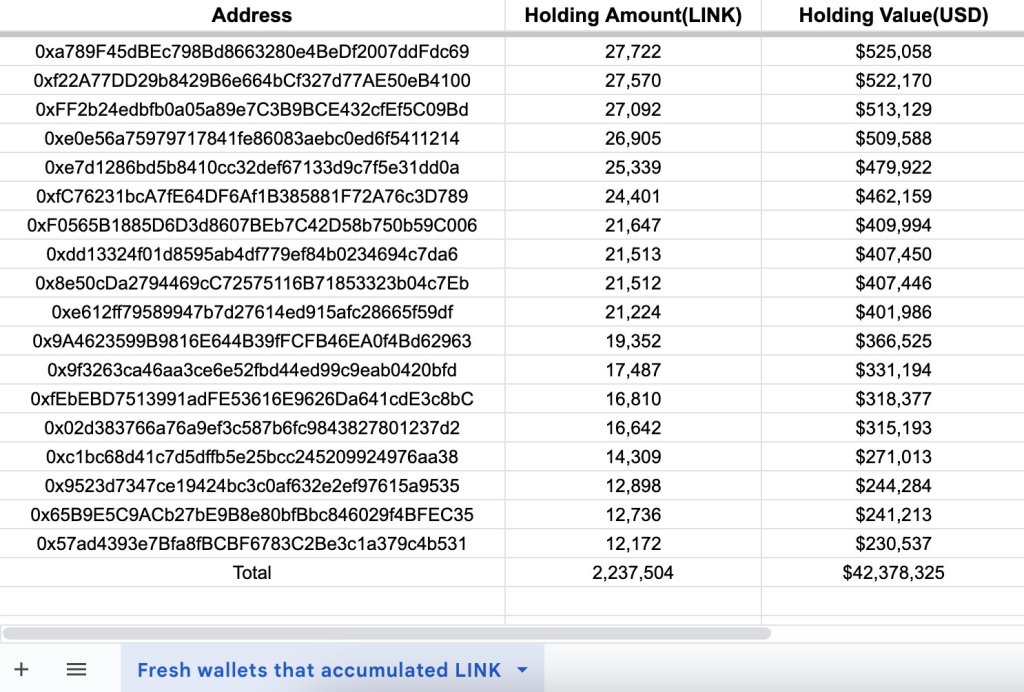
The Total Number Of LINK Whales Is At A 6-Month High Now

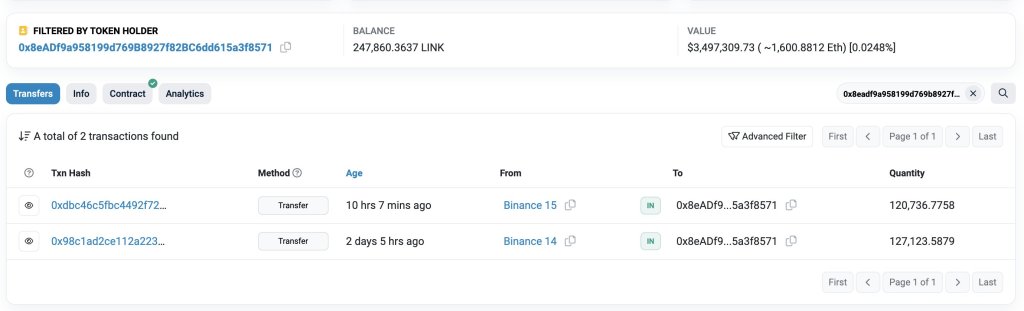
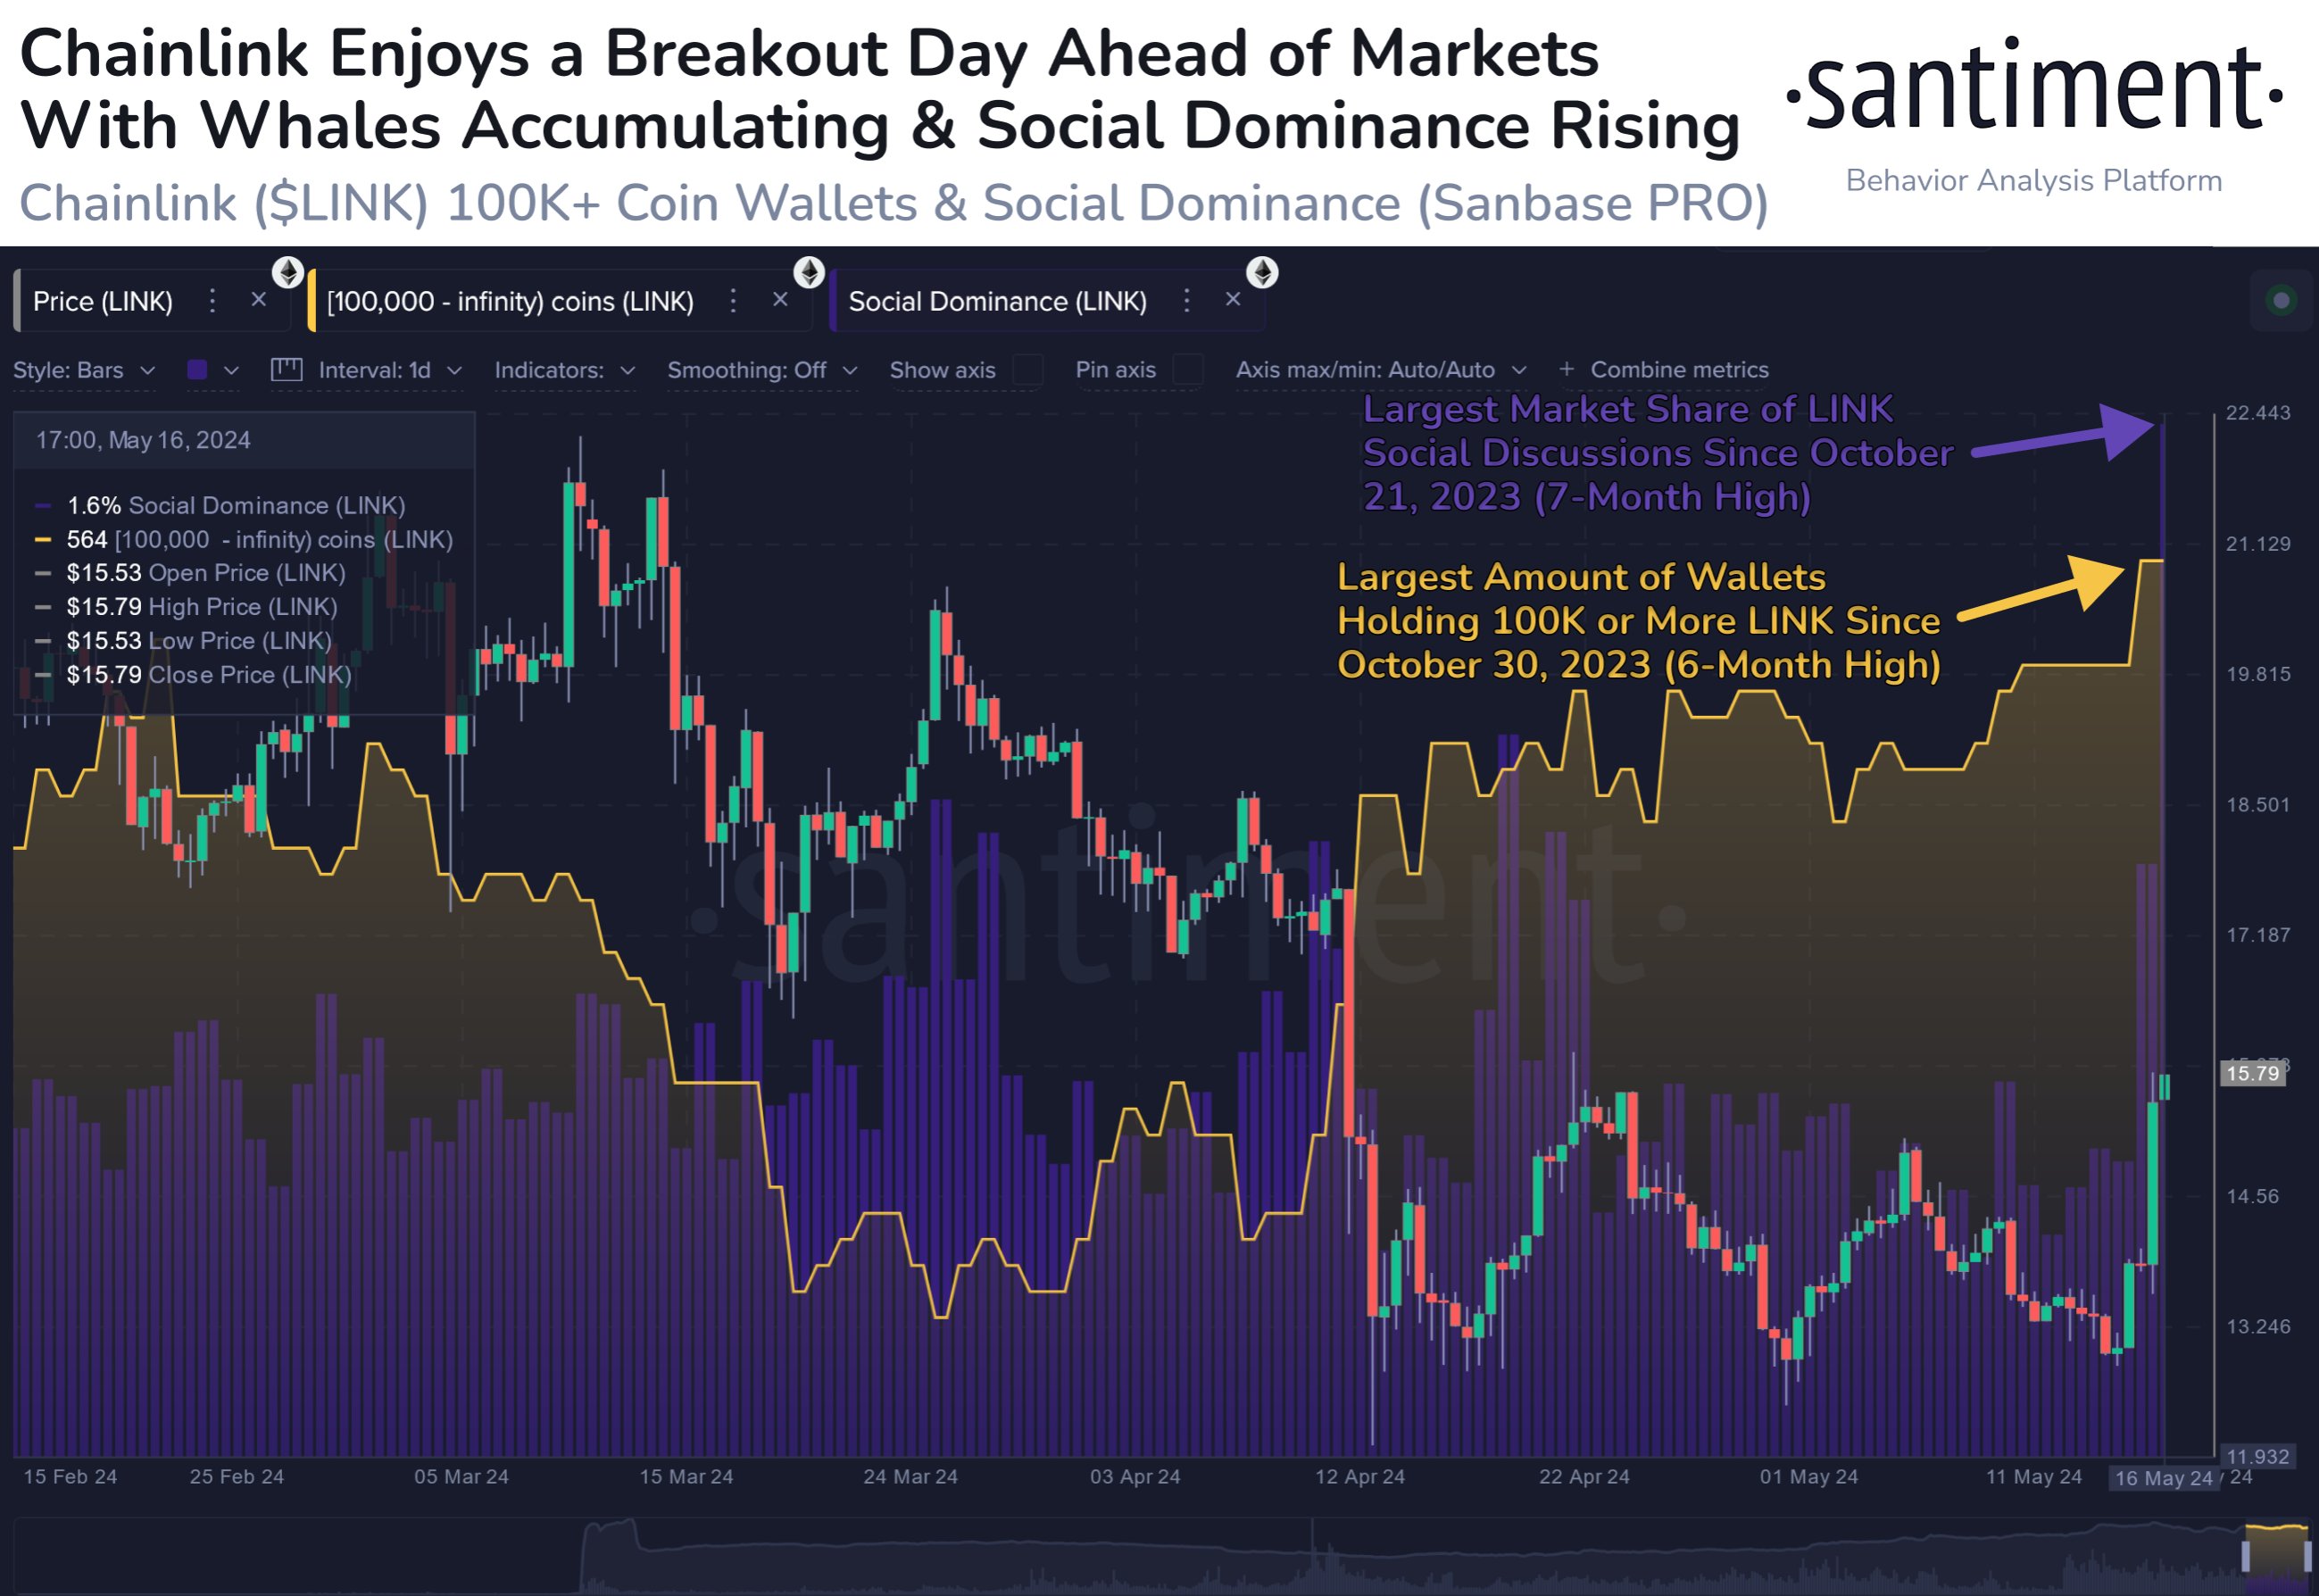
As pointed out by Santiment in a post on X, Chainlink investors holding 100,000 tokens or more of the asset in their balance have recently seen their address count increase.

Chainlink Whales

This cutoff is equivalent to around $1.67 million at the current LINK exchange rate. Investors with holdings this large are popularly referred to as whales.

Whales can be influential entities in the market because they can move a large amount of volume in a short span of time. As such, their behavior may be worth monitoring.

From the graph, it’s visible that Chainlink’s total number of whale addresses has hit 564 after the latest rise, which is the highest the metric has been since October of last year. This increase in the number of whales on the network may be partially behind the surge that LINK has just seen.

In the same chart, the analytics firm has also attached the data for another indicator: social dominance. This metric tells us about the share of cryptocurrency-related social media discussions that LINK occupies right now.

This indicator has shot up alongside this rally, implying the interest around the coin has spiked. Historically, such a rise in attention has been a bearish sign for the asset, so it remains to be seen if these high values will be maintained. “If social dominance calms and FOMO doesn’t take over, bullish conditions are ahead,” notes Santiment.

Chainlink’s (LINK) Outlook Grows Bleak: Signals of Bearish Continuation Surface

Chainlink’s LINK price is struggling to surpass the $13.80 resistance. The price could continue to move down if it breaks the $13.00 support.

  • Chainlink price is showing bearish signs below the $14.00 resistance against the US dollar.
  • The price is trading below the $13.60 level and the 100 simple moving average (4 hours).
  • There is a key bearish trend line forming with resistance near $13.50 on the 4-hour chart of the LINK/USD pair (data source from Kraken).
  • The price could start a decent increase if it clears the $13.80 resistance zone.

Chainlink (LINK) Price Turns Red

In the past few days, Chainlink saw a steady decline from well above the $13.80 level. LINK price declined below the $13.50 support level to enter a short-term bearish zone, like Bitcoin and Ethereum.

The price tested the $13.10 support zone. A low was formed at $13.07 and the price recently attempted a recovery wave. There was a move above the $13.50 level. It even jumped above the 23.6% Fib retracement level of the downward move from the $14.30 swing high to the $13.07 low.

However, the bears were active below the $13.80 resistance and the 50% Fib retracement level of the downward move from the $14.30 swing high to the $13.07 low. LINK price is still trading below the $13.80 level and the 100 simple moving average (4 hours).

Immediate resistance is near the $13.50 level. There is also a key bearish trend line forming with resistance near $13.50 on the 4-hour chart of the LINK/USD pair.

Chainlink (LINK) Price

The next major resistance is near the $13.80 zone. A clear break above $13.80 may possibly start a steady increase toward the $14.00 level. The next major resistance is near the $14.35 level, above which the price could test $15.50.

More Losses?

If Chainlink’s price fails to climb above the $13.50 resistance level, there could be a fresh decline. Initial support on the downside is near the $13.10 level.

The next major support is near the $12.80 level, below which the price might test the $12.20 level. Any more losses could lead LINK toward the $11.50 level in the near term.

Technical Indicators

4 hours MACD – The MACD for LINK/USD is gaining momentum in the bearish zone.

4 hours RSI (Relative Strength Index) – The RSI for LINK/USD is now below the 50 level.

Major Support Levels – $13.10 and $12.80.

Major Resistance Levels – $13.50 and $13.80.

Chainlink (LINK) Forms Bullish Pattern That Led To 50% Rally On Average

On-chain data shows that a Chainlink indicator is currently forming a pattern that has led to an average 50% increase for LINK in the past.

Chainlink 30-Day MVRV Ratio Has Plunged

In a new post on X, analyst Ali discussed the latest trend in Chainlink’s 30-day MVRV ratio. The “Market Value to Realized Value (MVRV) ratio” is a popular on-chain indicator that tracks the ratio between LINK’s market cap and realized cap.

The market cap naturally refers to the total valuation of the asset’s circulating supply at the current spot price. In contrast, the realized cap is a different type of capitalization model that calculates the total value of the cryptocurrency by instead taking the price at which each coin in circulation last moved on the network as its “true” value.

Since the last transaction of any coin was probably the last time it changed hands, the price at its time would signify its current cost basis. As such, the realized cap sums up the cost basis of every coin in circulation.

In this view, the realized cap would be nothing but a measure of the total capital the investors have used to purchase the asset. In contrast, the market cap represents the value that they are holding right now.

The MVRV ratio compares these two models, and its value can provide hints about whether the overall market holds more or less than it puts into Chainlink.

In the context of the current topic, the 30-day version of this indicator is of focus, which restricts itself to only the investors who bought within the past month. Here is the chart shared by the analyst that shows the trend in this LINK indicator over the past couple of years:

Chainlink MVRV Ratio

As displayed in the above graph, the Chainlink 30-day MVRV ratio has recently taken a sharp plunge and dipped under the 0% mark. The 0% mark is where the market cap and realized cap are exactly equal, so below it, the latter would be greater than the former.

When this is the case, the investors are carrying losses. This recent plunge into the negative has naturally come for the metric as the cryptocurrency’s price has plummeted, putting the 30-day buyers underwater.

In the chart, Ali has highlighted a specific pattern that Chainlink appears to have followed regarding this indicator, plunging deep into the negative territory. “Each time Chainlink MVRV 30-Day Ratio has dropped below -12.24% since August 2022, it’s signaled a prime buying opportunity, averaging 50% returns!” notes the analyst.

Recently, the indicator has declined towards 17.54%, meaning it’s below this level, which has historically led to profitable buying windows for the coin. It remains to be seen whether the pattern followed in the last two years will hold this time as well.

LINK Price

The past week has been terrible for Chainlink investors. The asset’s price has plunged by more than 23%, coming down to just $13.3 now.

Chainlink Price Chart

LINK Price Eyes Recovery If It’s Able to Hold One Crucial Level

Chainlink’s LINK price retested the $12.00 support zone. The price is now eyeing a recovery wave above the $13.50 and $15.00 resistance levels.

  • Chainlink price is showing bearish signs below the $15.00 resistance against the US dollar.
  • The price is trading below the $14.20 level and the 100 simple moving average (4 hours).
  • There is a key bearish trend line forming with resistance near $13.50 on the 4-hour chart of the LINK/USD pair (data source from Kraken).
  • The price could start a decent increase if it clears the $15.00 resistance zone.

Chainlink (LINK) Price Eyes Steady Increase

In the past few days, Chainlink saw a major decline from well above the $18.00 level. LINK price declined below the $15.00 pivot level to enter a short-term bearish zone, like Bitcoin and Ethereum.

The price tested the $12.00 support zone. A low was formed at $11.92 and the price is now attempting a recovery wave. There was a move above the $12.50 level. It even jumped above the 23.6% Fib retracement level of the downward move from the $18.66 swing high to the $11.92 low.

LINK price is still trading below the $14.20 level and the 100 simple moving average (4 hours). Immediate resistance is near the $13.50 level. There is also a key bearish trend line forming with resistance near $13.50 on the 4-hour chart of the LINK/USD pair.

LINK Price

Source: LINKUSD on TradingView.com

The next major resistance is near the $15.00 zone. A clear break above $15.00 may possibly start a steady increase toward the $16.00 level or the 61.8% Fib retracement level of the downward move from the $18.66 swing high to the $11.92 low. The next major resistance is near the $18.00 level, above which the price could test $20.00.

More Losses?

If Chainlink’s price fails to climb above the $13.50 resistance level, there could be a fresh decline. Initial support on the downside is near the $12.80 level.

The next major support is near the $12.00 level, below which the price might test the $10.80 level. Any more losses could lead LINK toward the $10.00 level in the near term.

Technical Indicators

4 hours MACD – The MACD for LINK/USD is gaining momentum in the bearish zone.

4 hours RSI (Relative Strength Index) – The RSI for LINK/USD is now below the 50 level.

Major Support Levels – $12.80 and $12.00.

Major Resistance Levels – $13.50 and $14.00.

Chainlink Facing Strong Rejection From Profit-Taking, Will CCIP Recharge Demand?

One analyst on X notes that Chainlink is facing a tug-of-war between bullish momentum and strong upside resistance from profit-taking traders. For bulls to add to their longs and extend the uptrend, the existing oversupply must be moped, paving the way for more gains above immediate liquidation levels. 

LINK profit taking | Source: Analyst on X

Profit Taking Slowing Down LINK Bulls

Looking at the LINK price action in the daily chart, it is clear that buyers have the upper hand. Bulls have been relentless since the token bottomed out in September 2023. 

Since then, LINK has doubled, even breaking above the psychological round number at $20. At press time, buyers are still in control, snapping back to trend despite the market-wide cool-off after Bitcoin crashed last week. 

Chainlink prices trending upward on the daily chart | Source: LINKUSDT on Binance, TradingView

LINK is within a broader range, with clear caps at around $17.9 on the lower end and $21.7 on the upper end. After protracted expansion from September, the emergence of a ranging market could suggest that traders are exiting their positions, slowing down the uptrend.

This has been confirmed by on-chain data that the analyst tagged, explaining the recent slowdown. Indeed, on-chain data suggests investors have been cashing in on the recent expansion.

As a result, the excess supply needs to be absorbed by the market before LINK Bulls builds enough momentum to drive the coin to new 2024 highs above $21.8.

 Chainlink CCIP Adoption To Recharge Demand?

Despite the short-term headwinds, Chainlink bulls are banking on the widespread adoption of the Chainlink Cross-Chain Interoperability Protocol (CCIP) as a demand catalyst. CCIP is critical for blockchain interoperability. The solution allows secure communication between smart contracts of linked blockchains and external data sources.

CCIP has been adopted by, among others, Metis, a layer-2 scaling solution for Ethereum. Circle, the issuer of USDC, a stablecoin, is also leveraging the platform to enhance interoperability.

Recent data shows a surge in CCIP revenue, pointing towards increased adoption of this multichain bridging platform. As of March 26, Dune Analytics data shows that the CCIP has generated over $484,000 in revenue. This figure will likely increase as CCIP finds adoption and Chainlink integrates with even more protocols, businesses, and blockchains. 

CCIP revenue | Source: Dune Analytics

Still, the pace at which LINK breaks above March highs and registers fresh 2024 highs will also demand the performance of other coins, including Bitcoin and Ethereum. A resurgent BTC could draw more capital, lifting altcoins, including LINK, in the process.

LINK Price Regains Strength, Why Chainlink Could Surge Over 10%

Chainlink’s LINK price is moving higher above the $20.00 resistance. The price is now up over 5% and might aim for a move toward the $25.00 resistance.

  • Chainlink price is showing positive signs above $20.00 against the US dollar.
  • The price is trading above the $20.50 level and the 100 simple moving average (4 hours).
  • There was a break above a key bearish trend line with resistance near $20.00 on the 4-hour chart of the LINK/USD pair (data source from Kraken).
  • The price could rally further if it clears the $22.00 resistance zone.

Chainlink (LINK) Price Eyes More Upsides

In the past few sessions, Chainlink bulls were able to send the price above a few key hurdles at $18.50. Earlier, LINK price formed a base above the $16.75 and started a fresh increase.

There was a break above a key bearish trend line with resistance near $20.00 on the 4-hour chart of the LINK/USD pair. The bulls pumped the pair above the $22.00 level. A new multi-month high was formed at $22.85 before the price started a downside correction.

There was a move below the $22.00 level. The price declined below the 23.6% Fib retracement level of the upward move from the $16.75 swing low to the $22.85 high.

LINK is now trading above the $20.50 level and the 100 simple moving average (4 hours). The price is up over 5% and outpacing both Bitcoin and Ethereum. If the bulls remain in action, the price could rise further. Immediate resistance is near the $21.80 level.

LINK Price

Source: LINKUSD on TradingView.com

The next major resistance is near the $22.00 zone. A clear break above $22.00 may possibly start a steady increase toward the $23.00 and $24.20 levels. The next major resistance is near the $24.80 level, above which the price could test $25.00.

Are Dips Limited?

If Chainlink’s price fails to climb above the $22.00 resistance level, there could be a downside correction. Initial support on the downside is near the $21.00 level.

The next major support is near the $20.00 level or the 50% Fib retracement level of the upward move from the $16.75 swing low to the $22.85 high, below which the price might test the $18.80 level. Any more losses could lead LINK toward the $17.65 level in the near term.

Technical Indicators

4 hours MACD – The MACD for LINK/USD is gaining momentum in the bullish zone.

4 hours RSI (Relative Strength Index) – The RSI for LINK/USD is now above the 50 level.

Major Support Levels – $21.00 and $20.00.

Major Resistance Levels – $22.00 and $23.00.

Chainlink Open Interest Sitting At Record Levels, What This Means For Price

Chainlink has seen its open interest spike significantly in the month of February, so much so that it has reached new all-time highs. This trend has not waned despite the decline in the price of the cryptocurrency, which could paint a rather bullish picture for the LINK price going forward.

Chainlink Open Interest Crosses $450 Million

The Chainlink open interest ended the month of January on a high note and carried this trend into the month of February. A major jump was seen between January 31 and February 3 when the open interest went from below $250 million to more than $320 million.

In the days following this, the open interest continued to rise, and eventually hit a peak of $533 million. This was significant because it was not just the highest point for the year but it is the highest that the open interest has ever been for the asset.

Chainlink Open interest

As expected, the price would quickly rise to keep up with the open interest as investors continued to place their bets on the price. There has been a retracement in the open interest. However, Chainlink has continued to maintain more than $450 million in open interest since February 12.

Currently, Coinglass data shows that the Chainlink open interest is $456 million as of February 23, continuing to maintain a high level. Given this, it might be prudent to look at how the LINK price has reacted in the past when open interest remained elevated.

Historical Performance Of The LINK Price

While the Chainlink open interest is at record levels, there have been times in the past where the open interest had been elevated for a period of time like it is now. So, how the price reacted during those periods could provide a pointer for how it might perform now.

The last time that the open interest was this elevated for a long period of time was back in October-November 2023 when open interest more than doubled. It would maintain this elevated level for almost a month, but at the end of it, the LINK price would react positively and saw a price surge from $11 to $15, which was a 36% increase in price.

If this scenario were to repeat now, then a 36% increase would send the LINK price to $24. This is not particularly hard to believe, given that the LINK price had topped out at $52 in the last bull market. So, such a move would still leave it 50% below its all-time high levels.

On the flip side of this, the open interest levels could also taper off, as was seen in November 2023. This could see the LINK open interest lose its hold on the $450 million that it maintained in February and fall toward $400 million before recovering again.

Chainlink Takes Over Dogecoin In Key Metric As Mysterious Whale Pushes LINK Upwards

Chainlink (LINK) is now experiencing three weeks of robust positive price activity, putting it well ahead of the overall cryptocurrency market. LINK’s price has skyrocketed over 48% since January 25, surpassing $20 on February 11 for the first time since February 2022.

Amidst this price surge, which saw the cryptocurrency moving closer to Dogecoin in market cap rankings, on-chain data has revealed a consistent whale accumulation. One whale, in particular, has accumulated $83.6 million worth of LINK in the past five days.

Chainlink Overtakes Dogecoin In Market Cap

Chainlink’s price movement this year has been surprising, and current price action shows no intention of slowing down anytime soon. LINK, the decentralized oracle network’s token, recently overtook Dogecoin to become the 10th largest cryptocurrency by market capitalization.

At the time of writing, LINK’s market cap is $11.85 billion compared to DOGE’s $11.46 billion. The recent surge in LINK’s price and market cap seems driven by whales and investors accumulating the token.

According to data from IntoTheBlock, LINK whale transactions greater than $100,000 totaled more than $1.29 billion in the past seven days.

Notably, total exchange outflows in the same period have far outweighed inflows, indicating the current holding sentiment from LINK traders.

IntoTheBlock’s exchange metric shows that $282.6 million worth of LINK was withdrawn from exchanges in the past seven days, compared to an inflow of $154.89 million. 

chainlink linkusdt 2 link

One whale has been scooping up massive amounts of LINK from crypto exchange Binance in the past seven days. Blockchain data analysis platform Lookonchain has revealed that 4,556,684 LINK ($83.6 million) have been withdrawn from the exchange within the past five days and placed in 55 new wallets.

Although the outflow has gone into multiple wallets, the pattern of withdrawals suggests that one entity is carrying out the accumulation. 

What’s Next For LINK?

At the time of writing, Chainlink is trading at $20.21. Although still up by 9% and 36.13% in the past seven and 30 days, respectively, the price surge seems to be slowing down, and the crypto has since corrected 2% from a yearly high of $20.63 in the past 24 hours.

Chainlink LINK LINKUSDT

On the broader end, the crypto market seems to be catching up in gains, as most cryptocurrencies witnessed inflows led by Bitcoin last week. Dogecoin wasn’t excluded from this inflow, with its price spiking 7.3% from 0.0776 to 0.08327. Dogecoin is currently trading at $0.08046. 

LINK’s market cap currently stands above DOGE by $390 million. An increase in LINK accumulation by traders could continue to widen the difference between the assets. 

Chart from Tradingview

Chainlink Breeds New Whales As $49.9 Million Accumulation Spree Cause Prices To Surge

Chainlink (LINK) has traders buzzing as its price has been up by 40% since the last week of January, massively outpacing the broader cryptocurrency market. Amidst this price spike, mysterious whale wallets have been topping up their holdings, as evidenced by on-chain data. 

According to blockchain tracker Lookonchain, there’s been a massive outflow of LINK from crypto exchange Binance in the past two days, particularly with 49 new wallets receiving 2,745,815 LINK within this timeframe. 

Massive LINK Accumulation Occurs On Binance Before Withdrawal

Details from Binance point to an ongoing accumulation of LINK from the crypto exchange. In the middle of this accumulation, a particular whale or institution has been going on a buying spree, gobbling up more than 2.7 million LINK tokens worth $49.9 million. This accumulation came days after the Lookonchain noticed that four new wallets had withdrawn over 119,583 LINK tokens worth over $2.15 million from Binance.

Similarly, Lookonchain noted that another whale address “0x2A19” has withdrawn 494,957 LINK tokens worth $9 million from Binance in the past 10 days. Notably, whale transaction tracker Whale Alerts has also noted some accumulation of LINK tokens from other crypto exchanges.

Analytics platform Santiment also noted that LINK whale addresses have upped their activity amidst the price surge as large amounts of coins were moved by previously stagnant wallets. This influx of tokens back into the network’s circulation, coupled with a minor liquidation of wallets, seems to have contributed to the price spike.

How Will New Chainlink Whales Impact Price Action Going Forward?

The crypto industry is currently going through a modest price gain led by Bitcoin recently breaking above the $44,000 level again. As a result, the industry is now up by 3.25% in the past 24 hours, with a 22.60% increase in trading volume. 

LINK hasn’t been left out of this price gain, registering a 4.30% gain in the past 24 hours. However, LINK has been on a sustained breakout since January, reaching as high as $19.68 on February 5. 

The price spike isn’t particularly surprising, as fundamentals of the Chainlink ecosystem point to a steady price growth for LINK. Chainlink’s role in DeFi and NFTs with its smart contracts oracles cannot be overstated. Chainlink also recently released its Staking v0.2 protocol in December, allowing investors to stake a minimum of 1 LINK for a base floor reward rate of 4.5% per year in LINK.

Consequently, the massive accumulation of LINK by whales is a very bullish signal for the token’s price action going forward. These large investors see LINK’s long-term value and potential and are loading up their bags in anticipation of higher prices.

LINK price chart from Tradingview.com (Chainlink whales)

Whale Rapidly Accumulating Chainlink: What’s Going On With LINK?

A mysterious whale is rapidly accumulating Chainlink (LINK). According to Lookonchain, the unknown entity, possibly an institution, withdrew over 2.2 million LINK (worth $42.38 million) via 47 new wallets from Binance, the world’s largest crypto exchange by trading volume, in two days.

This sudden block withdrawal now raises questions about what’s driving the whale’s interest and what it could mean for LINK in the coming days.

Crypto whale accumulating LINK | Source: Lookonchain via X

Chainlink Is Key In DeFi And NFTs, Gradually Improving 

Chainlink is a popular project that provides secure middleware services and allows smart contracts to access tamper-proof external data. For this role, the platform has been adopted by multiple protocols offering decentralized finance (defi) services in Ethereum and beyond. 

Additionally, Chainlink plays a role in non-fungible tokens (NFTs) through its random number generator (RNG). It continues to release new products and enhance its features.

To illustrate, in November, Chainlink upgraded its staking mechanism, releasing v0.2, which significantly increased the pool size to 45 million LINK. 

The platform noted that the decision was to attract more investors and, more importantly, bolster its security while concurrently aligning with its broader objective of attaining the “Economics 2.0” plan.

Initially, staking began in December 2022. The goal was to incentivize participation by expanding the utility of LINK and allowing stakers to receive rewards. 

The release of v0.2 in November means more tokens can be locked, helping make LINK scarce, considering the role of the token in the vast Chainlink ecosystem. 

Trackers show that over 40.8 million LINKs have been locked so far. Chainlink confirms that anyone can earn a variable reward rate of 4.32%.

LINK staked | Source: Chainlink

Beyond staking, Chainlink’s Cross-Chain Interoperability Protocol (CCIP) is gaining adoption. To illustrate, the Hong Kong Monetary Authority (HKMA) initiated its first phase of e-Hong Kong Dollar (e-HKD) trials in November, integrating CCIP. 

As part of this trial, the regulator wanted to illustrate the capabilities of programmable payments enabled by Chainlink via its solution, CCIP. In DeFi, protocols such as Synthetix and Aave have adopted CCIP. 

Will LINK Breach $20?

With more protocols and traditional institutions leveraging the technology, the demand for LINK (and prices) will likely increase as the fear of missing out (FOMO) kicks in.

While the whale’s motives remain unknown, their large-scale LINK accumulation suggests they might be bullish on the token. Notably, it coincides with the sharp expansion of LINK prices in the past 48 hours. 

Chainlink price trending upward on the daily chart: Source: LINKUSDT on Binance, TradingView

So far, the token is changing hands slightly below the $20 psychological resistance. Any breakout above this level might lift the token to around $35 in Q3 2021.

Chainlink (LINK) Price Breaks Out Of Bullish Flag Pole, Here’s The Next Target

The Chainlink (LINK) price has been on an impressive rally over the last week that has brought its price to new yearly highs. As LINK bulls continue to hold firmly above the $18 support, the emergence of this bullish rally has continued to signal that the price surge is far from over.

Crypto Analyst Says Chainlink Bullish Flag Has Been Broken

In an analysis posted on the TradingView website, crypto analyst CobraVanguard explains why the Chainlink price is currently very bullish. According to the analyst, despite the altcoin showing very bullish signs, a lot of traders are failing to realize that this is the case.

They identified a flag pole that was created in the chart, and in this case, the flag for the LINK price was actually bullish. Even more interesting is the fact that the analyst revealed that the Chainlink price had successfully broken this flag, which they say is bullish for the price.

Chainklink price chart from Tradingview.com

“LINKUSDT is in a Bullish flag Patter,” the analyst said. “We can expect a bullish movement as much as the Measured Price movement (flag pole) to happen!” This further solidifies LINK’s entrance into its most bullish phase so far in 2024.

Another major factor that the analyst identifies for the LINK price at this level is that the price was testing the major supply zone at $18. At the time, the LINK price had not cleared this level. But at the time of writing, LINk has broken clean off this major supply zone and is now trending toward $19. “The Flag Is Broken,” the crypto analyst declared.

What Are The Targets For The LINK Price?

In the chart shared in the analysis, the crypto analyst identifies two major points of interest in the Chainlink chart and these are the Supply Zone and the Target Price. The first, which is the Supply Zone, is at $18.3, and the LINK price has already broken above this level.

Given this, the next major point of interest is the Target Price, and CobraVanguard puts this at the $27 price level. However, there is no straight shot toward this level as the analyst’s chart also shows a correction below the $13 support before rallying onto its target.

If this analysis holds over the coming days/weeks, then the LINK price could see a sharp 20% correction as the first sign. Then from there, a complete 100% move upward to bring the price to the $27 price target.

At the time of writing, LINK bulls continue to show dominance after a sharp 7% move in the last day. On the broader chart, the LINK price is up 27% in the last week, bringing its market cap to $10.9 billion.

LINK price chart from Tradingview.com (LINK Crypto analyst)

Chainlink Price Stalls As $287 Million Worth Of LINK Makes Its Way To Binance

The price performance of Chainlink is one of the previous week’s biggest narratives, rivaling Bitcoin making its way above $43,000 again. According to data from CoinGecko, the altcoin recorded a significant 25% price increase in the last seven days.

However, the price of LINK seems to be slowing down, as it keeps struggling to hold above the $18 level. While expectations are that this sluggishness will blow over soon, the question still is – why is the Chainlink price stalling?

16 Million LINK Tokens Transferred To Binance

The latest on-chain revelation has offered insight into why the price of LINK is facing some form of bearish pressure. In a post on X, crypto analytics firm SpotOnChain disclosed that 19 million tokens (worth about $341 million) were recently unlocked from three of Chainlink’s non-circulating supply contracts.

In a more detailed breakdown, the on-chain analytics firm revealed that 15.95 million tokens (valued at $287 million) were moved to Binance, the world’s largest centralized exchange. Meanwhile, the remaining 3.05 million Chainlink (worth $54.3 million) were transferred to multi-sig wallet, 0xD50f.

According to SpotOnChain, this is not the first time transactions involving Chainlink’s wallets and of this caliber will happen. The analytics platform disclosed that Chainlink has been unlocking and transferring some of the unlocked tokens to Binance as far back as 2022.

On-chain data shows that Chainlink has unlocked a total of 106 million tokens, with 88.95 million LINK sent to Binance since August 2022. At an average price of $9.06, the entire worth of these transactions stands at $805 million.

SpotOnChain noted that the last two unlocks have been followed by a slight dip in LINK’s price. The last unlock saw the Chainlink token fall from almost $19 to $17.5 on Saturday, February 3.

As of this writing, the LINK token is valued at $17.86, reflecting a nearly 1.5% price jump in the past day.

Chainlink Records Multi-Month High In Transaction Volume

It appears that the price of LINK will not remain stagnant for very long, as the most recent on-chain data indicates that Chainlink has experienced a notable increase in network activity over the last few days. Positive network fundamentals could be all the altcoin needs to resume its bullish run.

According to Ali Martinez, the network recently witnessed a significant surge in transaction volume, bringing the metric to its highest in almost two years. Based on IntoTheBlock’s data, more than 72.24 million LINK tokens (equivalent to $1.3 billion) were transacted on Friday, February 4. 

Chainlink

Chainlink Surges 12% To $18: Price Set To Retest $20 Next?

Chainlink has shot up over 12% to break $18 during the past day. A retest of the on-chain resistance wall at $20 could be next.

Chainlink Has Outperformed Market With Its 12% Rally

The past 24 hours have been green for most of the cryptocurrency sector, but the positive returns have been small for most of the market, with Bitcoin, the largest digital asset, only seeing profits of 1%.

Chainlink, however, has separated from the crowd during this period, rallying around 12%. The chart below shows how the coin has performed over the last few days.

Chainlink Price Chart

With this latest surge, Chainlink has surpassed the $18 level for the first time in almost two years. With profits of about 30% over the past week, LINK is by far the best-performing asset among the top 60 cryptocurrencies by market cap.

Speaking of the market cap list, LINK has now flipped Tron (TRX) to become the 11th largest asset in the sector following this recent strong performance. The table below shows where LINK stands among its peers in the sector right now.

Chainlink Market Cap

Dogecoin (DOGE) is the next coin above Chainlink now, and if the asset can continue its run, it should be able to flip the meme coin. While there is still some gap between their market caps, it isn’t too big.

Whether the coin can further this rally or not, perhaps on-chain data could provide some hints.

LINK Has Next Major On-Chain Resistance Wall Around $20

As explained by analyst Ali in a new post on X, LINK has significant on-chain resistance at $20. In on-chain analysis, the strength of a support/resistance level lies in the amount of BTC that the investors bought at it.

Below is a chart that shows the distribution of holder cost basis across the various LINK price ranges near the current price of the cryptocurrency.

Chainlink Resistance

When the analyst shared the chart, LINK was trading around $17.85, and the ranges until the $19.49 to $20.03 one weren’t too dense with investors. Chainlink has mowed through some of these weaker price levels since then, and the asset may continue to do so until it strikes the resistance wall around $20.

In total, 5,330 addresses bought 8.59 million LINK within this range. Generally, investors become more sensitive when the price retests their cost basis, so they may be prone to making some moves. For investors in loss like those inside this range, such a retest can mean an exit opportunity, as they might be desperate to get their money back.

This effect becomes more pronounced as investors share their cost basis inside the same range, so ranges with dense cost basis distribution can be a source of major resistance for the spot price.

Chainlink Price Surge Powers Altcoin Market, Bulls Aim For $20 Target

Chainlink (LINK), the leading oracle network on the blockchain, has been on a tear, outperforming the broader market with a 30% gain in the past week. This surge has pushed LINK’s price to $17.82, solidifying its dominance among altcoins, as bulls set their sights on the vaunted $20 target.

Chainlink On-Chain Activity Hints At Renewed Investor Interest

Analysts point to several factors driving the rally. Santiment, an on-chain data provider, revealed a surge in activity from previously dormant wallets, suggesting renewed investor interest. This is reflected in the “Age Consumed” metric, which measures the total number of days coins have been dormant before being moved. For Chainlink, this metric hit a 5.38 billion spike – the highest ever recorded.

Whales Accumulating, But Liquidations Pose Minor Threat

Santiment’s data also indicated minor liquidations from some wallets, a phenomenon often associated with fear or uncertainty. While these liquidations could trigger short-term volatility, they might also present buying opportunities for savvy investors. Additionally, reports suggest whales accumulating LINK, further fueling bullish sentiment.

The rationale behind this perspective lies in the understanding that fear-induced sell-offs might create temporary price dips, allowing savvy investors to acquire assets at more favorable prices.

Moreover, recent reports have indicated a pattern of whales accumulating LINK, contributing to the overall bullish sentiment surrounding the cryptocurrency. Whale accumulation, where large holders increase their positions, is often interpreted as a sign of confidence in the asset’s future potential.

Technical Analysis Paints Bullish Picture

Crypto analyst Michael van de Poppe identified a “higher low” on the LINK/BTC trading pair, which he considers a bullish signal. He predicts a potential breakout, with LINK reaching $25-$30 in the near future, fueled by a broader altcoin market rally. Van de Poppe even envisions a 50-80% surge for the altcoin market, pushing its valuation to a staggering $1.25 trillion.

While Van de Poppe’s analysis sparks optimism, it’s crucial to remember that expert predictions are not guarantees. The cryptocurrency market remains inherently volatile, and past performance is not indicative of future results.

CFGI At ‘Neutral’ 

Meanwhile, LINK’s “Fear & Greed Index” is currently positioned at 40, indicating a state of neutrality in the market sentiment. This numerical assessment reflects a balance between fear and greed among investors and traders in the context of Chainlink’s performance.

A “Neutral” reading on the Fear & Greed Index implies that the market is not heavily skewed towards either extreme optimism or pessimism. In such a scenario, investors may exhibit a measured and cautious approach, avoiding impulsive decisions driven solely by emotions.

This equilibrium in sentiment suggests that participants are likely assessing the market conditions with a more rational and balanced perspective, considering various factors before making significant moves.

The “Fear & Greed Index” serves as a valuable tool for market participants to gauge the prevailing sentiment and potential market trends. In the case of Chainlink’s current reading at 40, it signifies a market environment where neither excessive fear nor greed is dominating decision-making.

Featured image from Adobe Stock, chart from TradingView

Is Chainlink (LINK) Ready To Soar? Key Indicators To Monitor

Among the 20 most important cryptocurrencies by market capitalization, Chainlink (LINK) is currently recording the second-highest loss of -10.4 % in the last seven days. This puts it just behind Ethereum, which recorded a slightly sharper decline of -10.9 %.

Despite this, a glimmer of optimism emerges when delving into the 1-day chart of LINK/USD. The analysis suggests a potential turnaround on the horizon. Should the current market structure remain intact, there’s a promising indication that the recent corrective phase for LINK might be drawing to a close.

Chainlink Price Analysis: Indicators To Watch

Several key indicators and patterns emerge that warrant the attention of traders and investors alike. Firstly, the price action has been demonstrating a series of higher lows, which could be indicative of an ascending triangle pattern forming – a bullish continuation pattern. As long as the LINK price holds above the rising trend (black line) established in late October of the previous year, the bulls remain in control.

At press time, LINK was trading at $13.82, presenting a nuanced narrative in its Exponential Moving Average (EMA) positioning. A critical observation is that LINK’s price is buoyantly positioned above the longer-term 100-day and 200-day EMAs, recorded at $14.6679316 and $11.61, respectively. This configuration typically signals a robust long-term bullish momentum, underpinning investor confidence in the asset.

Contrastingly, the short-term outlook is conveyed by the positioning of the 20-day and 50-day EMAs. With the 20-day EMA at $14.67 and the 50-day EMA at $14.58, both hover above the current price level, imparting a potential resistance zone. This immediate overhead resistance is indicative of a short-term bearish pressure or consolidation phase, possibly reflecting a market pause as traders and investors reassess their positions.

Chainlink price

The Fibonacci retracement levels, drawn from the swing low in June to the peak in December, suggest that LINK has recently tested the 0.236 retracement level at $14.70 as resistance. The subsequent levels to watch are 0.382 at $12.85, followed by 0.5 at $11.53, which could serve as potential support levels if a bearish reversal occurs. Conversely, a break above the 0.236 level may open the door to test the $17.69 level, which stands as a significant resistance.

On the volume front, trading activity has been moderate, with no significant spikes indicating a decisive market direction. The Relative Strength Index (RSI) is hovering around the 50 mark, which typically denotes a neutral market sentiment without clear overbought or oversold conditions.

The MACD indicator exhibits a bearish signal with the MACD line at -0.1407939, positioned below the signal line, which is at -0.1508732. The negative value of the MACD line suggests that the short-term momentum is weaker than the long-term momentum, indicating bearish sentiment in the current market.

Furthermore, the distance between the MACD and the signal line is very narrow, as reflected by the small histogram value of -0.0100794. This small negative histogram value indicates a weakening of downward momentum, as the MACD line is close to crossing above the signal line.

Chainlink price

Traders might view such a crossover as a potential change in momentum, possibly hinting at an upcoming bullish phase. However, until the crossover occurs, the prevailing sentiment indicated by the MACD remains bearish in the short term.

LINK/BTC: Bulls In Control

The LINK/BTC trading pair (weekly chart) is also favoring the bulls. The descending trend line, which has historically acted as a resistance since the peak in 2020, was decisively broken in October last year. This breakout is a key development, indicating a potential reversal of the downtrend that has dominated the LINK/BTC pair for a significant period.

Following the breakout, a retest of the descending trend line occurred, a move often anticipated by technical analysts. The successful retest occurred in the second week of January, when the price bounced off the trend line, reinforcing it as a new support level.

This retest is indicative of a shift in market sentiment, where former resistance levels transform into support, a classical sign of a trend reversal. A breakout above 0.0004472, and LINK could be exploding towards 0.0006875 or even 0.0009.

Chainlink price

In summary, Chainlink’s technical posture is one of cautious optimism, with a clear upward trend since November but facing immediate resistance near the $14.70 level. Market participants should watch these technical indicators closely for signs of either a continuation of the uptrend or a potential reversal if support levels falter.

Chainlink Gets Whale Backing: LINK Price Up 14% Amid Market Dip

In the midst of the recent turbulence within the cryptocurrency market, Chainlink (LINK) has emerged as a notable outlier, demonstrating resilience against the sweeping downturn that has left major altcoins crumbling.

Surprisingly, LINK has steadfastly clung to the $16 mark, showcasing a 14% rally in the last seven days and defying the prevailing market trends. However, investors are left to ponder whether this is a promising sign for Chainlink’s future or merely a momentary blip in the radar.

Massive Chainlink Whale Purchase

This positive signal coincides with a notable $8.9 million whale purchase, injecting a substantial dose of confidence into the market. Yet, beneath the surface, murmurs of a whale exodus are causing concern.

This purchase also dampens some worries especially following a recent selling spree by Chainlink investors, who offloaded a significant 2.3 million tokens since January 12th.

The positive signal also comes after recent concerns in the absence of a noteworthy uptick in fundamental growth metrics such as network usage. Without substantial real-world adoption, the coveted $20 price point for Chainlink might remain an elusive mirage.

Chainlink’s Strengths Persist Amid Market Uncertainty

Meanwhile, IntoTheBlock’s global in/out of the money (GIOM) chart uses the historical entry prices of the current LINK holders to highlight critical levels of support and resistance.

In the near term, investors may opt for short-covering maneuvers to prevent falling into a net-loss position, a strategy that could lead to the consolidation of Chainlink’s (LINK) price just below the $15 threshold in the upcoming days.

Conversely, bullish market participants could potentially counter this bearish scenario by successfully pushing the price beyond the $20 territory. However, a potential hurdle arises from the fact that over 94,000 holders have accumulated 51 million LINK at a minimum price of $18.8.

This sizable accumulation suggests the possibility of bears establishing a formidable sell-wall in that price range, potentially triggering a retreat in LINK’s value.

The interplay of these dynamics underscores the delicate balance between short-term tactical moves and broader market sentiment that currently characterizes the trajectory of Chainlink’s price.

Despite the prevailing turbulence, the core strengths of Chainlink should not be overlooked. Its established role as a leading oracle provider within the blockchain ecosystem remains undiminished.

If the broader crypto market stages a recovery and fundamental growth aligns, a resurgence for Chainlink is not out of the realm of possibility.

Featured image from Freepik

Chainlink Rises 17% – Is LINK On Course To Hit $20 This Week?

Traders in the crypto realm are watching Chainlink (LINK) with bated breath as the price coils up near the $16 mark, hinting at a possible break out towards $17, or even $20 given the right conditions this week.

Since November, LINK has been consolidating between $13.00 and $17.00, exhibiting classic market cycle behavior that presents prime opportunities for savvy traders.

Technical analysts are buzzing with potential bullish scenarios, with many pointing to the current price action as the telltale sign of an “accumulation phase.” As per the renowned Wyckoff method, this phase sees sellers exiting, prices stabilizing, and indecision ruling the market.

Will Chainlink Hit The Vaunted $20 Mark?

Following accumulation comes the much-anticipated “markup phase,” characterized by surging buying pressure, rapid price increases, and heightened activity.

And that’s precisely what the charts seem to be foreshadowing for LINK. Indicators like the Awesome Oscillator and MACD are flashing green and pushing towards bullish territory, suggesting growing confidence and impending upward momentum.

The Relative Strength Index (RSI) also leans north, potentially primed to cross its signal line and add fuel to the bullish fire.

Further bolstering the optimistic outlook are the Simple Moving Averages (SMAs). Both the 100- and 200-day SMAs are pointing north, with the latter currently nestled comfortably at $9.994. This upward trajectory indicates the path of least resistance lies in ascending territory for LINK.

Should buying pressure build steam above current levels, analysts predict a potential leapfrog over the 50-day SMA at $16.95, paving the way for a psychological $17 price point. In a highly bullish scenario, LINK could even tap into its full $20 potential, marking a 20% surge from its current position.

17% Rally Ignites More Optimism For LINK

But a fresh spark ignites the conversation – Chainlink just surged 17% today, propelling it closer to the long-held $17 barrier. Could this recent rally be the catalyst that sends LINK rocketing past its immediate target and into uncharted territory?

It’s still too early to definitively say. While the technical indicators remain encouraging, external factors and market sentiment can shift rapidly. However, one thing is certain: Chainlink’s latest surge adds another layer of intrigue to its already captivating price action.

Whether it coils upward for a glorious breakout or succumbs to profit-taking, the next few days promise to be a thrilling ride for LINK holders and a fascinating case study for technical analysis enthusiasts alike.

Featured image from iStock

LINK Price Rallies Over 5%, A New Uptrend In Making For Chainlink?

Chainlink’s LINK price is moving higher above the $15.00 resistance. The price is now up over 5% and might aim for a move toward the $18.00 resistance.

  • Chainlink price is showing positive signs above $14.50 against the US dollar.
  • The price is trading above the $15.00 level and the 100 simple moving average (4 hours).
  • There was a break above a key bearish trend line with resistance near $14.85 on the 4-hour chart of the LINK/USD pair (data source from Kraken).
  • The price could rally further if it clears the $16.40 resistance zone.

Chainlink (LINK) Price Eyes More Upsides

In the past few sessions, Chainlink bulls were able to send the price above a few key hurdles at $14.50. Earlier, LINK price formed a base above the $12.50 and started a fresh increase.

There was a break above a key bearish trend line with resistance near $14.85 on the 4-hour chart of the LINK/USD pair. The bulls pumped the pair above the 50% Fib retracement level of the downward move from the $17.59 swing high to the $12.50 low.

LINK is now trading above the $15.00 level and the 100 simple moving average (4 hours). The price is up over 5% and outpacing both Bitcoin and Ethereum. If the bulls remain in action, the price could rise further. Immediate resistance is near the 61.8% Fib retracement level of the downward move from the $17.59 swing high to the $12.50 low at $15.65.

Chainlink (LINK)

Source: LINKUSD on TradingView.com

The next major resistance is near the $16.40 zone. A clear break above $16.40 may possibly start a steady increase toward the $17.50 and $18.00 levels. The next major resistance is near the $18.80 level, above which the price could test $20.00.

Are Dips Limited?

If Chainlink’s price fails to climb above the $15.65 resistance level, there could be a downside correction. Initial support on the downside is near the $14.50 level.

The next major support is near the $13.70 level, below which the price might test the $13.00 level. Any more losses could lead LINK toward the $12.50 level in the near term.

Technical Indicators

4 hours MACD – The MACD for LINK/USD is gaining momentum in the bullish zone.

4 hours RSI (Relative Strength Index) – The RSI for LINK/USD is now above the 50 level.

Major Support Levels – $15.00 and $14.50.

Major Resistance Levels – $15.65 and $16.50.

Chainlink Bullish Chart Pattern Hints At $34 Target – But Can It Break Through?

As the calendar turned to 2024, numerous cryptocurrencies experienced a positive start, and among them, Chainlink (LINK) stood out. The notable highlight was the emergence of a bullish pattern on Chainlink’s price chart, indicating a heightened likelihood of an impending bull rally.

This positive momentum in the early days of the year hinted at favorable market conditions for Chainlink and garnered attention from investors and analysts alike. The formation of this bullish pattern added an optimistic outlook to the prospects of Chainlink, creating anticipation for potential upward price movements in the near future.

Bullish Pennant Signals Potential Breakout For Chainlink

The Chainlink platform, which is compatible with Ethereum and well-known for enabling decentralized oracles, is currently trading above $15, data from Coingecko shows.

Ali Martinez, a popular crypto analyst, pointed out a bullish pennant pattern being formed on Chainlink’s chart.

The chart shows Chainlink’s price over the past few days. There is a bullish pennant pattern forming, which is a technical indicator that suggests a potential breakout to the upside.

The pennant is formed by two converging trend lines, one above and one below the price. The breakout occurs when the price breaks above the upper trend line.

Martinez has identified the resistance level at $17.2. If Chainlink’s price can close above this level, it could be a signal that a breakout is happening and that the price could rise to $34.

However, if the price falls below the support level at $14.2, it could be a signal that the bullish momentum is weakening and that the price could fall further.

Overall, the chart suggests that Chainlink is in a bullish position and that there is a possibility of a breakout to the upside. However, it is important to note that technical analysis is not always accurate, and there are many other factors that could affect Chainlink’s price.

Analysts’ LINK Predictions

Changelly cryptocurrency analysts have provided a price estimate for Chainlink for the next weekend. The analysts predict that this weekend, LINK will trade between a minimum of $16.28 and a maximum of $17.71. They anticipate that LINK will be valued at $17 on average.

Meanwhile, Lark Davis, another popular crypto analyst has a more fearless forecast for Chainlink. He said the coin will soon witness a significant surge and “shock the crypto world.”

Davis indicated that the Chainlink network had a promising future. He revealed that he had a sizeable portion of LINK, despite acknowledging the inherent dangers associated with cryptocurrency investing.

According to the analyst, Chainlink’s alliances and technology continue to undervalue it. The Grayscale Trust Trading at premiums exceeding 200% to the spot LINK price, Davis said, indicates that institutional investors are becoming more interested in LINK. The price projection for Chainlink indicates that it may increase to $126 in 2024.

Featured image from Shutterstock

Is Chainlink and Polygon About to Rip Higher? Whales Accumulating

According to Lookonchain data on December 20, whales are actively accumulating Chainlink (LINK) and Polygon (MATIC) and moving them from Binance, one of the world’s largest cryptocurrency exchanges by trading volume. 

Citing on-chain transfers, Lookonchain notes that LINK is specifically seeing significant accumulation from a fresh wallet labeled “0x8eAD,” which has withdrawn 247,860 LINK worth approximately $3.5 million from Binance in the past two days.

Meanwhile, two new wallets, “0xa813” and “0x38b3”, have been actively accumulating MATIC, withdrawing 5 million MATIC worth around $3.13 million from Binance earlier today.

Chainlink whale moves coins | Source: Lookonchain via X

Whales Accumulating, Will MATIC And LINK Rally?

The fact that whales, individuals, or entities controlling large amounts of a particular token or coin are circling MATIC and LINK is net bullish and might support prices in the coming sessions. 

Notably, the transfer is considered bullish when whales move coins from exchanges to non-custodial wallets like hardware wallets or even hot wallets to engage in decentralized finance (DeFi), degen trading, or NFT trading. 

This shift is because, unlike in centralized exchanges like Binance, where their intention is usually trading for other coins or USDT, in on-chain apps, they can use the same stash to earn rewards, for instance, by providing liquidity or staking. 

Therefore, considering the recent transfer, LINK and MATIC prices might recover, increasing in the coming few trading sessions. Thus far, looking at candlestick formations in the daily chart, LINK is stable and remains within an uptrend. Notably, prices are trading above the 20-day moving average, suggesting that the coin found support. LINK is currently up 155% from September lows but down 15% from November peaks. 

Chainlink price trending upward on the daily chart | Source: LINKUSDT on Binance, TradingView

On the other hand, MATIC is also stable and rejects attempts for lower lows. After days of consolidation, the coin has support at around $0.70, matching a critical level recorded in November. 

Still, whether the uptrend will resume depends on whether prices will float higher, breaking above $0.93 or November 2023 highs in the coming session. 

Technically, $0.95 marks a critical reaction level for MATIC that, if comprehensively broken, could open the doors for $1.20 and $1.60 in the coming sessions.

Polygon And Chainlink Roll-Out Critical Features

Beyond current technical formations, fundamental events prop up Polygon and Chainlink bulls, especially around decentralized finance (DeFi) and layer-2 scaling. 

Chainlink’s new staking upgrade aims to mop more LINK from circulation, possibly increasing prices on rising demand for Cross-Chain Interoperability Protocol (CCIP). 

Meanwhile, as other blockchains repurpose to become Ethereum layer-2, Polygon CDK is becoming a critical cog in fast-tracking the process, directly supporting MATIC prices.