Chainlink (LINK) Forms Bullish Pattern That Led To 50% Rally On Average

On-chain data shows that a Chainlink indicator is currently forming a pattern that has led to an average 50% increase for LINK in the past.

Chainlink 30-Day MVRV Ratio Has Plunged

In a new post on X, analyst Ali discussed the latest trend in Chainlink’s 30-day MVRV ratio. The “Market Value to Realized Value (MVRV) ratio” is a popular on-chain indicator that tracks the ratio between LINK’s market cap and realized cap.

The market cap naturally refers to the total valuation of the asset’s circulating supply at the current spot price. In contrast, the realized cap is a different type of capitalization model that calculates the total value of the cryptocurrency by instead taking the price at which each coin in circulation last moved on the network as its “true” value.

Since the last transaction of any coin was probably the last time it changed hands, the price at its time would signify its current cost basis. As such, the realized cap sums up the cost basis of every coin in circulation.

In this view, the realized cap would be nothing but a measure of the total capital the investors have used to purchase the asset. In contrast, the market cap represents the value that they are holding right now.

The MVRV ratio compares these two models, and its value can provide hints about whether the overall market holds more or less than it puts into Chainlink.

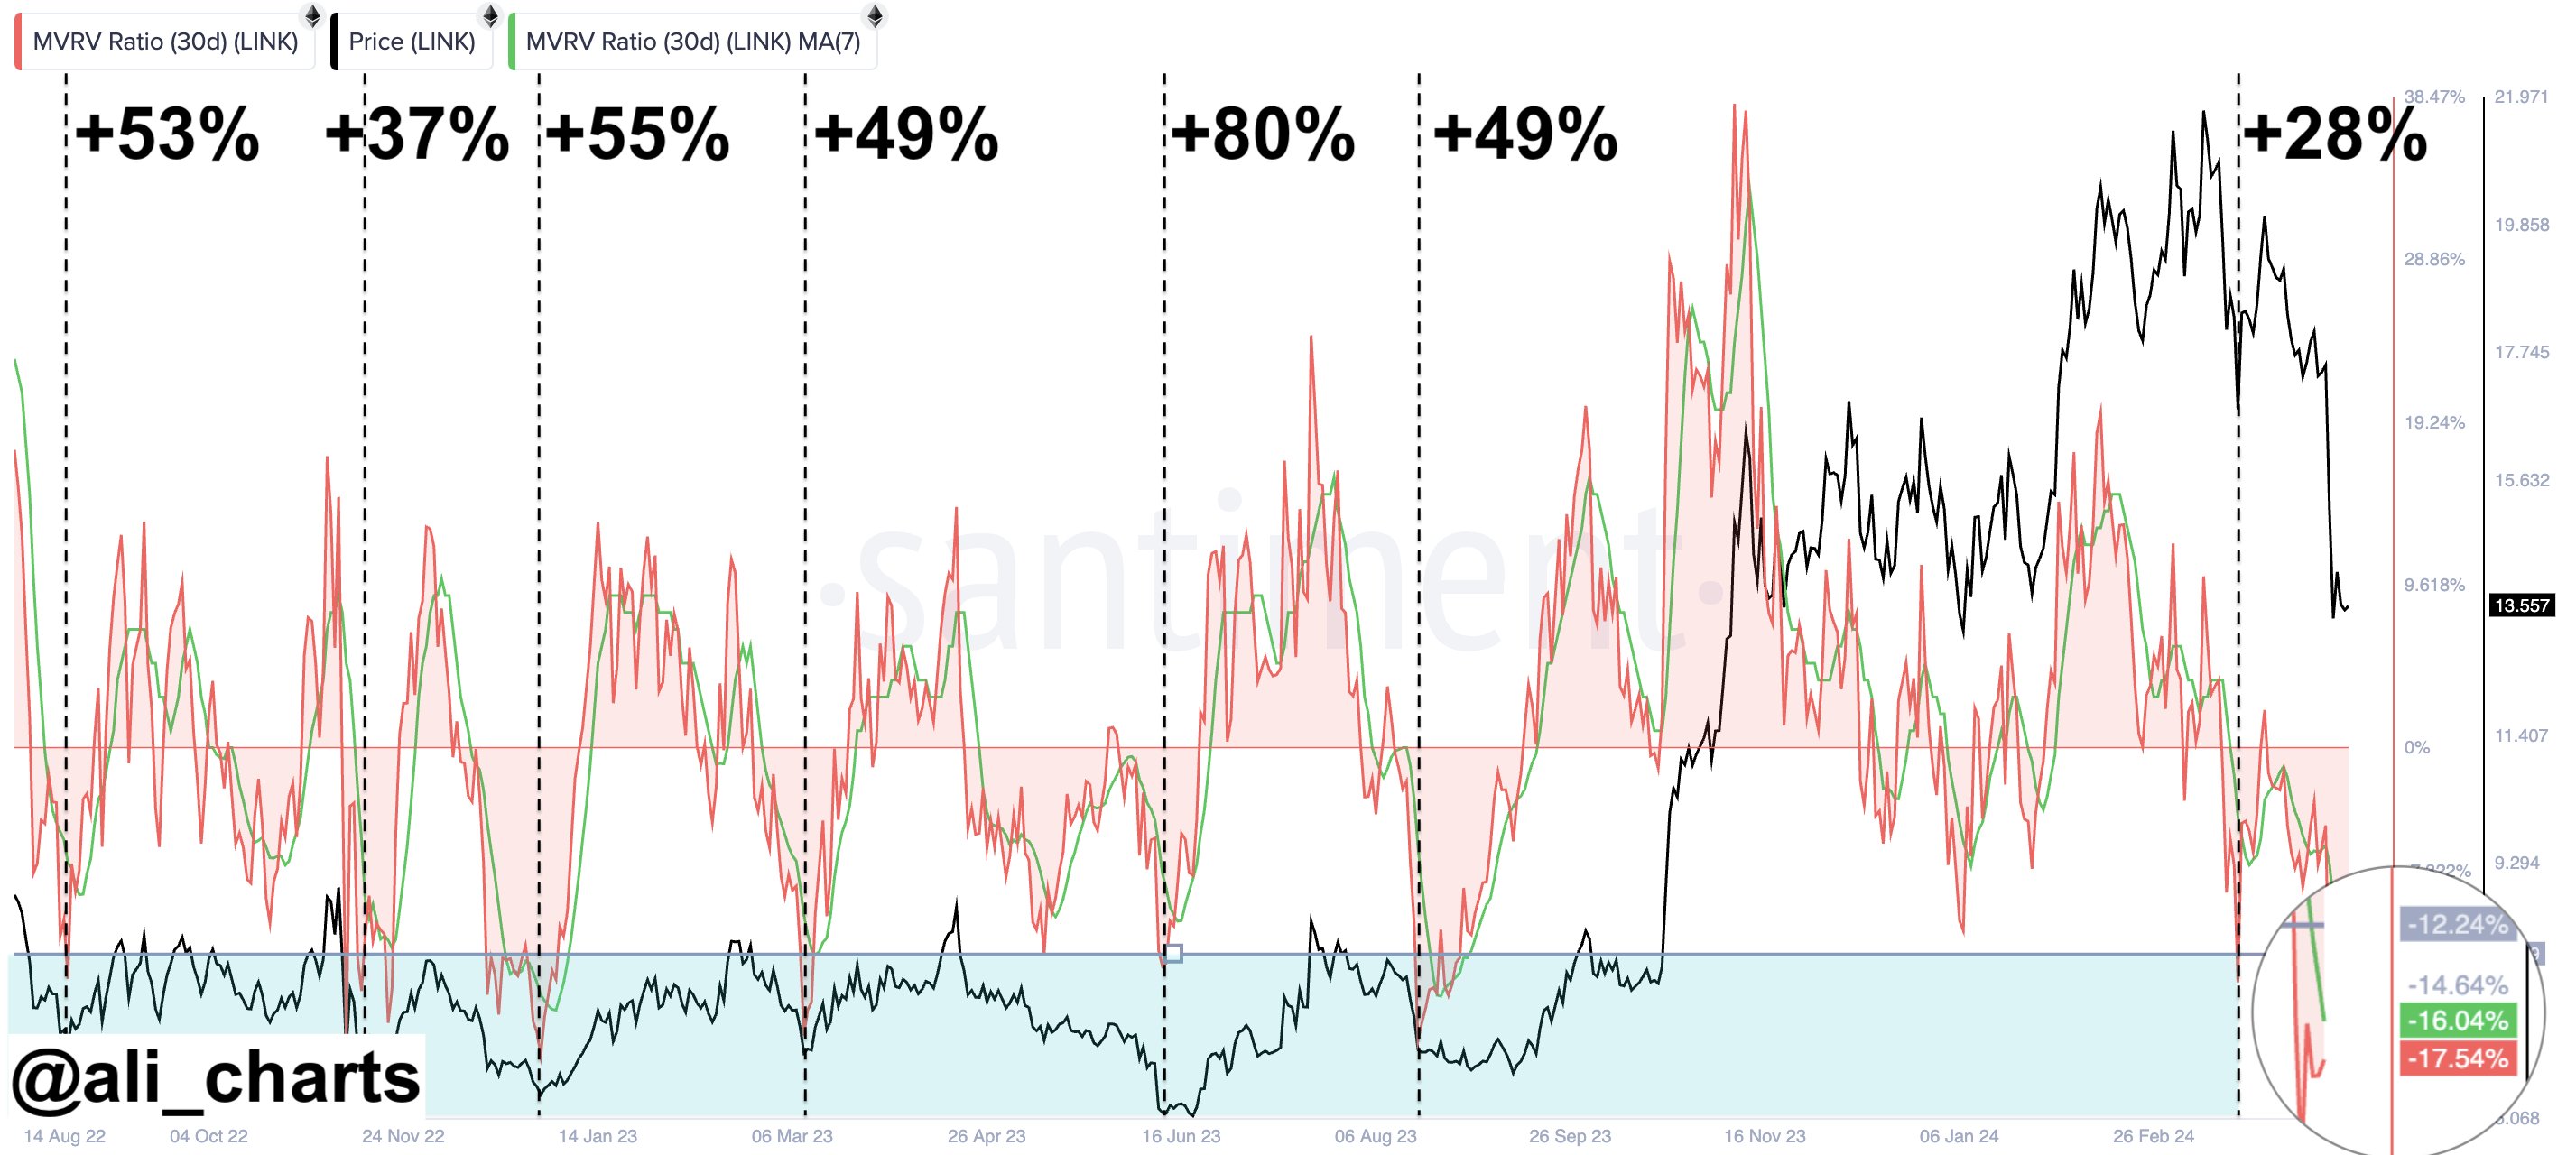
In the context of the current topic, the 30-day version of this indicator is of focus, which restricts itself to only the investors who bought within the past month. Here is the chart shared by the analyst that shows the trend in this LINK indicator over the past couple of years:

Chainlink MVRV Ratio

As displayed in the above graph, the Chainlink 30-day MVRV ratio has recently taken a sharp plunge and dipped under the 0% mark. The 0% mark is where the market cap and realized cap are exactly equal, so below it, the latter would be greater than the former.

When this is the case, the investors are carrying losses. This recent plunge into the negative has naturally come for the metric as the cryptocurrency’s price has plummeted, putting the 30-day buyers underwater.

In the chart, Ali has highlighted a specific pattern that Chainlink appears to have followed regarding this indicator, plunging deep into the negative territory. “Each time Chainlink MVRV 30-Day Ratio has dropped below -12.24% since August 2022, it’s signaled a prime buying opportunity, averaging 50% returns!” notes the analyst.

Recently, the indicator has declined towards 17.54%, meaning it’s below this level, which has historically led to profitable buying windows for the coin. It remains to be seen whether the pattern followed in the last two years will hold this time as well.

LINK Price

The past week has been terrible for Chainlink investors. The asset’s price has plunged by more than 23%, coming down to just $13.3 now.
Chainlink Price Chart

Dogecoin Trounced: Chainlink’s 34% Jump Kicks DOGE Out Of Top 10 List

After Chainlink’s impressive run of more than 34% over the past week, LINK has dethroned Dogecoin (DOGE) from the top 10 crypto by market cap list.

Chainlink Has Pulled Away From The Crowd With A Sharp Surge Recently

While most cryptocurrency sectors have observed minimal movement recently, Chainlink has emerged as an outlier, enjoying a surge of over 34% in the last week.

The below chart shows how LINK has performed over the past month.

Chainlink Price Chart

LINK had achieved a major milestone, breaking above the $18 level earlier during this latest rally, but with a sharp 8% continuation of the run, the coin has now surged beyond the $19.5 mark for the first time since early 2022.

Should Chainlink’s surge continue, the cryptocurrency would be retesting the $20 level, which could prove to be a source of major resistance, according to on-chain data.

LINK has surged more than 38% over the past thirty days, which means it has significantly outperformed the wider sector. Bitcoin, for instance, hasn’t even been able to put together positive returns in this period, as the original cryptocurrency’s price has declined by almost 2%.

Thanks to this strong rally, Chainlink has changed its standing among the wider sector. Specifically, the token has shaken things up in the market cap list.

Dogecoin Has Lost Its Position In The Top 10 List To LINK

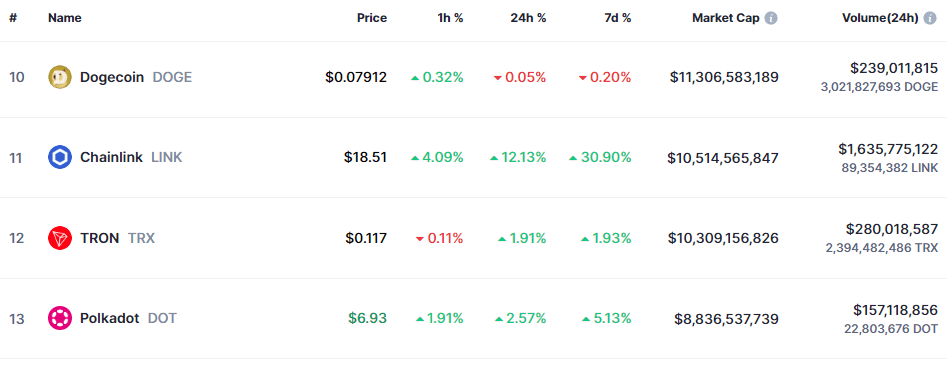
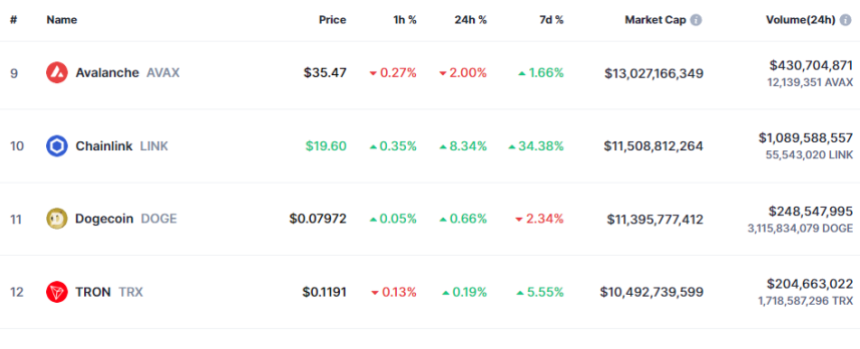
Following the rally, LINK has improved its market cap rank and is now the 10th largest cryptocurrency in the sector based on this metric. Dogecoin, holding this spot earlier, has now fallen to 11th.

The table below shows how the two assets fit in the broader sector.

Dogecoin Vs Chainlink

Although Chainlink has now surpassed Dogecoin in this metric, the gap between the two assets is still not much. This means the two coins may continue to flip each other in the coming days unless one shows diverging performance.

As LINK has arrived at this spot with a sharp surge, things may be looking favorably for the asset, especially considering that DOGE has rather put up negative returns in the past week.

The overall picture has also been a bit dire for the memecoin recently, as the chart below displays that its price has followed a sideways trajectory during the past month.

Dogecoin Price Chart

Unless things change fast for Dogecoin, its exit from the top 10 list may be here to stay. Of course, this only assumes that Chainlink itself doesn’t fall off shortly.

Chainlink Surges 12% To $18: Price Set To Retest $20 Next?

Chainlink has shot up over 12% to break $18 during the past day. A retest of the on-chain resistance wall at $20 could be next.

Chainlink Has Outperformed Market With Its 12% Rally

The past 24 hours have been green for most of the cryptocurrency sector, but the positive returns have been small for most of the market, with Bitcoin, the largest digital asset, only seeing profits of 1%.

Chainlink, however, has separated from the crowd during this period, rallying around 12%. The chart below shows how the coin has performed over the last few days.

Chainlink Price Chart

With this latest surge, Chainlink has surpassed the $18 level for the first time in almost two years. With profits of about 30% over the past week, LINK is by far the best-performing asset among the top 60 cryptocurrencies by market cap.

Speaking of the market cap list, LINK has now flipped Tron (TRX) to become the 11th largest asset in the sector following this recent strong performance. The table below shows where LINK stands among its peers in the sector right now.

Chainlink Market Cap

Dogecoin (DOGE) is the next coin above Chainlink now, and if the asset can continue its run, it should be able to flip the meme coin. While there is still some gap between their market caps, it isn’t too big.

Whether the coin can further this rally or not, perhaps on-chain data could provide some hints.

LINK Has Next Major On-Chain Resistance Wall Around $20

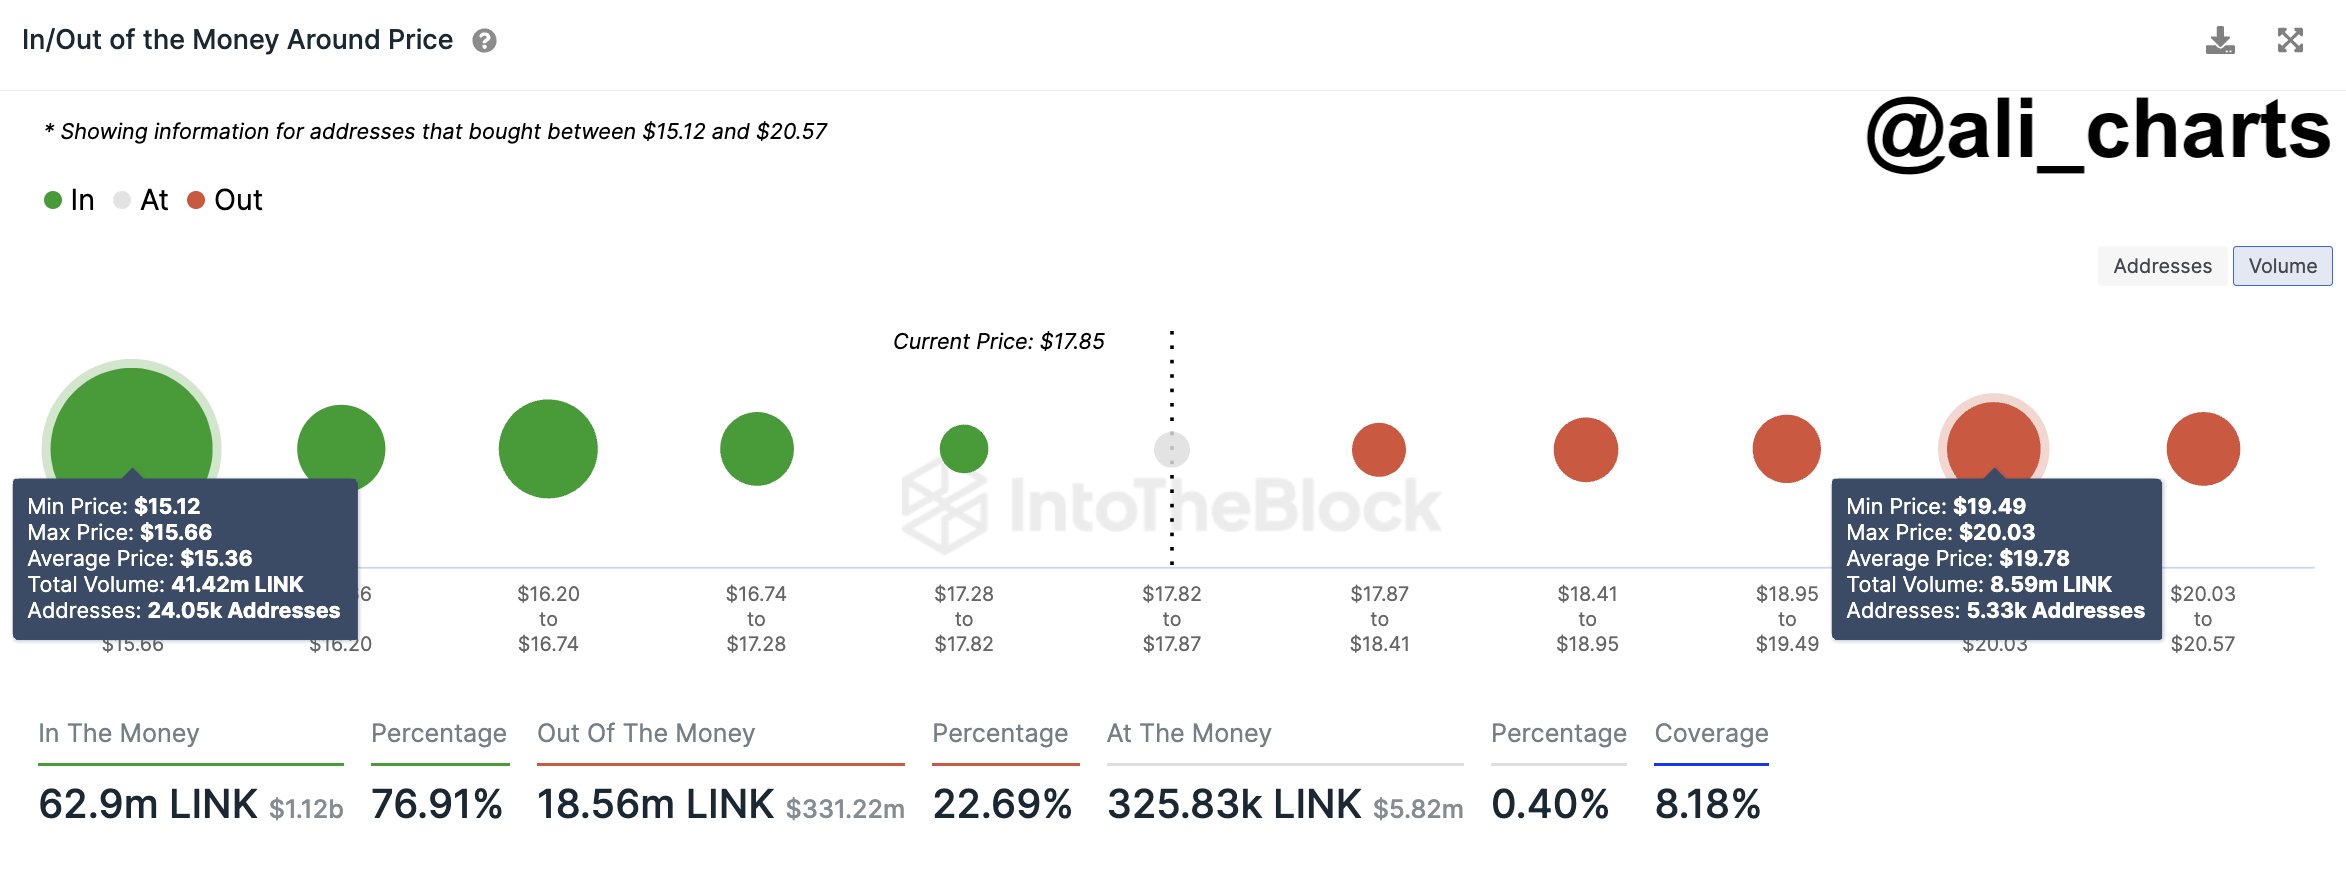
As explained by analyst Ali in a new post on X, LINK has significant on-chain resistance at $20. In on-chain analysis, the strength of a support/resistance level lies in the amount of BTC that the investors bought at it.

Below is a chart that shows the distribution of holder cost basis across the various LINK price ranges near the current price of the cryptocurrency.

Chainlink Resistance

When the analyst shared the chart, LINK was trading around $17.85, and the ranges until the $19.49 to $20.03 one weren’t too dense with investors. Chainlink has mowed through some of these weaker price levels since then, and the asset may continue to do so until it strikes the resistance wall around $20.

In total, 5,330 addresses bought 8.59 million LINK within this range. Generally, investors become more sensitive when the price retests their cost basis, so they may be prone to making some moves. For investors in loss like those inside this range, such a retest can mean an exit opportunity, as they might be desperate to get their money back.

This effect becomes more pronounced as investors share their cost basis inside the same range, so ranges with dense cost basis distribution can be a source of major resistance for the spot price.

Chainlink Becomes Long-Heavy As Price Clears $16: Top Here?

Chainlink has seen long contracts pile up on Binance during the past day, which may lead toward a top for the cryptocurrency.

Chainlink Funding Rate On Binance Has Turned Highly Positive

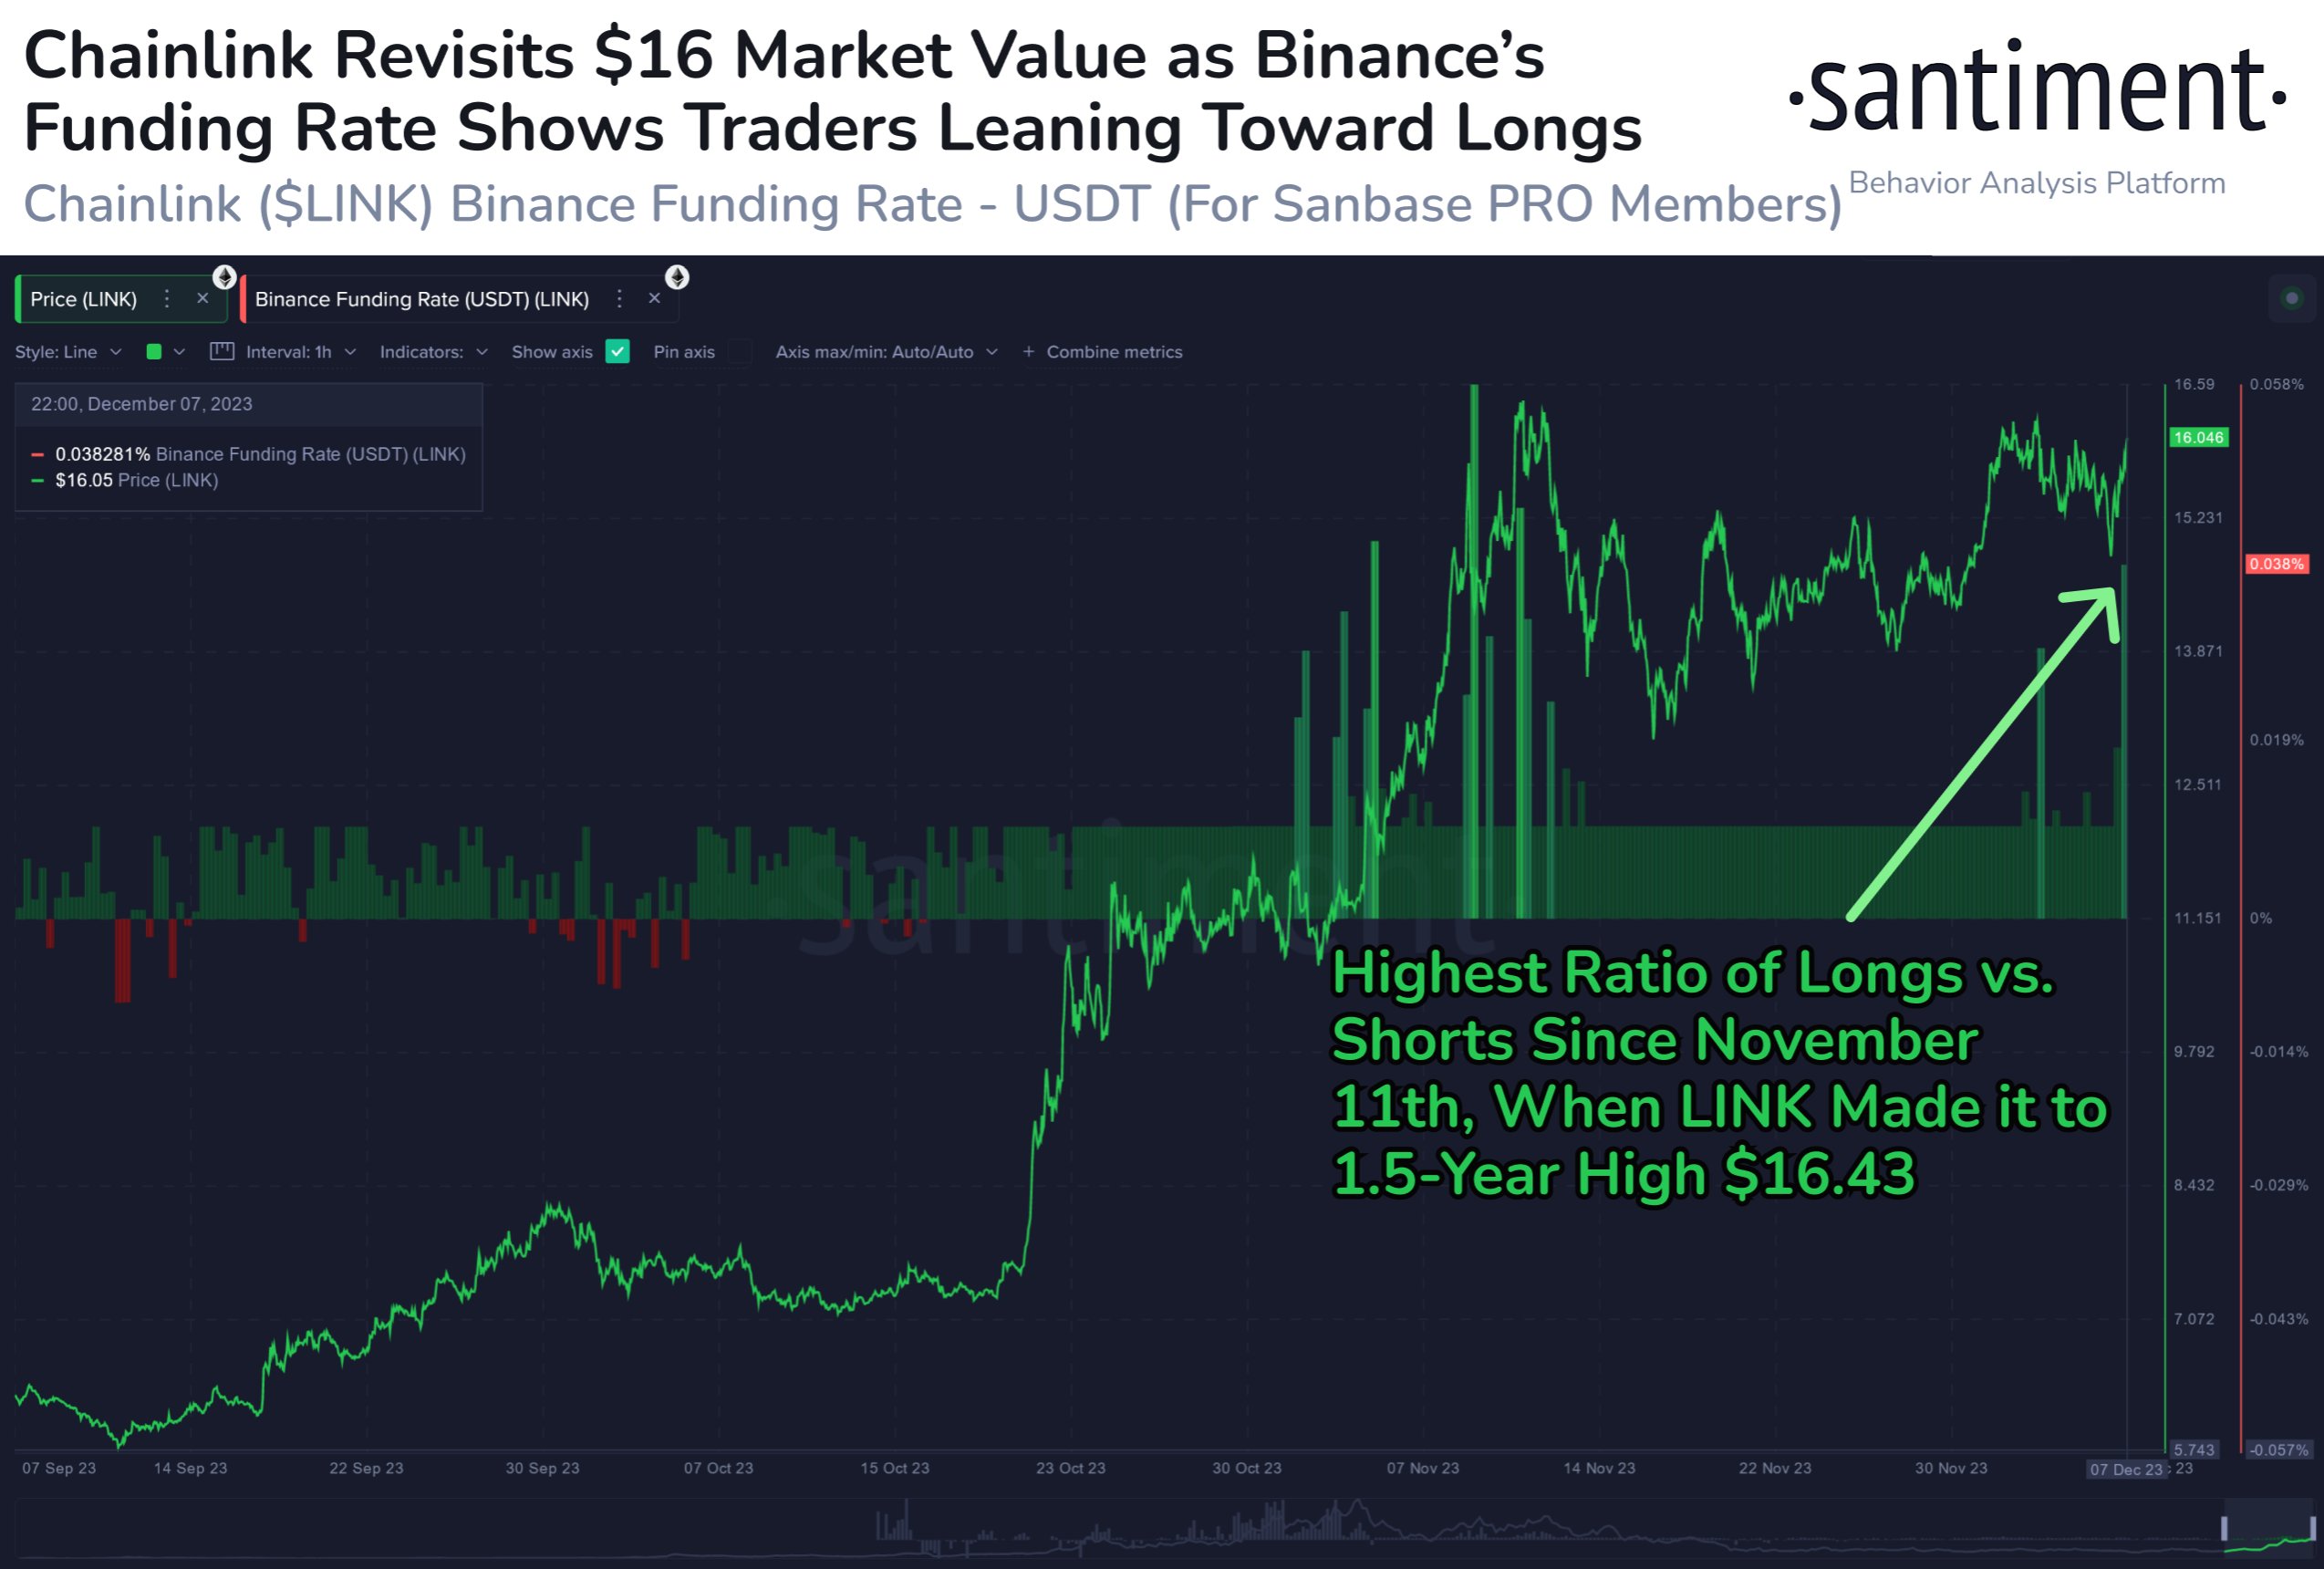
According to data from the on-chain analytics firm Santiment, the Chainlink funding rate on Binance has now reached the highest level in about four weeks. The “funding rate” refers to the periodic fee that derivative traders on any given platform are exchanging with each other right now.

When the value of this metric is positive, it means that the long holders are currently paying a fee to the short investors in order to hold onto their positions. Such a trend suggests a bullish mentality is dominant on the platform.

On the other hand, negative values imply a bearish sentiment is shared by most LINK traders on the exchange as the shorts outweigh the longs.

Now, here is a chart that shows the trend in the Chainlink funding rate on cryptocurrency exchange Binance over the last few months:

Chainlink Funding Rate

As displayed in the above graph, the Chainlink funding rate on Binance has assumed significantly positive values following the asset’s surge beyond the $16 mark.

Longs currently outweigh the shorts by the highest ratio since November 11th, when the cryptocurrency’s price set its then-yearly high, which the coin has now surpassed.

Historically, longs piling up on the derivatives market have often been negative for the price. This is because a mass liquidation event called a “squeeze” is usually more likely to affect the side with the most positions.

In a squeeze, a sudden swing in the price triggers a large amount of liquidations, which only feed into the swing further and end up leading to a cascade of more liquidations.

As the Chainlink funding rate is significantly positive, a long squeeze could be more likely to happen than a short squeeze. Last month, the asset hit its local top in these conditions, so the same might also repeat this time.

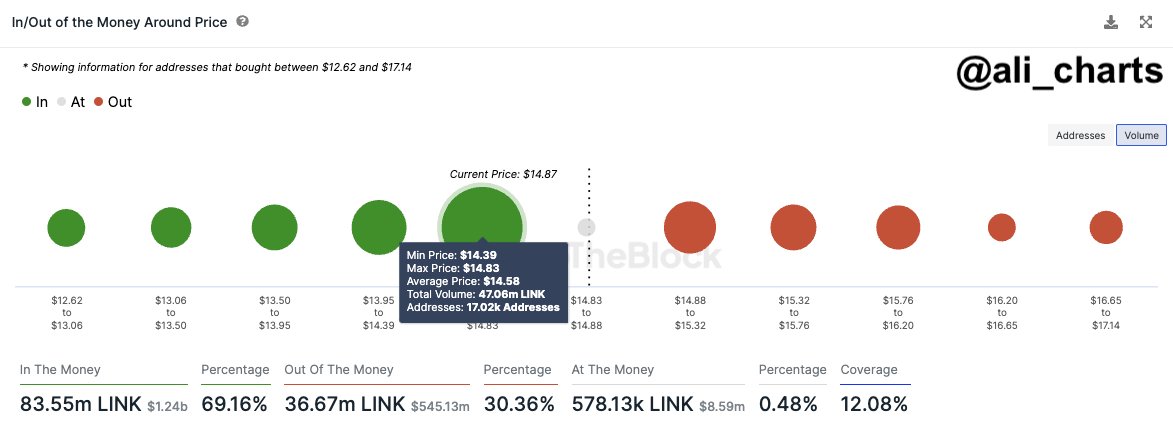
If LINK does observe a drawdown shortly, though, the decline may not be too extended. This is because there appears to be some strong on-chain support present between the $14.4 and $14.8, as analyst Ali pointed out in an X post yesterday.

Chainlink Price Chart

In on-chain analysis, levels are defined as resistance and support based on the total number of investors who acquired their coins at said levels. From the chart, it’s visible that 17,000 addresses have their cost basis inside the $14.4 to $14.8 range, which means it’s possibly a zone of strong support.

On the contrary, the levels above the current one are thin with investors, meaning that they shouldn’t pose too much resistance should the rally continue.

“As $LINK has regained the $16 threshold, watch if a bit of FOMO forms a local top, or if prices continue surging toward $20 with little resistance,” notes Santiment.

LINK Price

LINK had earlier broken past the $17 mark, but the asset has since seen some pullback as it’s now trading under the level once more.

Chainlink Price

Chainlink Signal Resurfaces: Is Another 31% Rally Coming?

On-chain data shows that a Chainlink signal that last preceded a 31% rally for the asset’s price has just reversed.

Chainlink Age Consumed Metric Has Observed A Sharp Spike Recently

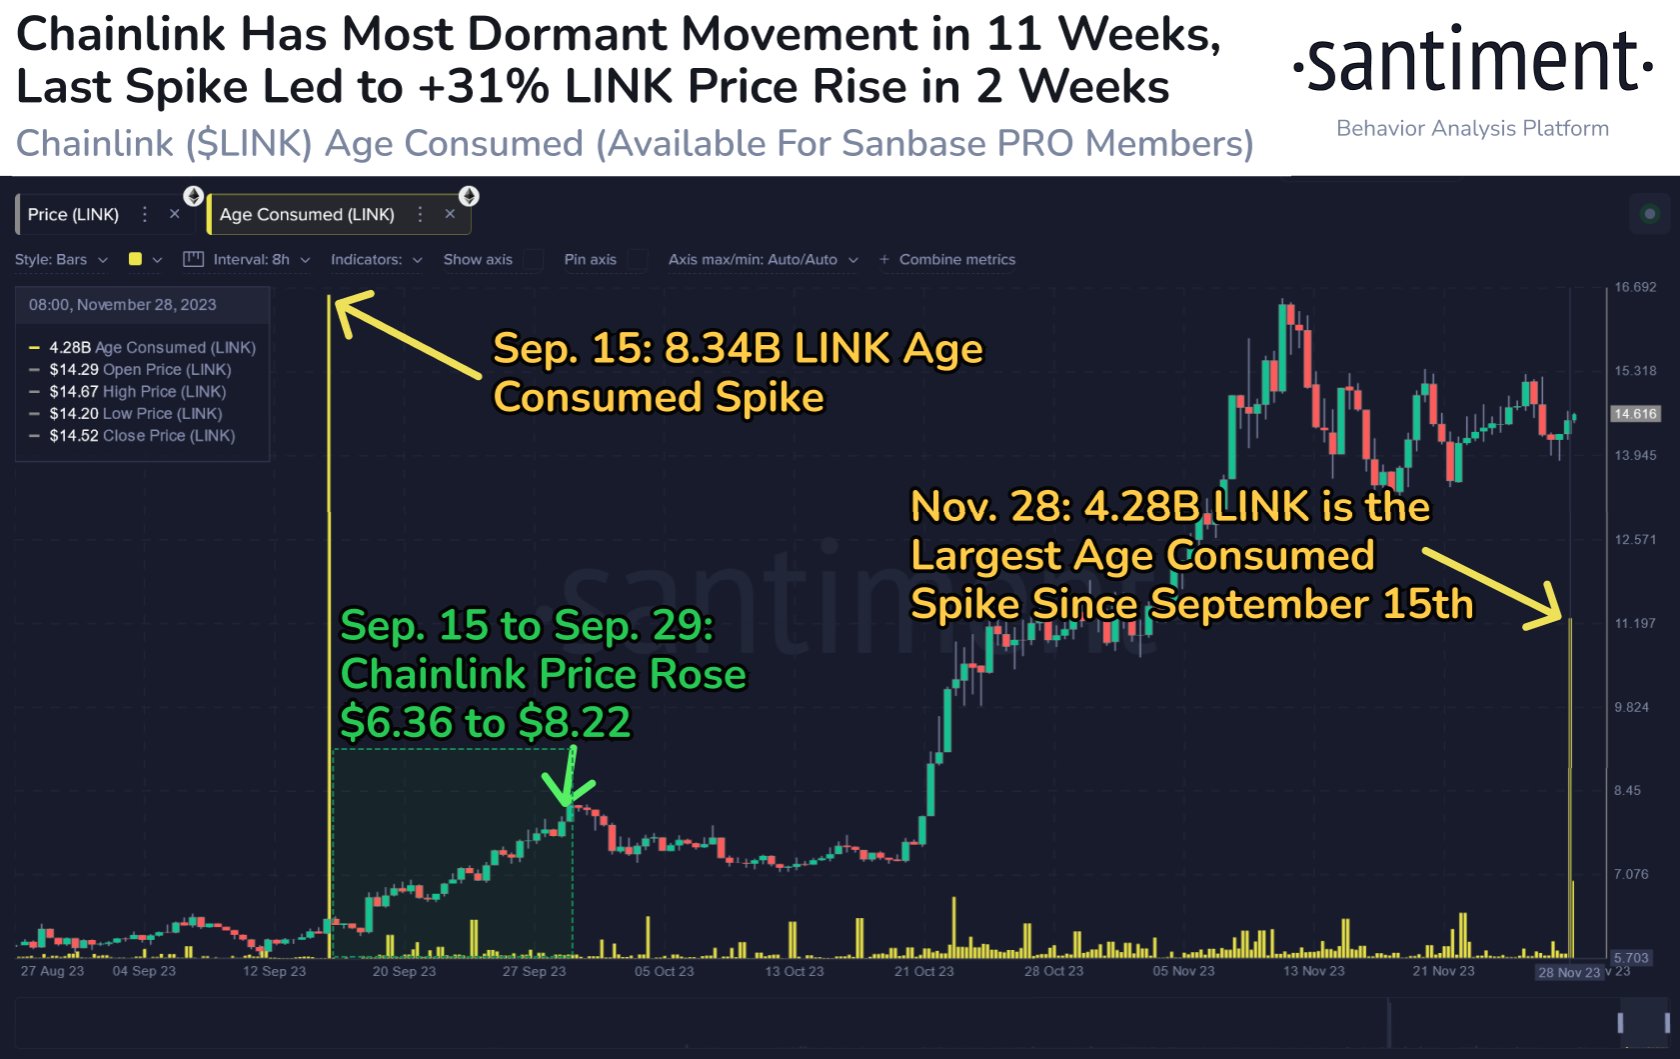
According to data from the on-chain analytics firm Santiment, LINK has recently seen a significant movement from old coins. The relevant indicator here is the “Age Consumed,” which tells us whether the dormant Chainlink tokens are on the move or not right now.

When the indicator’s value registers a large spike, it’s a sign that the blockchain is currently observing the transfer of a significant number of old coins. Such dormant tokens belong to a cohort called the “long-term holders” (LTHs), made up of the relentless hands of the sector.

As such, this metric surging can be something to watch out for, as it means that these LTHs, who usually remain quiet no matter what’s going on in the wider market, have decided to break their dormancy.

Now, here is a chart that shows the trend in the Chainlink Age Consumed over the last few months:

Chainlink Age Consumed

As displayed in the above graph, the Chainlink Age Consumed indicator has observed a sharp rise recently, implying that the LTHs have been making transactions.

At the peak of this latest spike, the metric’s value touched 4.28 billion, which is the highest level seen since the middle of September. Back then, the indicator registered a spike almost double in scale, and interestingly, what followed in the next couple of weeks was a 31% rally as LINK went from $6.36 to $8.22.

It’s hard to say if a similar pattern would repeat for Chainlink this time since the LTHs could have broken their silence for several reasons, including for selling.

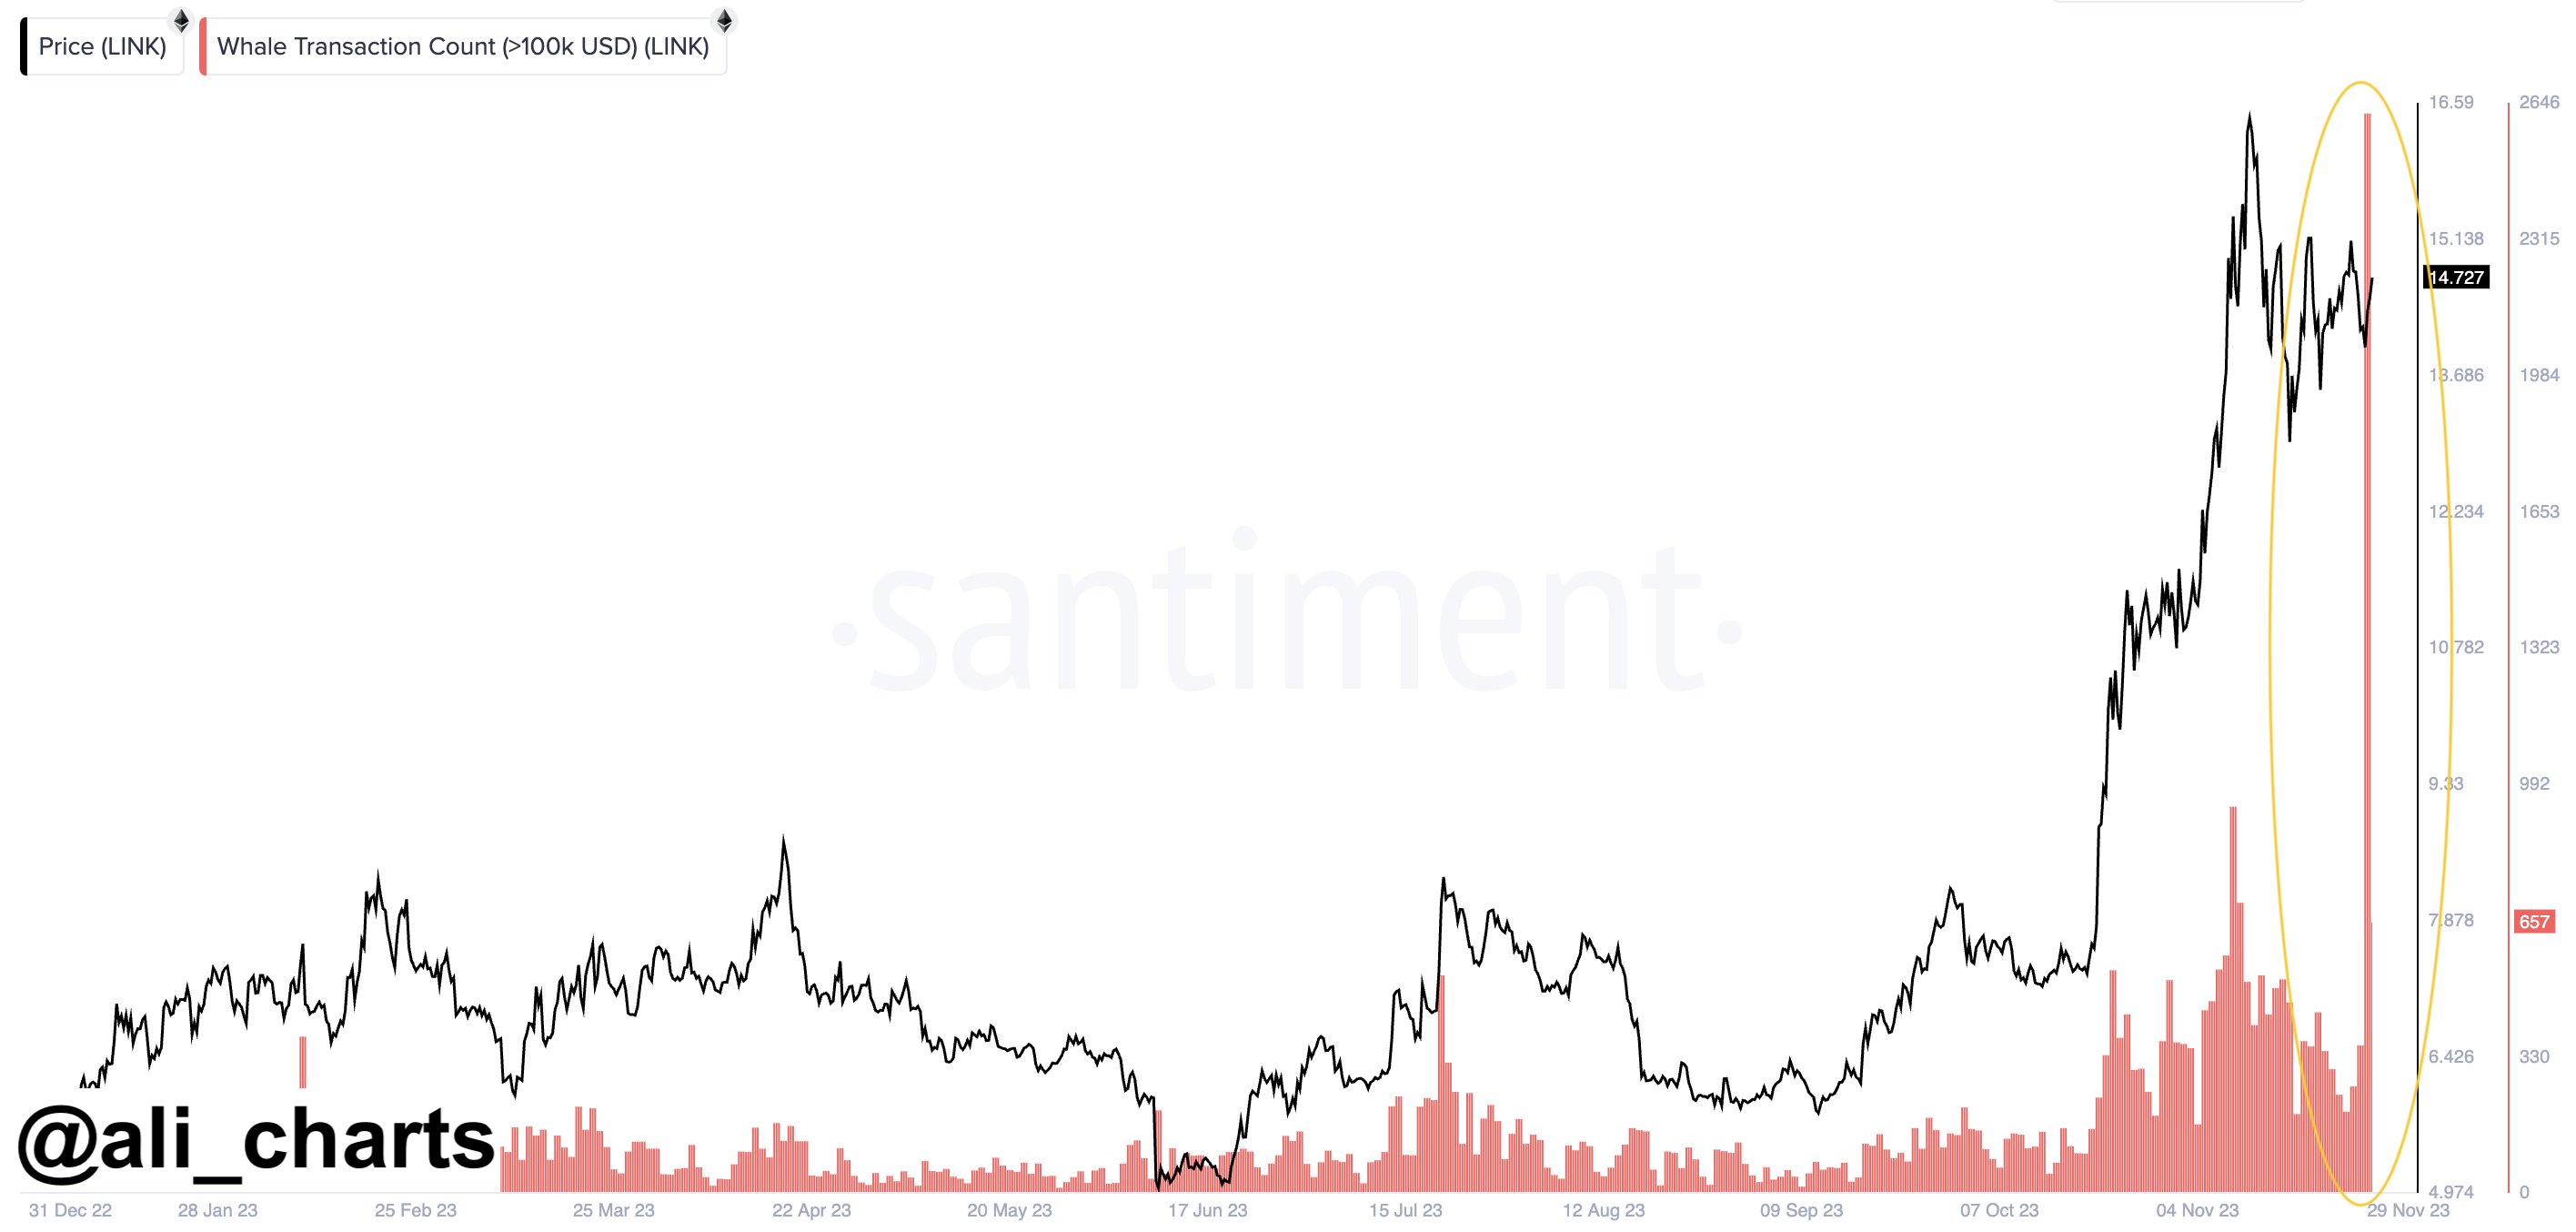
An analyst has pointed out that yesterday (which was about the same time as this spike in the Age Consumed), the whales made many transactions, as the chart below shows.

Chainlink Whale Transactions

In total, the Chainlink network observed 2,600 transactions valued over $100,000 yesterday. The spike would confirm that the LTHs who broke their dormancy weren’t just ordinary investors but the whales.

In isolation, it’s hard to say why these two indicators recently observed a spike. Still, when looking at the latest LINK news, perhaps the most likely explanation becomes apparent.

Yesterday, Chainlink staking v0.2 went live on the Ethereum blockchain, allowing the v0.1 stakers to migrate toward the new network. Thus, given the close timing of the spikes in the Age Consumed and Whale Transaction Count, it would appear quite probable that these LTHs were making transfers toward the new staking pools.

LINK Price

Chainlink had observed some drawdown towards the $13.7 mark just recently, but it would seem like the asset has already recovered as it’s now trading around $14.7.

Chainlink Price Chart

Chainlink Retests $14: Here’s What Will Happen If Support Holds

Chainlink has registered some drawdown and has recently retested the $14 level. Here’s what might happen if support holds at this mark.

On-Chain Data Suggests Resistance Is Thin At Higher Chainlink Levels

As pointed out by analyst Ali in a new post on X, Chainlink is currently in a critical on-chain demand zone. In on-chain analysis, a price range is defined as major support or resistance based on the number of investors or addresses that bought their coins inside the said range.

To any holder, their cost basis is naturally fundamental, as their profit/loss situation can flip whenever the cryptocurrency retests it. For this reason, an investor becomes more likely to show a move whenever such a retest takes place.

If the holder had earlier been holding a loss, but the price has now risen and reached its equilibrium point, they might lean towards selling. This is because they might fear their holdings would go into loss again shortly, so exiting at break-even wouldn’t sound like a bad idea.

The opposite can be true when the retest occurs from above: the investor might be willing to buy more, thinking that if this same cost basis proved profitable earlier, it would do so again soon.

A single investor making such buy or sell moves is insignificant for the rest of the market, but if many investors share the same cost basis, the asset could feel a sizeable reaction when the price retests the level.

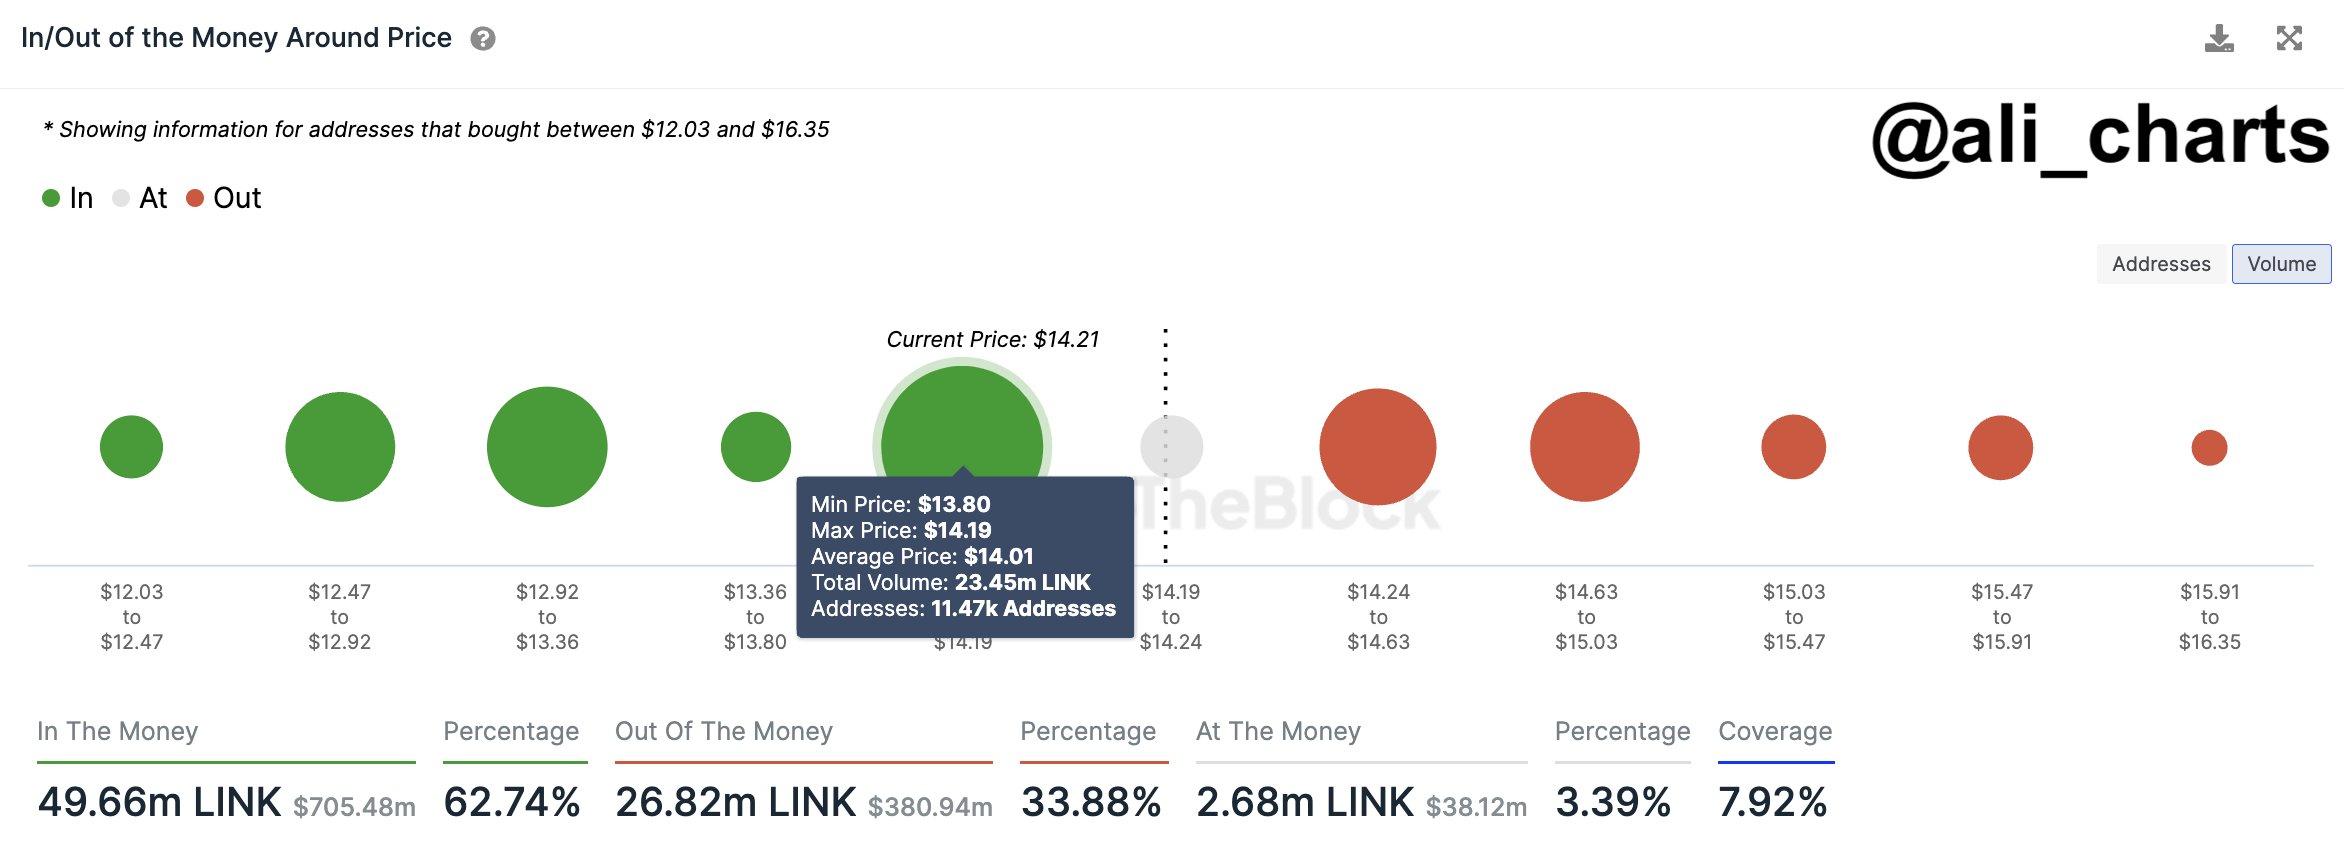
Now, here is a chart that shows how the Chainlink ranges around the current price look in terms of the density of investors who bought inside them:

Chainlink Cost Basis

As displayed in the above graph, the Chainlink levels from $13.8 to $14.2 host the cost basis of about 11,470 addresses, which acquired 23.45 million LINK inside this range.

This range is notably thicker than any other range immediately below or above the asset’s current price. LINK has been floating around this range recently, meaning it has been retesting this major support zone.

From the chart, it’s apparent that the ranges above don’t contain that many investors, so in theory, a move toward the higher levels shouldn’t be too hard for the asset.

However, the trouble would be if this support area is lost and LINK slips under it for an extended duration. This dense zone will turn into a resistance wall if this happens, making it hard for the cryptocurrency to recover above it.

Ali notes, though, that if Chainlink can remain above this zone, the price could climb towards new highs for the year 2023.

LINK Price

Chainlink had slipped below this range just earlier, but the asset was quick to recover above it, implying that it’s still holding up as support.

Chainlink Price Chart

Chainlink Declines 6%: Rally Over Or Is There More To Go?

The Chainlink rally has slowed down recently; here’s what the various LINK on-chain metrics look like to see if the surge has hope of a restart.

Chainlink Has Registered Some Drawdown In The Past 24 Hours

Just during the weekend, Chainlink had been floating above the $16 mark, but winds seem to have shifted for the coin in the past couple of days, as it has registered some drawdown.

During the last 24 hours alone, LINK has dropped around 6%, leading to its price slipping below the $14 level. The chart below shows how the cryptocurrency has performed in the past month.

Chainlink Price Chart

As displayed above, Chainlink had been riding some sharp bullish momentum in this period before this latest plunge, as the asset had more than doubled in value. Despite the decline, LINK is still up over 90% in the past month, which is an impressive return.

Naturally, the investors may be wondering now if the asset has already hit its peak for this rally or if there is more to come shortly. It’s hard to say anything about that, but perhaps on-chain data could provide some hints.

LINK Activity Has Been Relatively High Recently

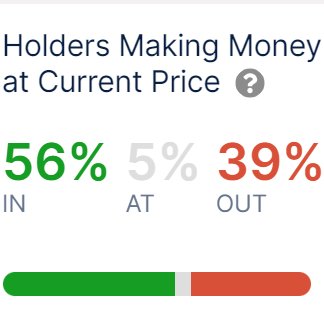
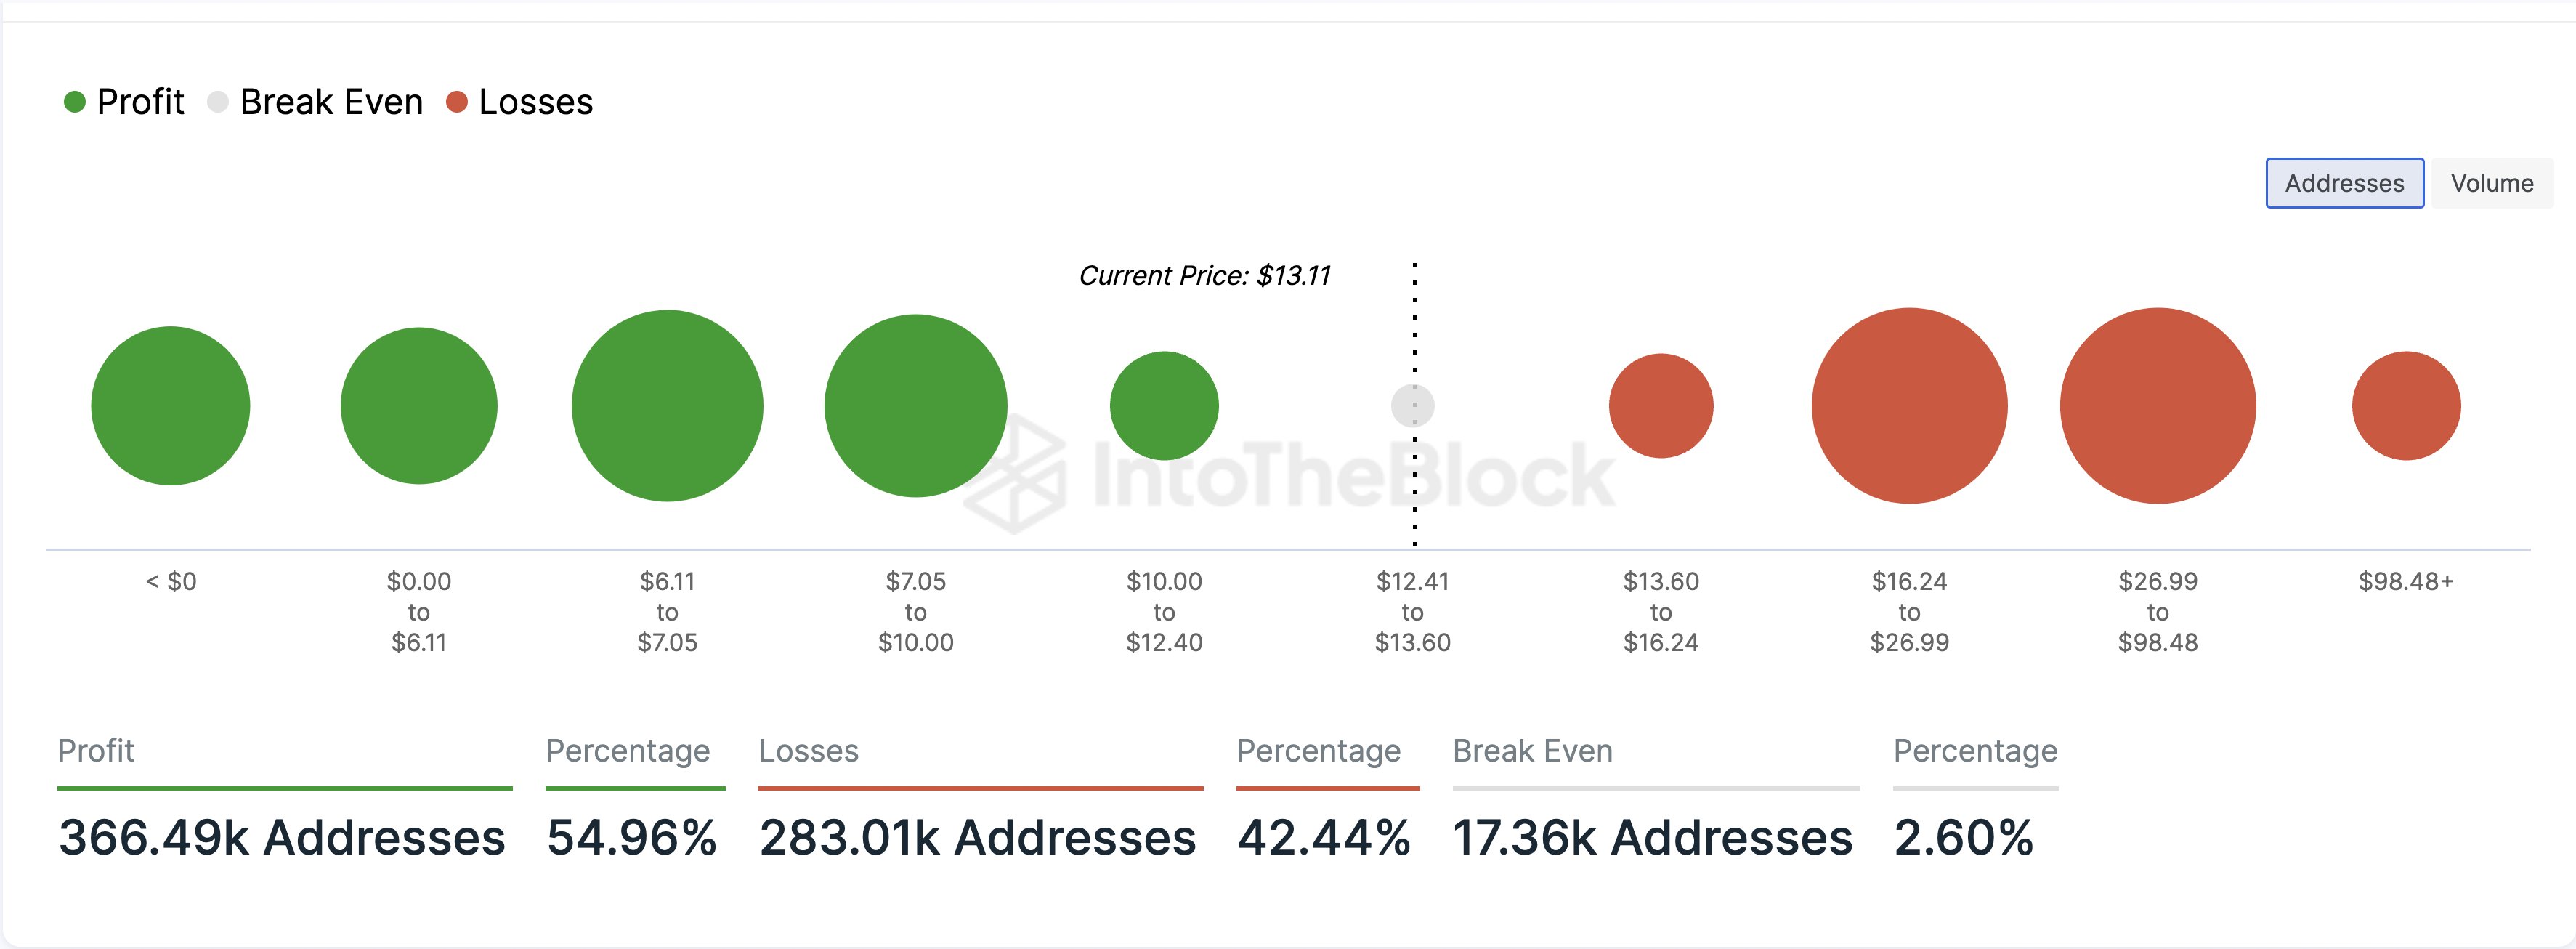
In a new post on X, the market intelligence platform IntoTheBlock has shared the data of some Chainlink on-chain indicators. First, when the firm made the post, about 56% of the asset’s investors were sitting on some profit.

Chainlink Profit

The cryptocurrency had then been floating at higher levels than currently (although not too high), so more LINK addresses would have entered a state of loss by now.

Generally, investors in profit are more likely to sell at any point, so a large amount of them being in the green could raise the probability of a selloff. Some Chainlink investors are currently harvesting their profits, but the profitability ratio is still not skewed that much towards profits.

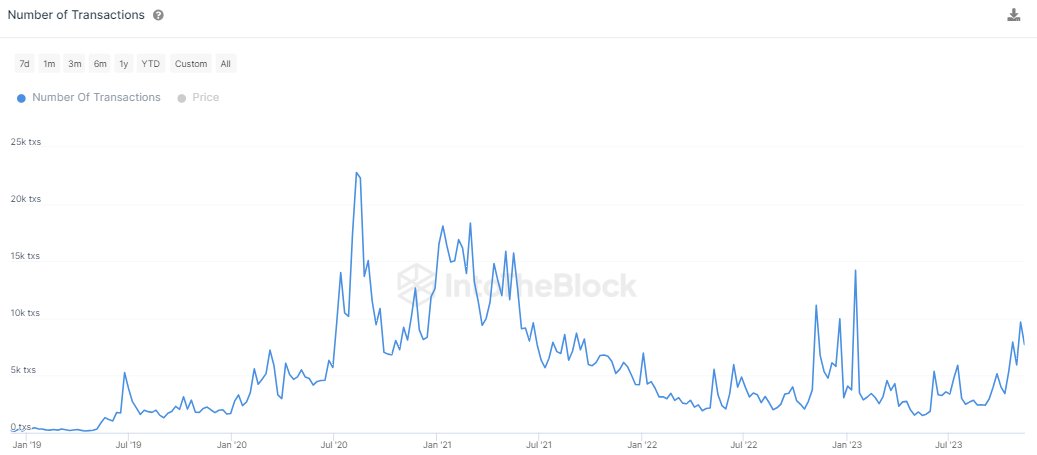
Next, IntoTheBlock has talked about the number of transactions on the network.

Chainlink Transactions

“The Chainlink network is showing many positive signs in terms of transaction data,” says the intelligence platform. “Notably, we see a healthy increase in the number of transactions.”

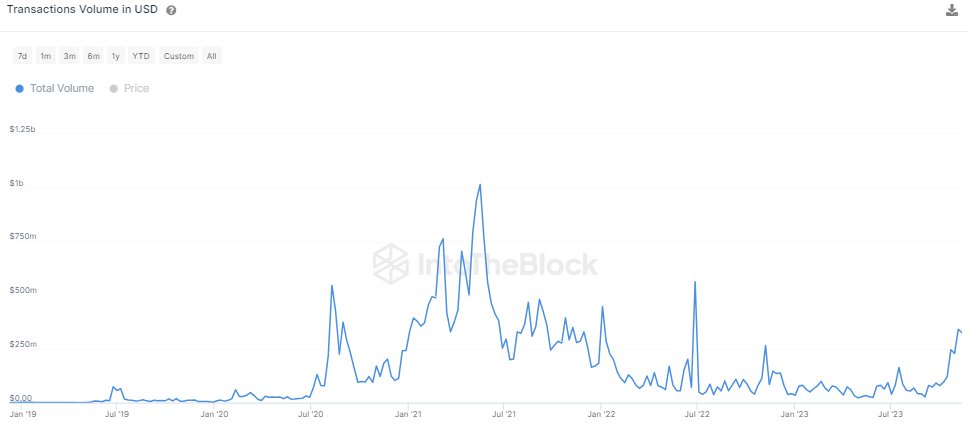
The number of transactions is up 436% from the monthly lows, and as is usually the case, the volume has also spiked alongside this rise.

Chainlink Volume

The transaction activity being high suggests there is interest behind the asset, and so, the price action shouldn’t go stale just yet. However, the volatility due to this activity can go either way, as the asset is already witnessing.

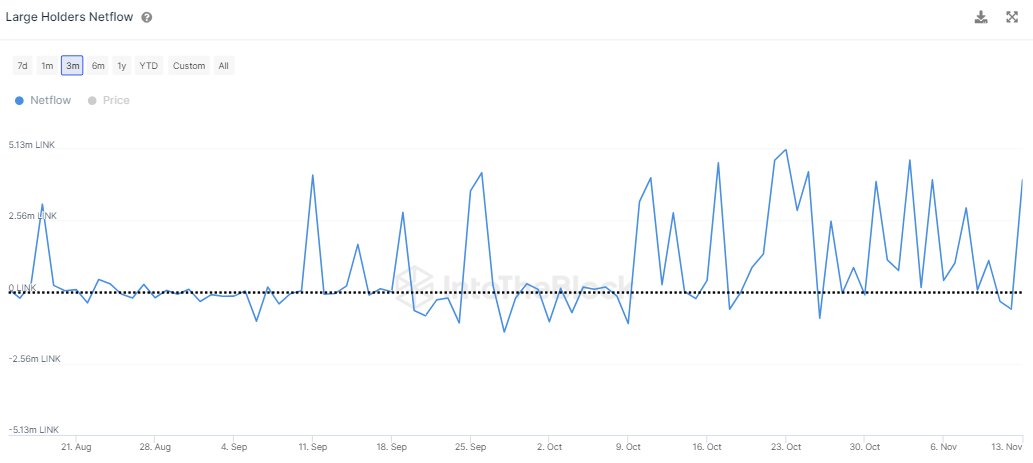
A metric that could more solidly point at a direction for the cryptocurrency is the large holder netflow, which keeps track of the net accumulation/distribution behavior over the last month for LINK holders carrying more than 1% of the supply.

Chainlink Whale Netflow

As is visible in the chart, the large Chainlink holders have been buying recently, which could potentially be a positive sign for the asset. This doesn’t have to mean that the rally would restart shortly, of course, but it does provide some support for the idea.

Chainlink Has Massive Resistance Ahead, Will The Rally End Soon?

On-chain data shows there is major resistance ahead for Chainlink, a sign that could be troubling for the rally’s sustainability.

Only 55% Of Chainlink Investors Are In Profit So Far

As explained by an analyst in a post on X, Chainlink is still behind Bitcoin in terms of investor profitability despite the LINK price outperforming BTC in the year so far.

The below chart shows what the LINK address concentration looks like on the different price ranges that the asset has previously visited:

Chainlink Cost Basis

Here, the size of the dot represents the number of investors or addresses who purchased their coins inside the particular price range. It would appear that the ranges below $10 are host to the cost basis of a hefty number of holders.

Since the LINK price is above these levels right now, these investors would naturally be in a state of profit. These addresses only make for about 55% of the network total, however, implying that a significant number of them are still sitting at a loss. From the chart, it’s visible that the $16 to $27 range in particular has a considerable density of investors.

In on-chain analysis, major support and resistance levels are defined on the basis of the number of investors that are at a particular range. This is because of the fact that whenever the spot price interacts with the cost basis of an investor, they become more likely to show a move.

When the price retests the cost basis from above, the holder may decide to buy more. The reason behind this is that they might tend to believe that the level, which had been profitable for them earlier, might produce gains in the future again, so it would appear like an ideal point of accumulation for them.

On the other hand, the red holders might see the break-even point as a decent exit point, as they might fear that the cryptocurrency would go back down in the near future, so going out here at least means they can avoid taking any losses.

Such buying or selling from just a few investors when the price retests their common cost basis doesn’t produce any effects on the macro scale, but if a large number of investors bought at the same level, the reaction might be more pronounced.

Thus, the Chainlink levels ahead until the $27 mark might prove to be a source of some heavy resistance, making the rally hard to sustain through them.

The analyst notes, however, “once LINK breaks the $27 mark, the ensuing rally is expected to be substantial. Alongside this, the wallet profitability ratio is projected to surpass 80%.”

As mentioned before, Bitcoin’s investor profitability distribution is looking much better so far, as the below chart from IntoTheBlock shows:

Bitcoin Cost Basis

Bitcoin is currently battling against the resistance offered by the current investor-packed $34,100 to $35,100 range. Once BTC is through these levels, however, the road towards $40,000 might prove to be relatively easy.

LINK Price

Following its 12% rally in the past week, Chainlink is now sitting just below the $12.9 mark.Chainlink Price Chart

Chainlink Whales Moved Around $150M In LINK Before Latest Surge: Data

On-chain data shows the Chainlink whales showed some high activity right before the latest surge in the cryptocurrency took place.

Chainlink Whales Made Moves Before LINK’s 3% Surge

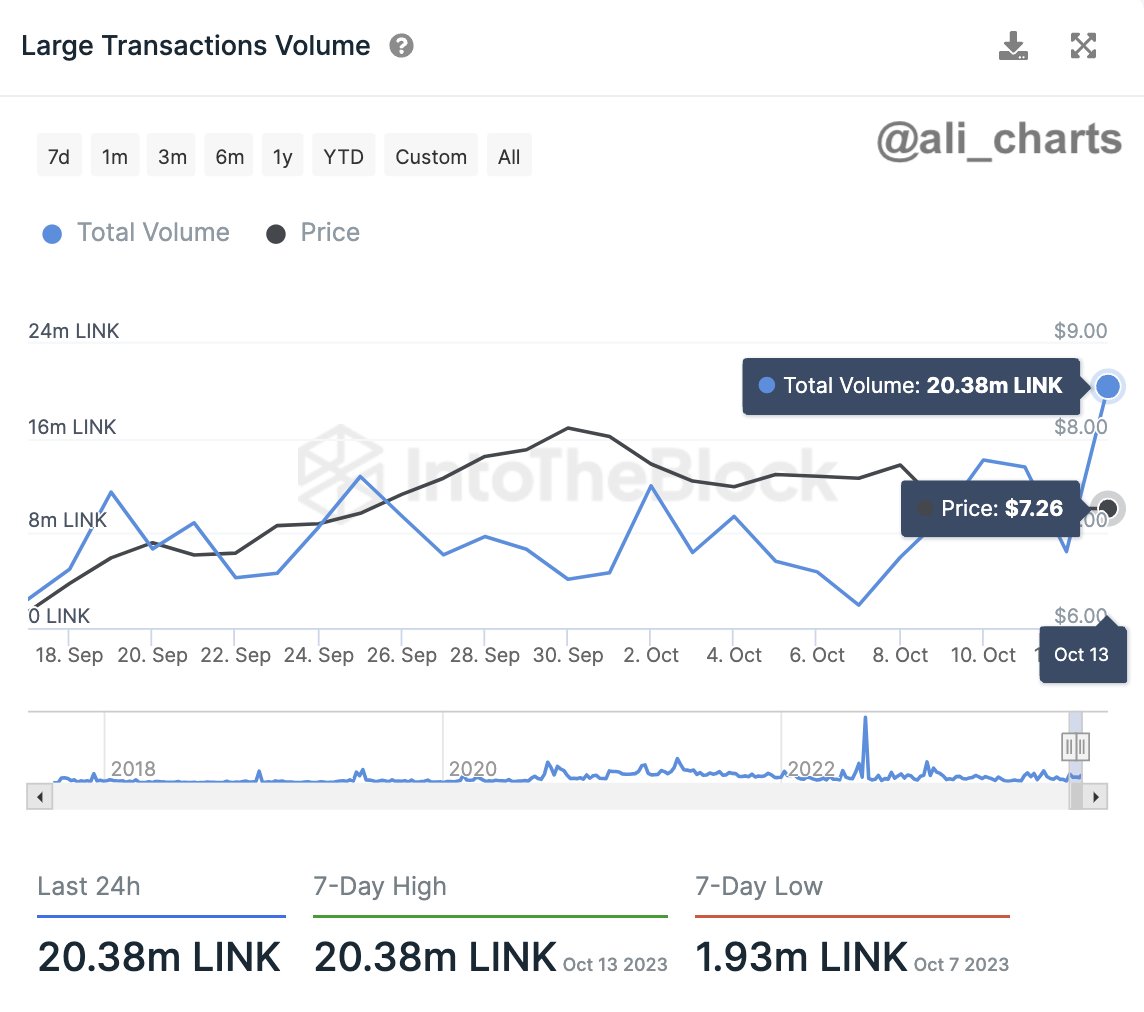
As pointed out by an analyst in a post on X, whales and institutional investors have shown an increasing amount of activity recently. The relevant indicator is the “large transactions volume” from the market intelligence platform IntoTheBlock, which keeps track of the aggregate volume of Chainlink transactions larger than $100,000.

Generally, the whales and institutional entities are the only investors capable of shifting such a large amount with a single transaction. These holders carry large balances in their wallets, making them influential on the network.

When the value of this metric is high, it means that these humongous investors are moving around large amounts right now. Such a trend implies that these investors are participating in some trading activity.

However, this metric alone can’t discern exactly what kind of activity it is, as both selling and buying transactions appear the same on the blockchain and count towards this volume.

On the other hand, when the indicator has low values, it suggests that the whales and institutional players aren’t interested in the cryptocurrency as they aren’t making too many moves. Now, here is a chart that shows the trend in the Chainlink large transaction volume over the past few weeks:

Chainlink Large Transactions Volume

As displayed in the above graph, the Chainlink large transactions volume registered a spike recently, implying that the whales had been moving many tokens across the network.

At the peak of this spike, the whales transferred around 20.38 million LINK within 24 hours. This stack would be worth over USD 150 million at the current exchange rate.

It’s uncertain why these humongous holders suddenly showed so much activity, but perhaps the surrounding price action could hint at it. This spike was seen a few days back, and since then, Chainlink has observed some net uptrend.

Thus, the timing of the transactions could suggest two likely possibilities. These large investors bought in anticipation of this rally (perhaps due to some inside information), or their buying is why the price surge found its appropriate fuel in the first place.

Either way, it’s a positive sign that the whales and institutional investors have recently participated in potential accumulation activity. In the coming days, this metric can be the one to keep an eye on, as further activity from these holders could signal that more volatile price action may be ahead.

Once again, though, any future spikes could arise from both buying and selling, so they won’t necessarily be a bullish signal for Chainlink like this latest one turned out to be.

LINK Price

At the time of writing, Chainlink is trading around $0.74, up more than 3% in the past week.

Chainlink Price Chart