Chainlink Surges 12% To $18: Price Set To Retest $20 Next?

Chainlink has shot up over 12% to break $18 during the past day. A retest of the on-chain resistance wall at $20 could be next.

Chainlink Has Outperformed Market With Its 12% Rally

The past 24 hours have been green for most of the cryptocurrency sector, but the positive returns have been small for most of the market, with Bitcoin, the largest digital asset, only seeing profits of 1%.

Chainlink, however, has separated from the crowd during this period, rallying around 12%. The chart below shows how the coin has performed over the last few days.

Chainlink Price Chart

With this latest surge, Chainlink has surpassed the $18 level for the first time in almost two years. With profits of about 30% over the past week, LINK is by far the best-performing asset among the top 60 cryptocurrencies by market cap.

Speaking of the market cap list, LINK has now flipped Tron (TRX) to become the 11th largest asset in the sector following this recent strong performance. The table below shows where LINK stands among its peers in the sector right now.

Chainlink Market Cap

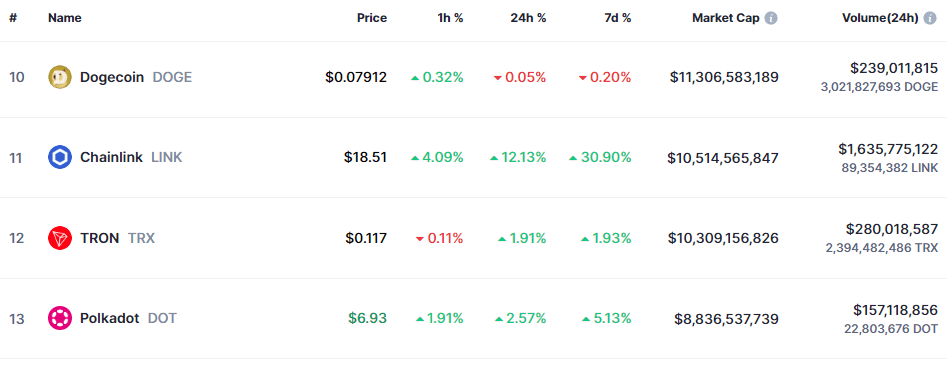
Dogecoin (DOGE) is the next coin above Chainlink now, and if the asset can continue its run, it should be able to flip the meme coin. While there is still some gap between their market caps, it isn’t too big.

Whether the coin can further this rally or not, perhaps on-chain data could provide some hints.

LINK Has Next Major On-Chain Resistance Wall Around $20

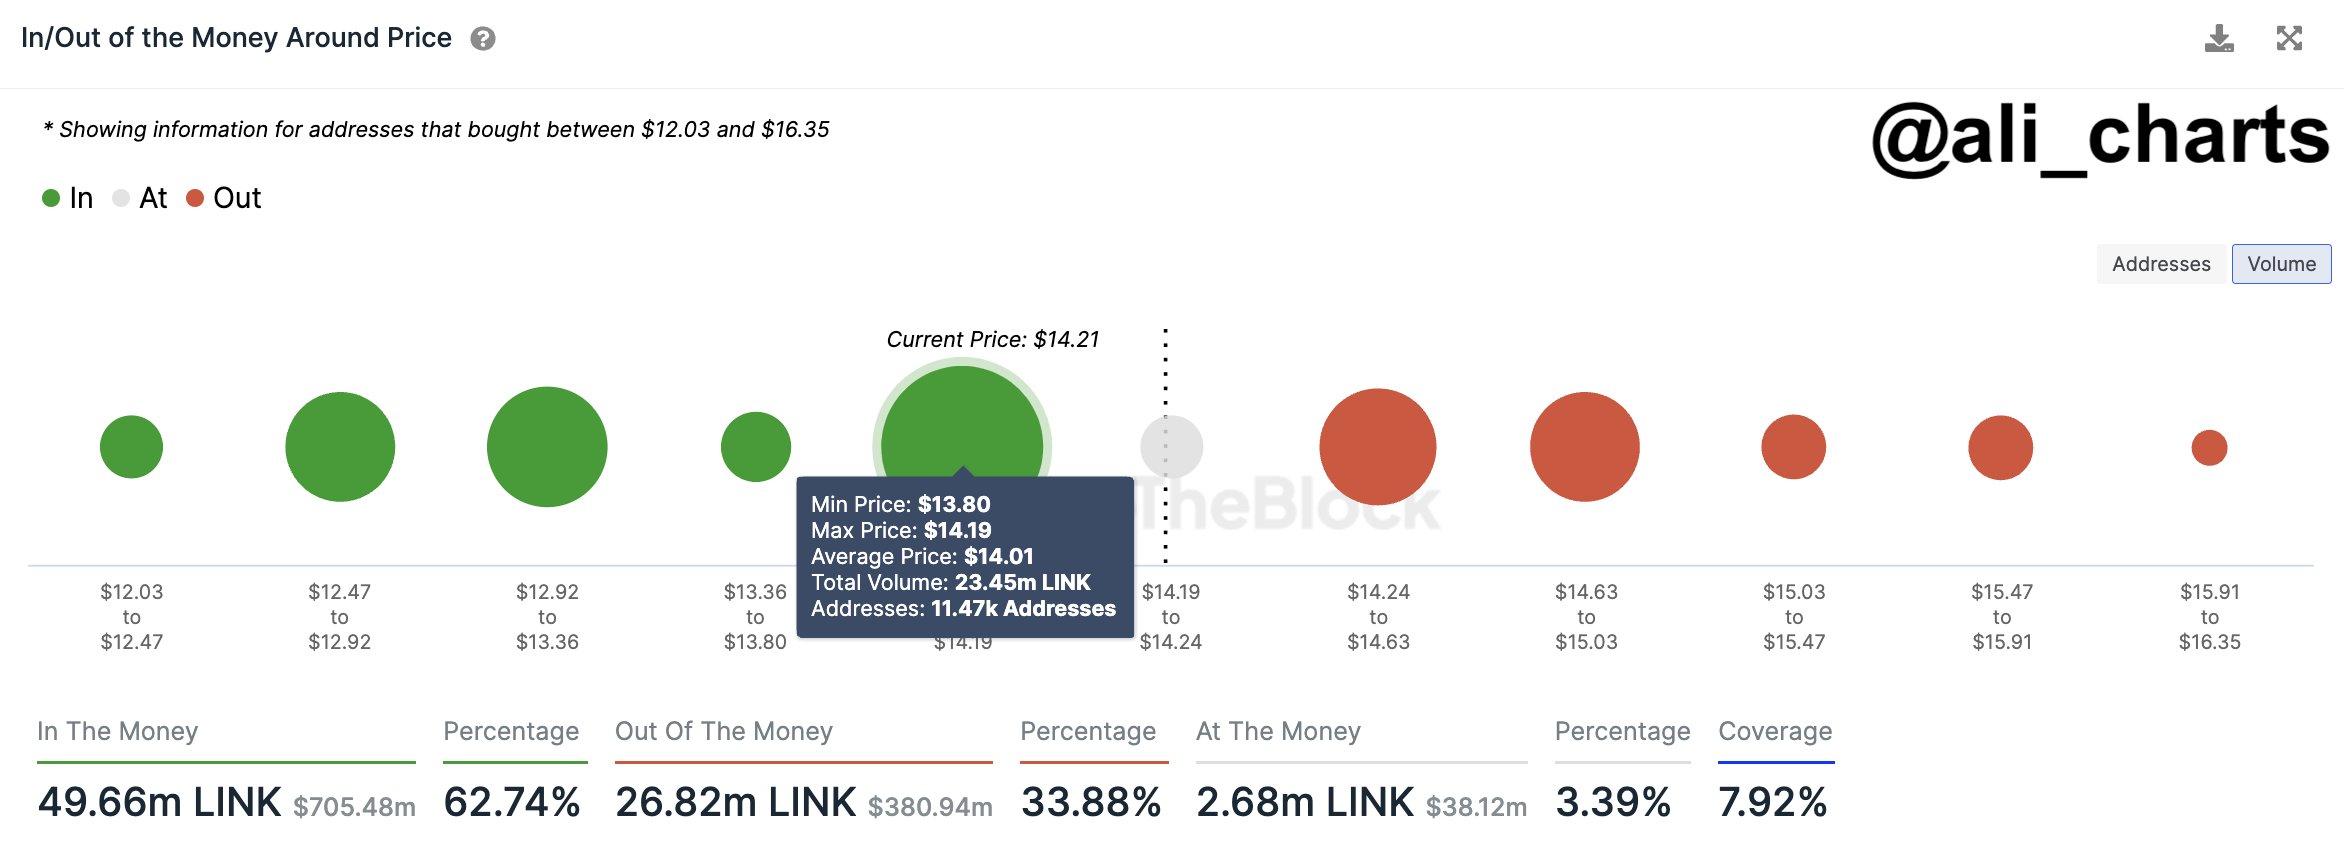
As explained by analyst Ali in a new post on X, LINK has significant on-chain resistance at $20. In on-chain analysis, the strength of a support/resistance level lies in the amount of BTC that the investors bought at it.

Below is a chart that shows the distribution of holder cost basis across the various LINK price ranges near the current price of the cryptocurrency.

Chainlink Resistance

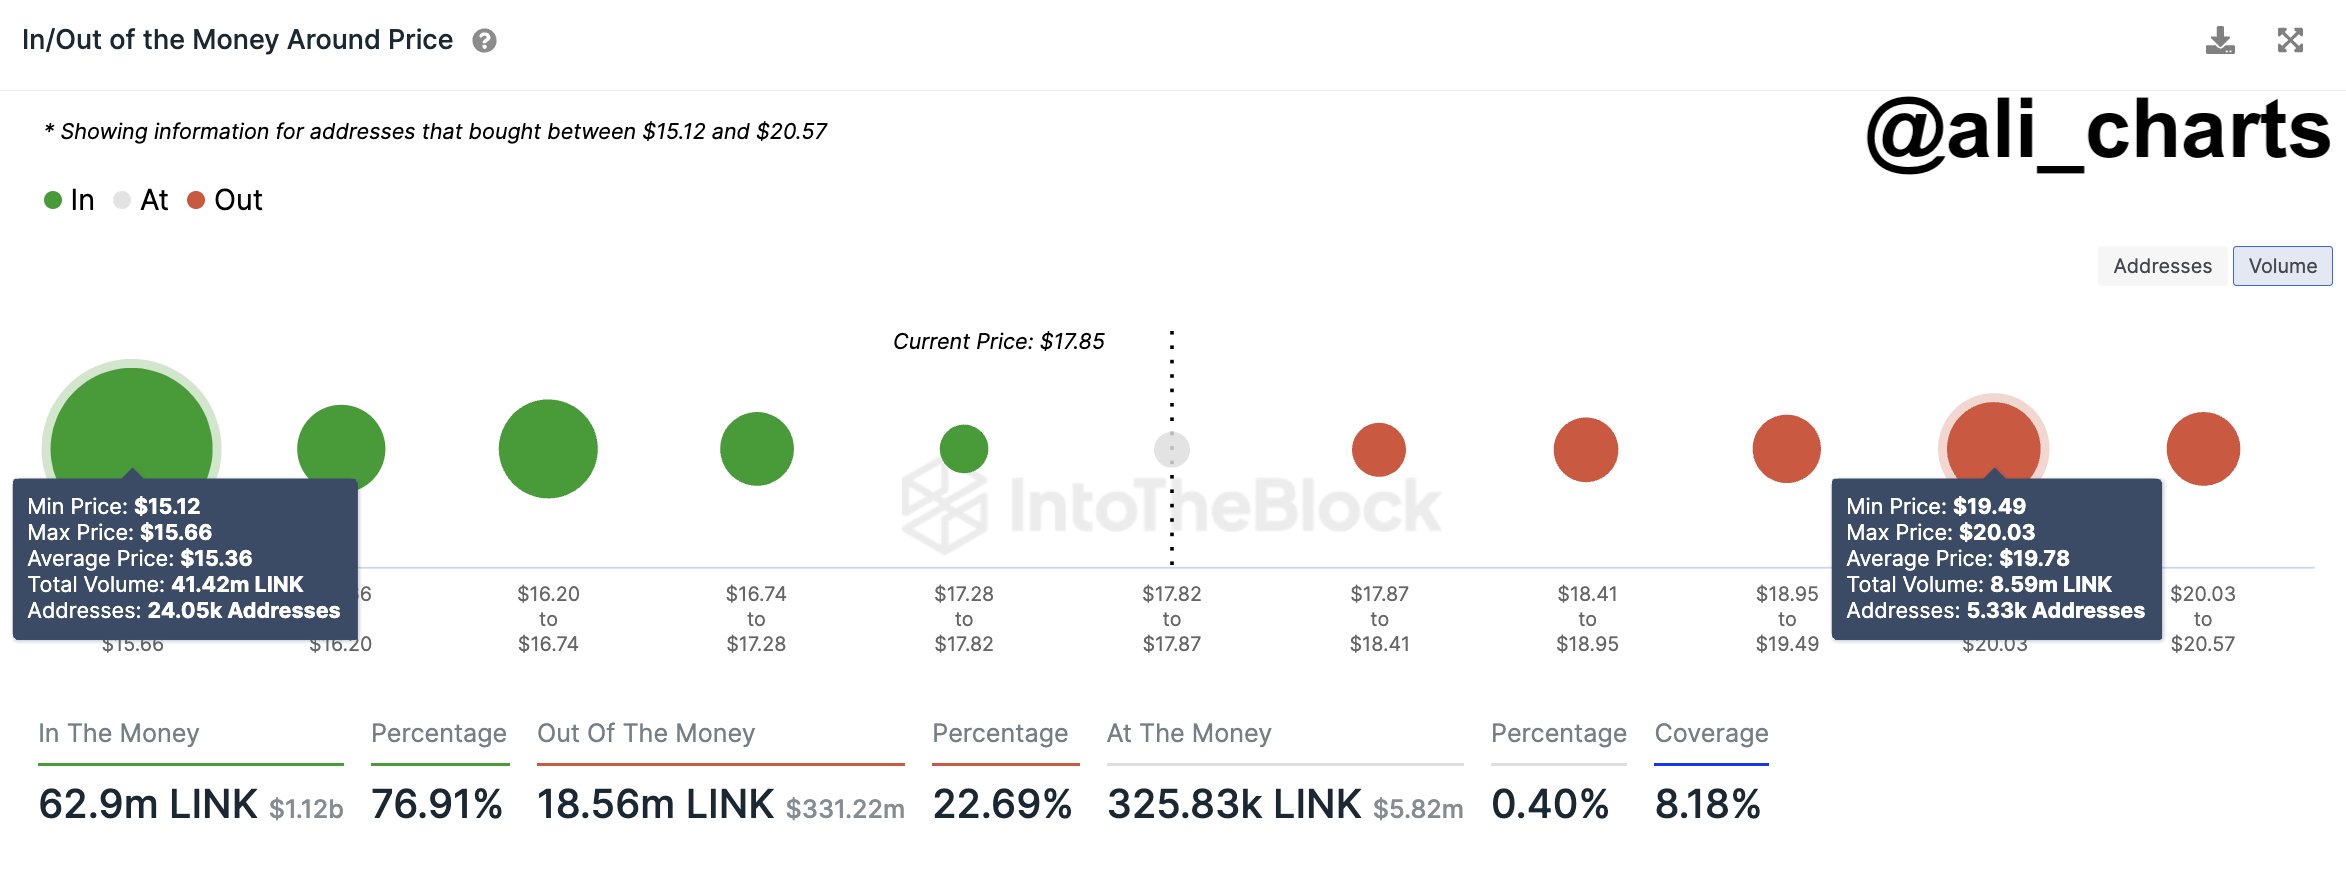
When the analyst shared the chart, LINK was trading around $17.85, and the ranges until the $19.49 to $20.03 one weren’t too dense with investors. Chainlink has mowed through some of these weaker price levels since then, and the asset may continue to do so until it strikes the resistance wall around $20.

In total, 5,330 addresses bought 8.59 million LINK within this range. Generally, investors become more sensitive when the price retests their cost basis, so they may be prone to making some moves. For investors in loss like those inside this range, such a retest can mean an exit opportunity, as they might be desperate to get their money back.

This effect becomes more pronounced as investors share their cost basis inside the same range, so ranges with dense cost basis distribution can be a source of major resistance for the spot price.

Chainlink Retests $14: Here’s What Will Happen If Support Holds

Chainlink has registered some drawdown and has recently retested the $14 level. Here’s what might happen if support holds at this mark.

On-Chain Data Suggests Resistance Is Thin At Higher Chainlink Levels

As pointed out by analyst Ali in a new post on X, Chainlink is currently in a critical on-chain demand zone. In on-chain analysis, a price range is defined as major support or resistance based on the number of investors or addresses that bought their coins inside the said range.

To any holder, their cost basis is naturally fundamental, as their profit/loss situation can flip whenever the cryptocurrency retests it. For this reason, an investor becomes more likely to show a move whenever such a retest takes place.

If the holder had earlier been holding a loss, but the price has now risen and reached its equilibrium point, they might lean towards selling. This is because they might fear their holdings would go into loss again shortly, so exiting at break-even wouldn’t sound like a bad idea.

The opposite can be true when the retest occurs from above: the investor might be willing to buy more, thinking that if this same cost basis proved profitable earlier, it would do so again soon.

A single investor making such buy or sell moves is insignificant for the rest of the market, but if many investors share the same cost basis, the asset could feel a sizeable reaction when the price retests the level.

Now, here is a chart that shows how the Chainlink ranges around the current price look in terms of the density of investors who bought inside them:

Chainlink Cost Basis

As displayed in the above graph, the Chainlink levels from $13.8 to $14.2 host the cost basis of about 11,470 addresses, which acquired 23.45 million LINK inside this range.

This range is notably thicker than any other range immediately below or above the asset’s current price. LINK has been floating around this range recently, meaning it has been retesting this major support zone.

From the chart, it’s apparent that the ranges above don’t contain that many investors, so in theory, a move toward the higher levels shouldn’t be too hard for the asset.

However, the trouble would be if this support area is lost and LINK slips under it for an extended duration. This dense zone will turn into a resistance wall if this happens, making it hard for the cryptocurrency to recover above it.

Ali notes, though, that if Chainlink can remain above this zone, the price could climb towards new highs for the year 2023.

LINK Price

Chainlink had slipped below this range just earlier, but the asset was quick to recover above it, implying that it’s still holding up as support.

Chainlink Price Chart