Dogecoin Trounced: Chainlink’s 34% Jump Kicks DOGE Out Of Top 10 List

After Chainlink’s impressive run of more than 34% over the past week, LINK has dethroned Dogecoin (DOGE) from the top 10 crypto by market cap list.

Chainlink Has Pulled Away From The Crowd With A Sharp Surge Recently

While most cryptocurrency sectors have observed minimal movement recently, Chainlink has emerged as an outlier, enjoying a surge of over 34% in the last week.

The below chart shows how LINK has performed over the past month.

Chainlink Price Chart

LINK had achieved a major milestone, breaking above the $18 level earlier during this latest rally, but with a sharp 8% continuation of the run, the coin has now surged beyond the $19.5 mark for the first time since early 2022.

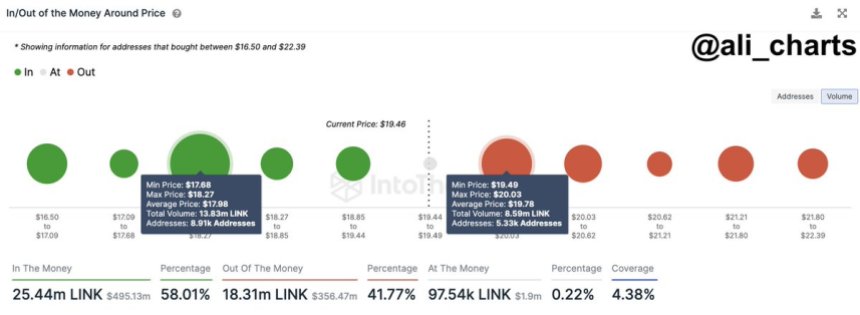
Should Chainlink’s surge continue, the cryptocurrency would be retesting the $20 level, which could prove to be a source of major resistance, according to on-chain data.

LINK has surged more than 38% over the past thirty days, which means it has significantly outperformed the wider sector. Bitcoin, for instance, hasn’t even been able to put together positive returns in this period, as the original cryptocurrency’s price has declined by almost 2%.

Thanks to this strong rally, Chainlink has changed its standing among the wider sector. Specifically, the token has shaken things up in the market cap list.

Dogecoin Has Lost Its Position In The Top 10 List To LINK

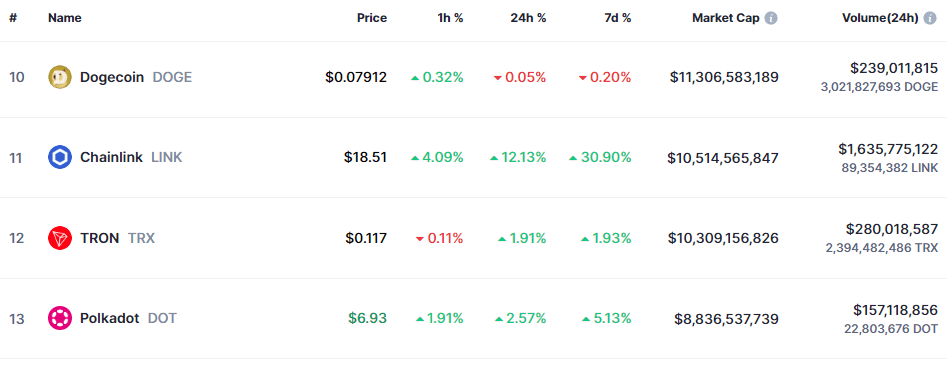
Following the rally, LINK has improved its market cap rank and is now the 10th largest cryptocurrency in the sector based on this metric. Dogecoin, holding this spot earlier, has now fallen to 11th.

The table below shows how the two assets fit in the broader sector.
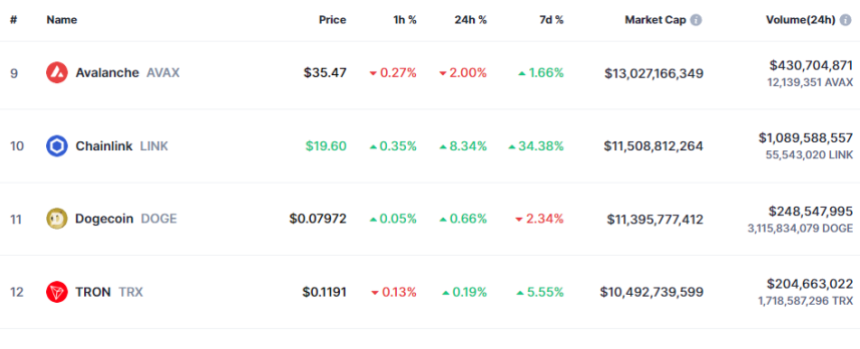
Dogecoin Vs Chainlink

Although Chainlink has now surpassed Dogecoin in this metric, the gap between the two assets is still not much. This means the two coins may continue to flip each other in the coming days unless one shows diverging performance.

As LINK has arrived at this spot with a sharp surge, things may be looking favorably for the asset, especially considering that DOGE has rather put up negative returns in the past week.

The overall picture has also been a bit dire for the memecoin recently, as the chart below displays that its price has followed a sideways trajectory during the past month.

Dogecoin Price Chart

Unless things change fast for Dogecoin, its exit from the top 10 list may be here to stay. Of course, this only assumes that Chainlink itself doesn’t fall off shortly.
Chainlink Breakout: LINK Poised For 38% Rally If It Clears This Key Resistance

Decentralized oracle network Chainlink (LINK) has been making significant strides in the altcoin market, outperforming its peers with an impressive 44.8% price increase over the past 30 days. 

Surging to a 24-month high, the cryptocurrency has inched closer to the $20 mark, attracting the attention of bullish investors. Notably, the uptrend for LINK may be far from over, as it can potentially record a substantial 38% price gain by breaking through a critical resistance level.

Chainlink Trading Volume Skyrockets

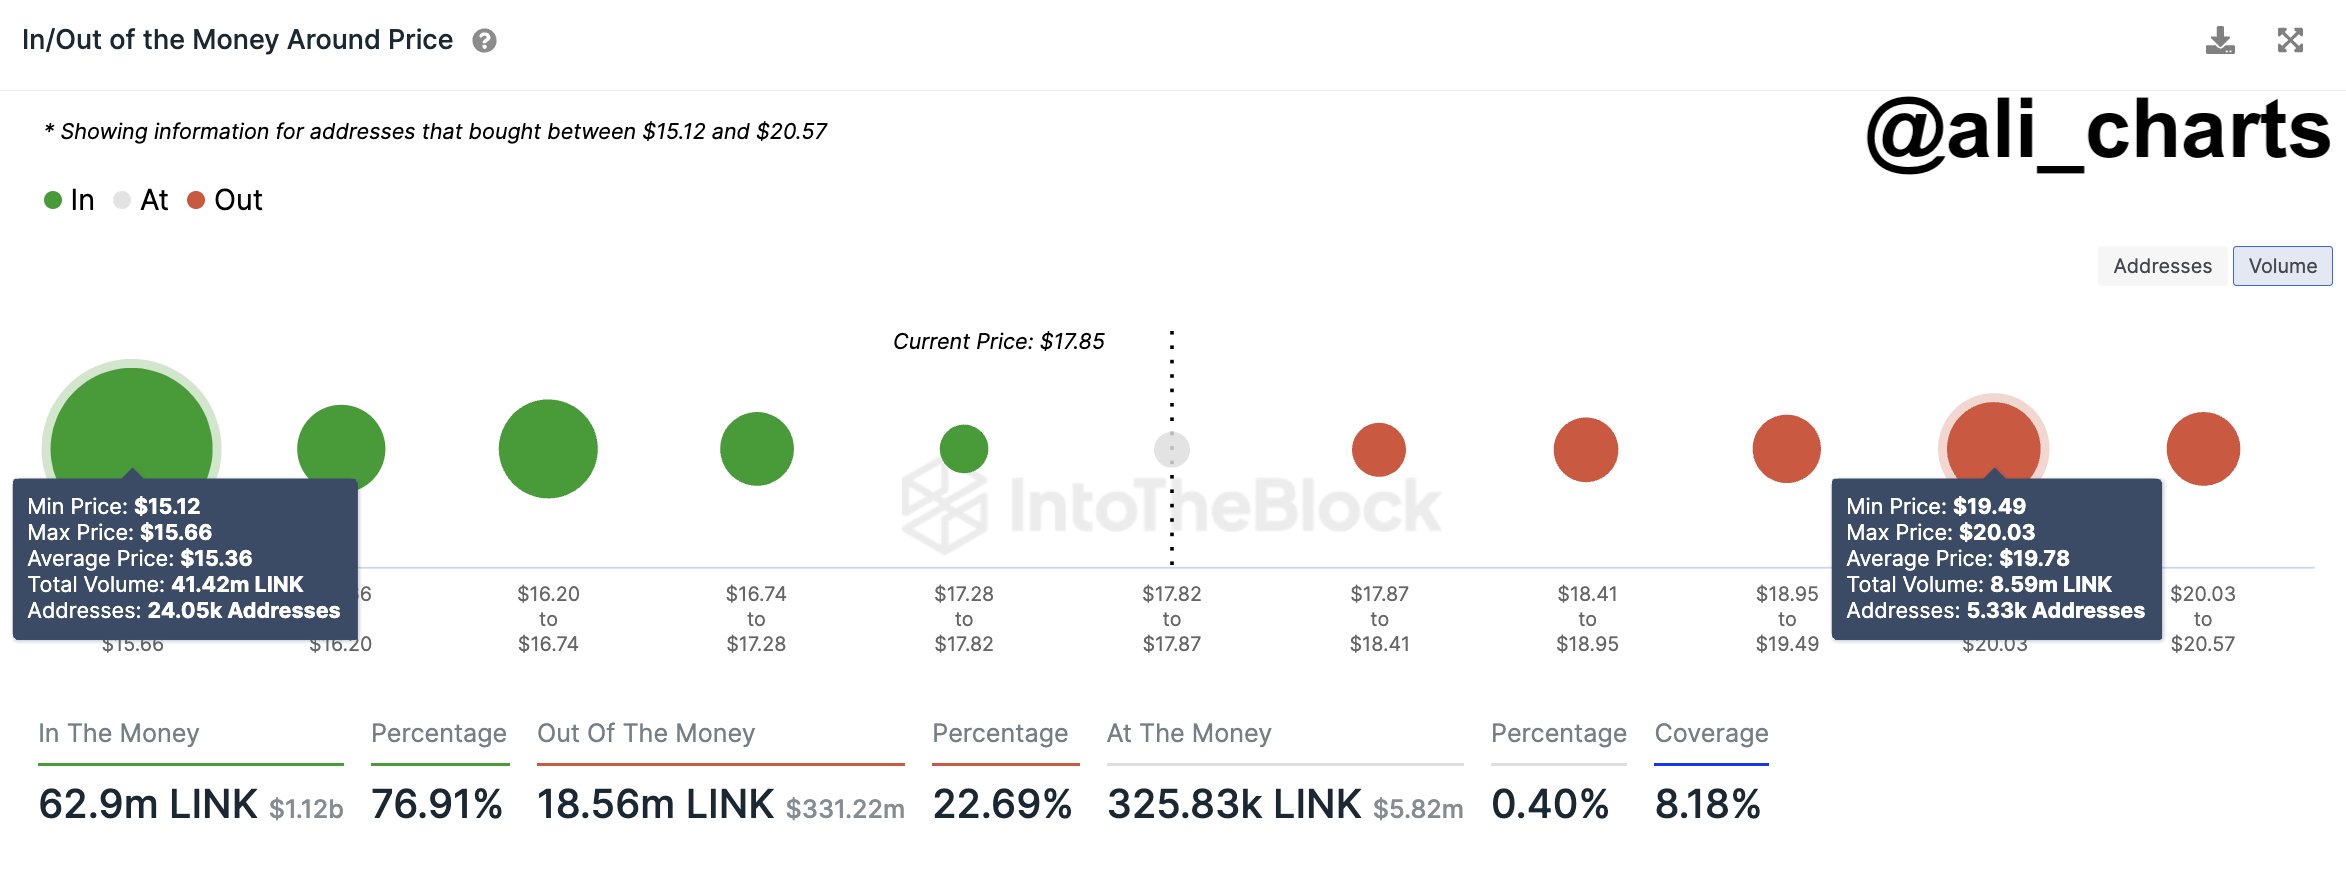
Crypto analyst Ali Martinez indicates that Chainlink faces formidable resistance between its current trading price of $19.40 and $20.03, with 5,330 addresses collectively holding over 8.59 million LINK. 

Chainlink

Despite this supply wall, if Chainlink manages to break through, Ali Martinez suggests that the next critical resistance level stands at $26.87, presenting an opportunity for a significant 38% price surge.

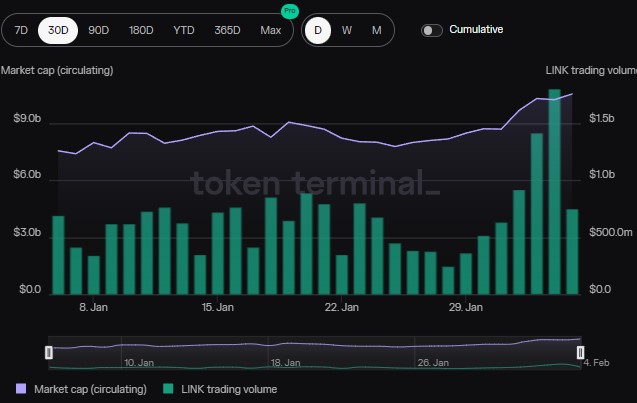
Adding to the positive outlook, Chainlink has witnessed a surge in trading volume and an increase in circulating market cap over the past few days. 

Data from Token Terminal reveals that while Chainlink’s trading volume has steadily risen over the past 30 days, the token experienced exceptional trading volume of over $9.5 billion in the past three days alone. This surge in trading activity suggests a growing interest from investors in the Chainlink protocol.

Chainlink

Examining the circulating market cap, Token Terminal data highlights a positive trend. The circulating market cap of Chainlink stands at $10.53 billion, displaying a notable increase of 32.66% over the past 30 days. In terms of fully diluted market cap, Chainlink records $18.16 billion, indicating a substantial rise of 28.89% over the same period.

Institutional Interest In LINK?

Recent blockchain data suggests that institutional investors are actively accumulating LINK. According to Spot On Chain data, the emergence of eight wallets withdrawing a substantial amount of LINK tokens, coupled with a price surge shortly after, indicates institutional interest in the cryptocurrency. 

Over the past twelve hours, eight new wallets, likely representing a single individual or institution, have collectively withdrawn 227,350 LINK tokens, equivalent to approximately $4.12 million at the withdrawal time. 

Notably, a significant portion of these tokens was withdrawn from centralized exchanges (CEX) just before the price experienced a sudden increase of approximately 4.1%. This pattern suggests that institutions may strategically accumulate LINK tokens, anticipating future price appreciation.

Moreover, as indicated by its performance on the algorithmic market scanner Commando, LINK has consistently been a top performer in the cryptocurrency market. 

According to the market intelligence platform Decentrader, with a current score of 1.83 and a green signal on low time frames, Chainlink’s technical analysis suggests a positive outlook for the cryptocurrency. Noteworthy is the recent breakthrough of Chainlink’s price from a range held up by the 200-week moving average (200WMA). 

This breakout indicates a shift in market sentiment and a potential upward trend. The cryptocurrency is now aiming to target the “Sniper resistance” level just above $20 while finding support at the top of the previous range, around $16.8, according to Decentrader. 

Overall, institutions’ accumulation of Chainlink tokens and the cryptocurrency’s technical breakout point to growing confidence in LINK’s investment potential. 

The withdrawals from centralized exchanges suggest a desire to hold LINK tokens outside exchange custody, possibly indicating a longer-term investment strategy. 

Chainlink

Currently, LINK is trading at $19.7, up 8% in the last 24 hours.

Featured image from Shutterstock, chart from TradingView.com

Chainlink (LINK) Price Breaks Out Of Bullish Flag Pole, Here’s The Next Target

The Chainlink (LINK) price has been on an impressive rally over the last week that has brought its price to new yearly highs. As LINK bulls continue to hold firmly above the $18 support, the emergence of this bullish rally has continued to signal that the price surge is far from over.

Crypto Analyst Says Chainlink Bullish Flag Has Been Broken

In an analysis posted on the TradingView website, crypto analyst CobraVanguard explains why the Chainlink price is currently very bullish. According to the analyst, despite the altcoin showing very bullish signs, a lot of traders are failing to realize that this is the case.

They identified a flag pole that was created in the chart, and in this case, the flag for the LINK price was actually bullish. Even more interesting is the fact that the analyst revealed that the Chainlink price had successfully broken this flag, which they say is bullish for the price.

Chainklink price chart from Tradingview.com

“LINKUSDT is in a Bullish flag Patter,” the analyst said. “We can expect a bullish movement as much as the Measured Price movement (flag pole) to happen!” This further solidifies LINK’s entrance into its most bullish phase so far in 2024.

Another major factor that the analyst identifies for the LINK price at this level is that the price was testing the major supply zone at $18. At the time, the LINK price had not cleared this level. But at the time of writing, LINk has broken clean off this major supply zone and is now trending toward $19. “The Flag Is Broken,” the crypto analyst declared.

What Are The Targets For The LINK Price?

In the chart shared in the analysis, the crypto analyst identifies two major points of interest in the Chainlink chart and these are the Supply Zone and the Target Price. The first, which is the Supply Zone, is at $18.3, and the LINK price has already broken above this level.

Given this, the next major point of interest is the Target Price, and CobraVanguard puts this at the $27 price level. However, there is no straight shot toward this level as the analyst’s chart also shows a correction below the $13 support before rallying onto its target.

If this analysis holds over the coming days/weeks, then the LINK price could see a sharp 20% correction as the first sign. Then from there, a complete 100% move upward to bring the price to the $27 price target.

At the time of writing, LINK bulls continue to show dominance after a sharp 7% move in the last day. On the broader chart, the LINK price is up 27% in the last week, bringing its market cap to $10.9 billion.

LINK price chart from Tradingview.com (LINK Crypto analyst)

Chainlink Price Stalls As $287 Million Worth Of LINK Makes Its Way To Binance

The price performance of Chainlink is one of the previous week’s biggest narratives, rivaling Bitcoin making its way above $43,000 again. According to data from CoinGecko, the altcoin recorded a significant 25% price increase in the last seven days.

However, the price of LINK seems to be slowing down, as it keeps struggling to hold above the $18 level. While expectations are that this sluggishness will blow over soon, the question still is – why is the Chainlink price stalling?

16 Million LINK Tokens Transferred To Binance

The latest on-chain revelation has offered insight into why the price of LINK is facing some form of bearish pressure. In a post on X, crypto analytics firm SpotOnChain disclosed that 19 million tokens (worth about $341 million) were recently unlocked from three of Chainlink’s non-circulating supply contracts.

In a more detailed breakdown, the on-chain analytics firm revealed that 15.95 million tokens (valued at $287 million) were moved to Binance, the world’s largest centralized exchange. Meanwhile, the remaining 3.05 million Chainlink (worth $54.3 million) were transferred to multi-sig wallet, 0xD50f.

According to SpotOnChain, this is not the first time transactions involving Chainlink’s wallets and of this caliber will happen. The analytics platform disclosed that Chainlink has been unlocking and transferring some of the unlocked tokens to Binance as far back as 2022.

On-chain data shows that Chainlink has unlocked a total of 106 million tokens, with 88.95 million LINK sent to Binance since August 2022. At an average price of $9.06, the entire worth of these transactions stands at $805 million.

SpotOnChain noted that the last two unlocks have been followed by a slight dip in LINK’s price. The last unlock saw the Chainlink token fall from almost $19 to $17.5 on Saturday, February 3.

As of this writing, the LINK token is valued at $17.86, reflecting a nearly 1.5% price jump in the past day.

Chainlink Records Multi-Month High In Transaction Volume

It appears that the price of LINK will not remain stagnant for very long, as the most recent on-chain data indicates that Chainlink has experienced a notable increase in network activity over the last few days. Positive network fundamentals could be all the altcoin needs to resume its bullish run.

According to Ali Martinez, the network recently witnessed a significant surge in transaction volume, bringing the metric to its highest in almost two years. Based on IntoTheBlock’s data, more than 72.24 million LINK tokens (equivalent to $1.3 billion) were transacted on Friday, February 4. 

Chainlink

These Altcoins Are Showing High Social Dominance After Recent Price Swings

According to crypto intelligence platform Santiment, some altcoins have been enjoying increased attention from investors over the past few days. This comes as the crypto market continues to undergo a positive recovery from its recent slump in the aftermath of the Bitcoin ETF launch.

These Altcoins Show Potential For More Profit: Santiment

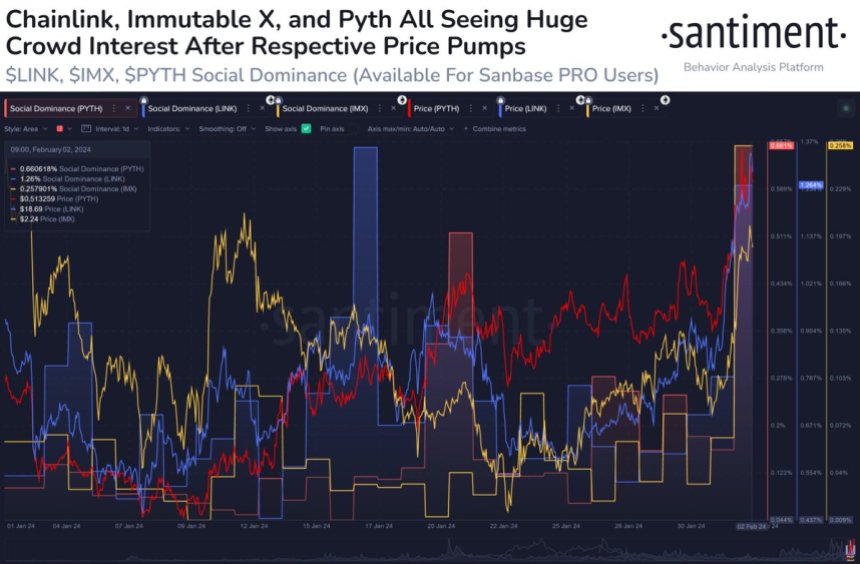
In a post on the X platform, Santiment revealed that three altcoins, including Chainlink (LINK), Immutable X (IMX), and Pyth (PYTH), have become assets of mainstream interest in the past few days. 

This revelation is based on their performance in terms of Social Dominance, an indicator that compares the social volume of a particular asset to the combined social volume of the top 100 cryptocurrencies by market capitalization. 

Altcoins

As shown in the chart above, the Social Dominance of these three altcoins has seen a notable spike in recent days. Interestingly, Santiment has associated this renewed investor interest in Chainlink, Immutable X, and Pyth, with their market cap growth in the past week.

According to data from Santiment, the valuations of LINK, IMX, and PYTH have increased by 34%, 23%, and 26%, respectively, in the last seven. The on-chain analytics noted that the mainstream crowd discussion around these altcoins will lead to FOMO (fear of missing out) amongst investors.

Santiment further highlighted that this FOMO can trigger high price volatility and increased buying pressure for Chainlink, Immutable X, and Pyth. Ultimately, this can lead to more price gains for the three crypto assets.

Chainlink Price Overview

The price performance of Chainlink in the past week has been the most impressive of the three altcoins highlighted by Santiment. According to data from CoinGecko, LINK’s value has jumped by more than 24% in the past week.

In a week dominated by Bitcoin’s resurgence to above $43,000, Chainlink managed to become one of the biggest gainers in the last seven days. The cryptocurrency’s price registered a positive run to almost as high as $19.

As of this writing, the Chainlink token is valued at $17.69, reflecting a 1.2% price decline in the last 24 hours. The altcoin appears to be witnessing some amount of downward pressure as it is struggling to hold above the $18 level.

Nevertheless, Chainlink continues to lay a strong claim to a spot amongst the top 10 largest cryptocurrencies by market capitalization. With a market cap of over $10 billion, LINK ranks as the 13th-largest asset in the cryptocurrency sector.

Altcoins

Chainlink Surges 12% To $18: Price Set To Retest $20 Next?

Chainlink has shot up over 12% to break $18 during the past day. A retest of the on-chain resistance wall at $20 could be next.

Chainlink Has Outperformed Market With Its 12% Rally

The past 24 hours have been green for most of the cryptocurrency sector, but the positive returns have been small for most of the market, with Bitcoin, the largest digital asset, only seeing profits of 1%.

Chainlink, however, has separated from the crowd during this period, rallying around 12%. The chart below shows how the coin has performed over the last few days.

Chainlink Price Chart

With this latest surge, Chainlink has surpassed the $18 level for the first time in almost two years. With profits of about 30% over the past week, LINK is by far the best-performing asset among the top 60 cryptocurrencies by market cap.

Speaking of the market cap list, LINK has now flipped Tron (TRX) to become the 11th largest asset in the sector following this recent strong performance. The table below shows where LINK stands among its peers in the sector right now.

Chainlink Market Cap

Dogecoin (DOGE) is the next coin above Chainlink now, and if the asset can continue its run, it should be able to flip the meme coin. While there is still some gap between their market caps, it isn’t too big.

Whether the coin can further this rally or not, perhaps on-chain data could provide some hints.

LINK Has Next Major On-Chain Resistance Wall Around $20

As explained by analyst Ali in a new post on X, LINK has significant on-chain resistance at $20. In on-chain analysis, the strength of a support/resistance level lies in the amount of BTC that the investors bought at it.

Below is a chart that shows the distribution of holder cost basis across the various LINK price ranges near the current price of the cryptocurrency.

Chainlink Resistance

When the analyst shared the chart, LINK was trading around $17.85, and the ranges until the $19.49 to $20.03 one weren’t too dense with investors. Chainlink has mowed through some of these weaker price levels since then, and the asset may continue to do so until it strikes the resistance wall around $20.

In total, 5,330 addresses bought 8.59 million LINK within this range. Generally, investors become more sensitive when the price retests their cost basis, so they may be prone to making some moves. For investors in loss like those inside this range, such a retest can mean an exit opportunity, as they might be desperate to get their money back.

This effect becomes more pronounced as investors share their cost basis inside the same range, so ranges with dense cost basis distribution can be a source of major resistance for the spot price.

Renowned Crypto Expert Reveals Top 3 Altcoins Ready To Breakout In February 2024

A prominent crypto analyst and Bitcoin enthusiast, Michael Van de Poppe, has shared insights on the future trajectory of several altcoins in the space. The crypto analyst’s predictions highlight crucial moments for investors as they watch out for opportune times to buy and sell cryptocurrencies in this dynamic market. 

Altcoins Set To Rise In 2024

Following the approval of Spot Bitcoin ETFs, Bitcoin experienced a substantial surge, rallying to overcome the $45,000 price mark. During this bullish momentum, the prices of several altcoins, including Ethereum (ETH) and Solana (SOL), also witnessed significant increases. 

In a recent X (formerly Twitter) post, Poppe revealed major altcoins to buy or sell in 2024. The crypto analyst shared a chart illustrating the historical price movements and corrections of Solana, Polygon (MATIC) and Chainlink (LINK). 

Poppe revealed that Solana’s consolidation phase appears to have ended after it experienced a major decline from its 2023 peak of over $123 to $95.81 at the time of writing. His analysis suggests that Solana is poised for a higher time frame support test at $80 and is anticipated to surge to new highs, potentially reaching $140. 

Subsequently, the crypto analyst presented a historical performance chart of MATIC, the native token of Polygon. Noting that the cryptocurrency has maintained higher time frame support levels with established liquidity, Poppe predicts an upcoming upward movement despite MATIC’s recent underperformance. 

He forecasts that MATIC’s next rally could propel its price to a range between $1.25 and $1.50. As of now, the price of MATIC is trading at $0.789, reflecting a 2.39% decline in the past 24 hours, according to CoinMarketCap. 

The Bitcoin enthusiast also anticipates a substantial price increase for Chainlink’s native token, LINK. The crypto analyst revealed that the cryptocurrency has consistently held crucial price levels and is positioned for an upward momentum towards $25. At the time of writing, the price of LINK stands at $14.65, representing a 0.12% increase in the last 24 hours. 

Underperforming Crypto In 2024

In his X post, Poppe unveiled a roster of altcoins that has been struggling to surge and maintain crucial resistance levels. The crypto analyst pointed out that Ethereum’s recent slow growth has adversely impacted many altcoins, causing them to experience further declines. 

He mentioned Synthetix (SNX), which is currently depreciating primarily due to Ethereum’s lagging performance. Additionally, there is Arbitrum (ARB) and Polkadot (DOT), which Poppe predicts would have a significant price increase in the future. 

The Bitcoin enthusiast stated that if ARB can return to a price level of around $1.40 and $1.60, it could open up new entries into a more sustainable position. Subsequently, Poppe predicts a rise in the price of Polkadot to $15 despite its current price trading at $6.80. 

The crypto analyst revealed that DOT is currently showcasing a “great weekly candle”, and its previous price corrections present a great opportunity for investors in the ongoing bull market. 

Crypto Total Market Cap on Tradingview.com (Altcoins Analyst)

Is Chainlink (LINK) Ready To Soar? Key Indicators To Monitor

Among the 20 most important cryptocurrencies by market capitalization, Chainlink (LINK) is currently recording the second-highest loss of -10.4 % in the last seven days. This puts it just behind Ethereum, which recorded a slightly sharper decline of -10.9 %.

Despite this, a glimmer of optimism emerges when delving into the 1-day chart of LINK/USD. The analysis suggests a potential turnaround on the horizon. Should the current market structure remain intact, there’s a promising indication that the recent corrective phase for LINK might be drawing to a close.

Chainlink Price Analysis: Indicators To Watch

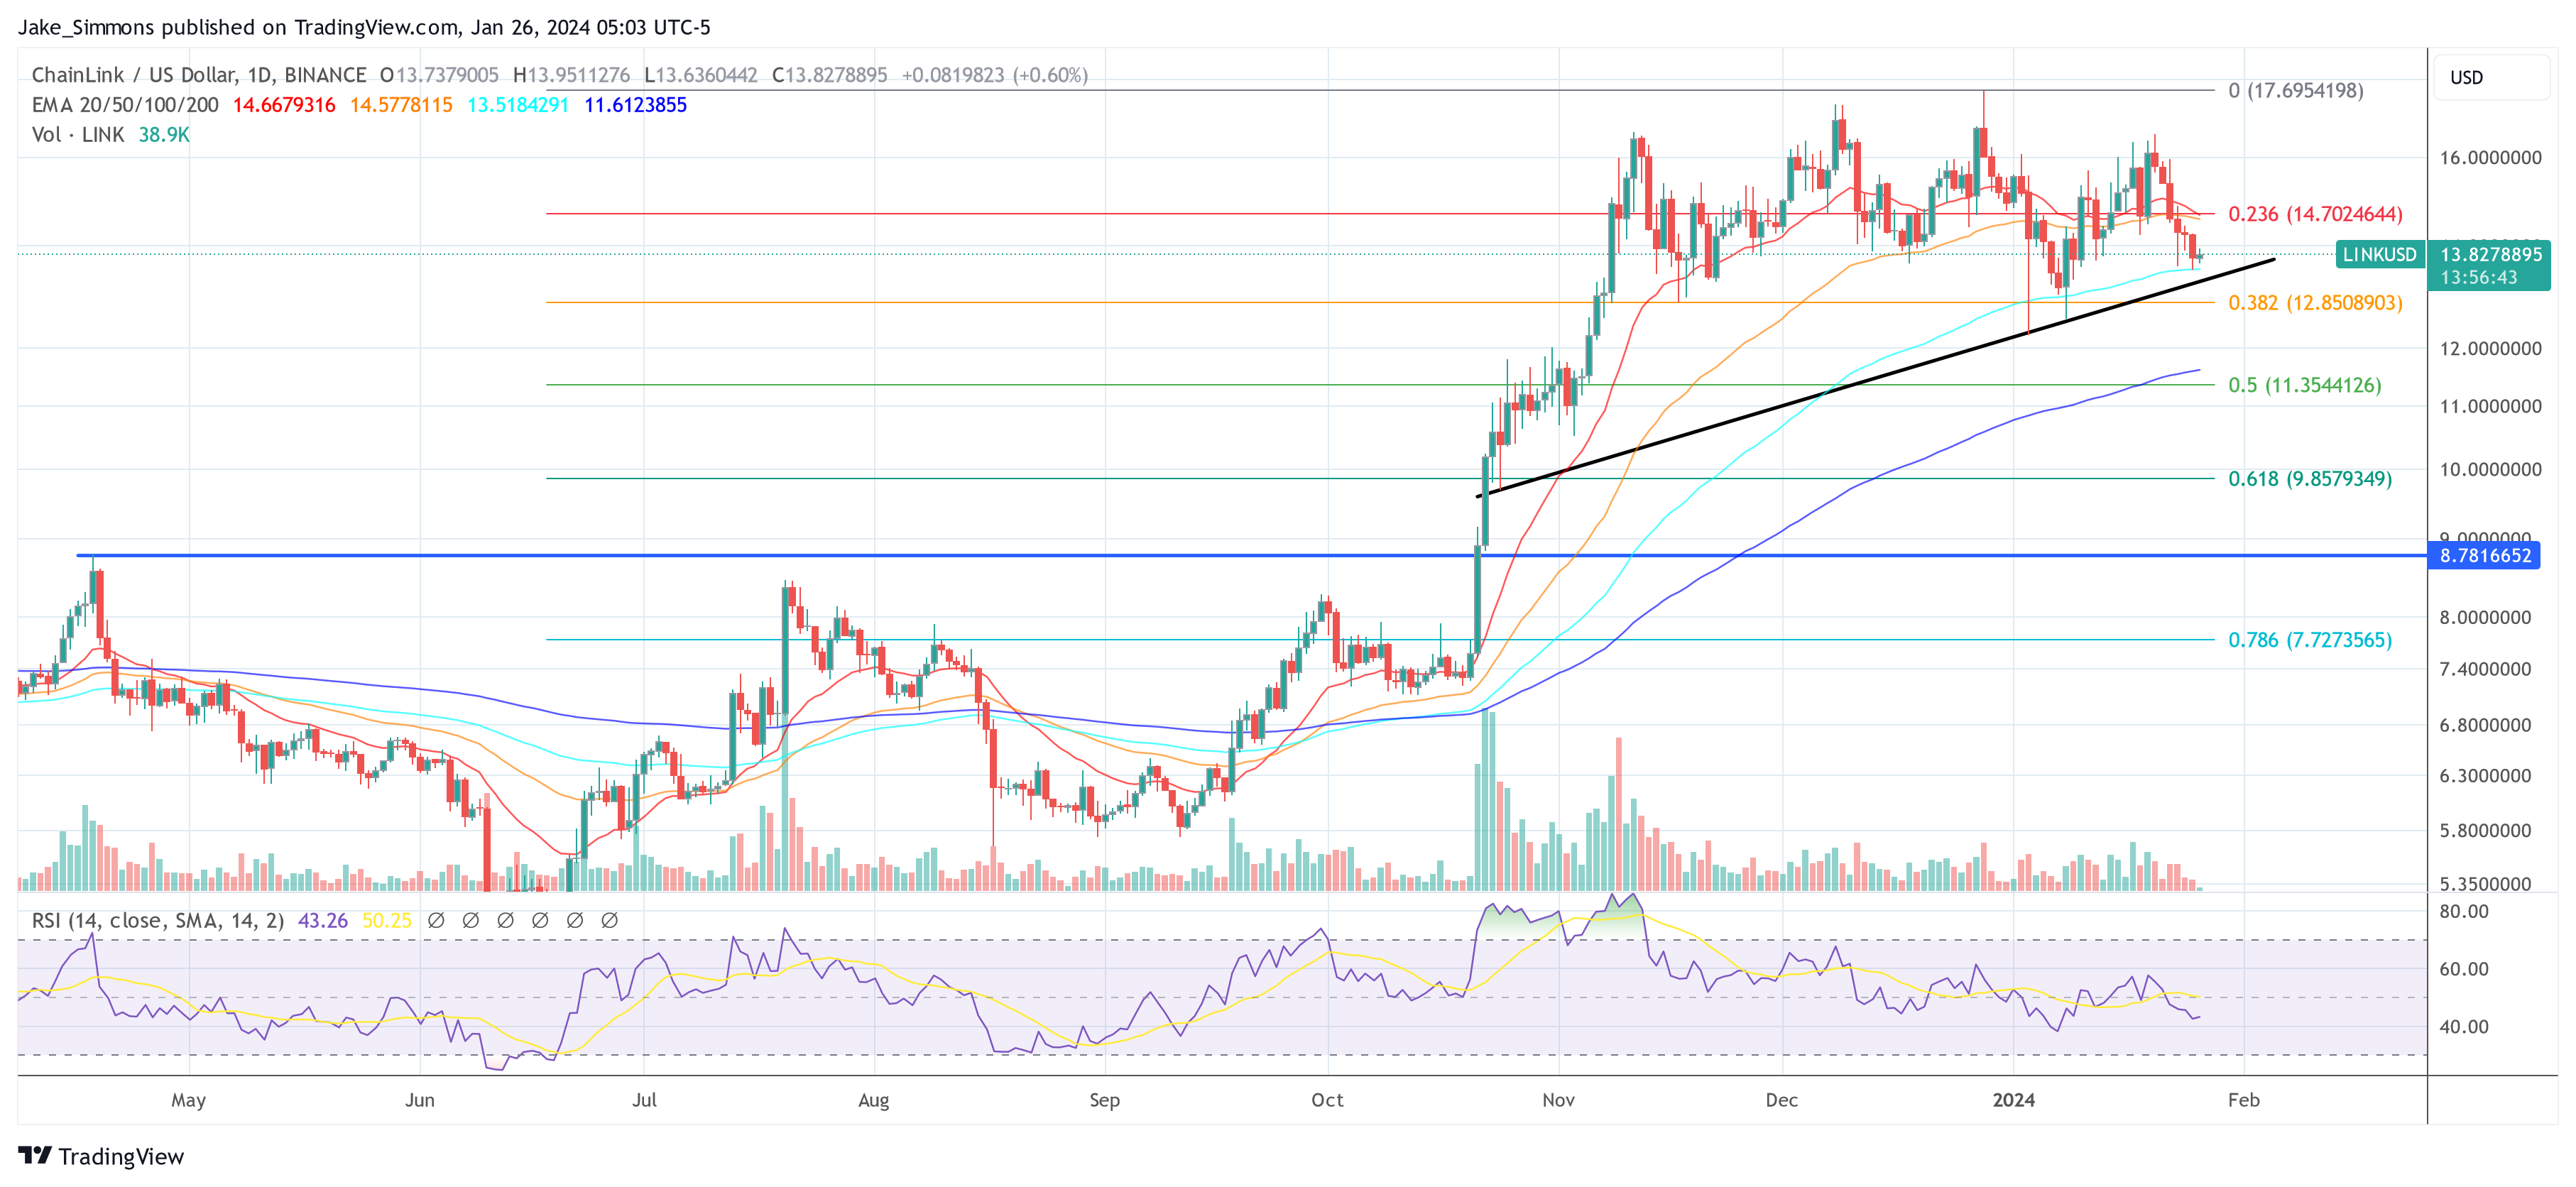
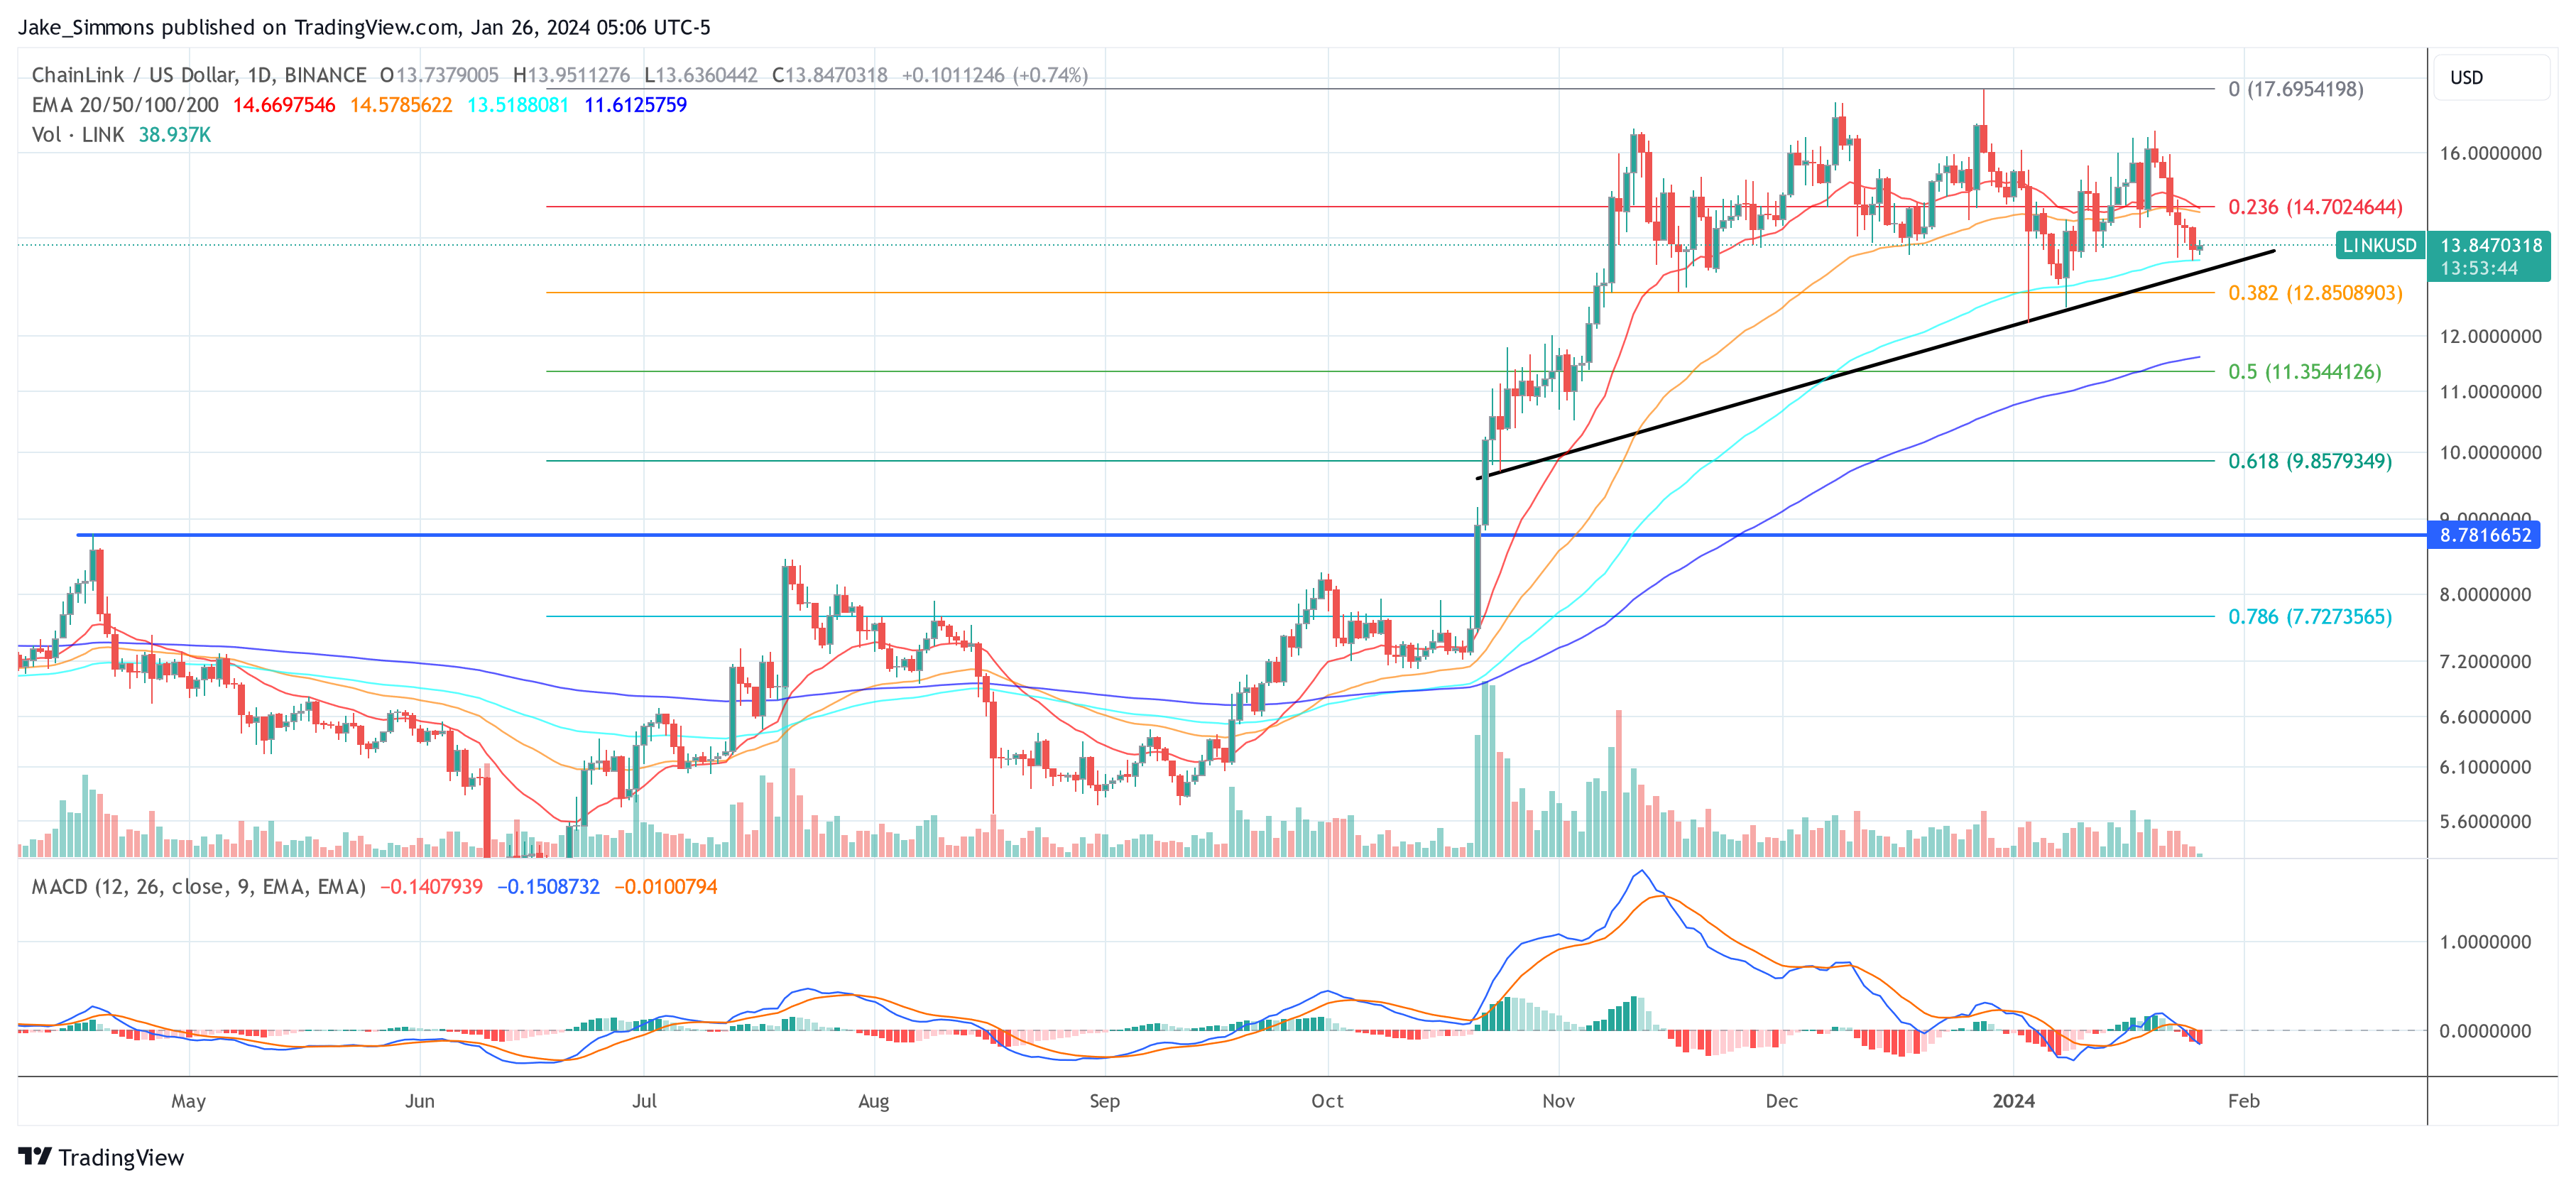
Several key indicators and patterns emerge that warrant the attention of traders and investors alike. Firstly, the price action has been demonstrating a series of higher lows, which could be indicative of an ascending triangle pattern forming – a bullish continuation pattern. As long as the LINK price holds above the rising trend (black line) established in late October of the previous year, the bulls remain in control.

At press time, LINK was trading at $13.82, presenting a nuanced narrative in its Exponential Moving Average (EMA) positioning. A critical observation is that LINK’s price is buoyantly positioned above the longer-term 100-day and 200-day EMAs, recorded at $14.6679316 and $11.61, respectively. This configuration typically signals a robust long-term bullish momentum, underpinning investor confidence in the asset.

Contrastingly, the short-term outlook is conveyed by the positioning of the 20-day and 50-day EMAs. With the 20-day EMA at $14.67 and the 50-day EMA at $14.58, both hover above the current price level, imparting a potential resistance zone. This immediate overhead resistance is indicative of a short-term bearish pressure or consolidation phase, possibly reflecting a market pause as traders and investors reassess their positions.

Chainlink price

The Fibonacci retracement levels, drawn from the swing low in June to the peak in December, suggest that LINK has recently tested the 0.236 retracement level at $14.70 as resistance. The subsequent levels to watch are 0.382 at $12.85, followed by 0.5 at $11.53, which could serve as potential support levels if a bearish reversal occurs. Conversely, a break above the 0.236 level may open the door to test the $17.69 level, which stands as a significant resistance.

On the volume front, trading activity has been moderate, with no significant spikes indicating a decisive market direction. The Relative Strength Index (RSI) is hovering around the 50 mark, which typically denotes a neutral market sentiment without clear overbought or oversold conditions.

The MACD indicator exhibits a bearish signal with the MACD line at -0.1407939, positioned below the signal line, which is at -0.1508732. The negative value of the MACD line suggests that the short-term momentum is weaker than the long-term momentum, indicating bearish sentiment in the current market.

Furthermore, the distance between the MACD and the signal line is very narrow, as reflected by the small histogram value of -0.0100794. This small negative histogram value indicates a weakening of downward momentum, as the MACD line is close to crossing above the signal line.

Chainlink price

Traders might view such a crossover as a potential change in momentum, possibly hinting at an upcoming bullish phase. However, until the crossover occurs, the prevailing sentiment indicated by the MACD remains bearish in the short term.

LINK/BTC: Bulls In Control

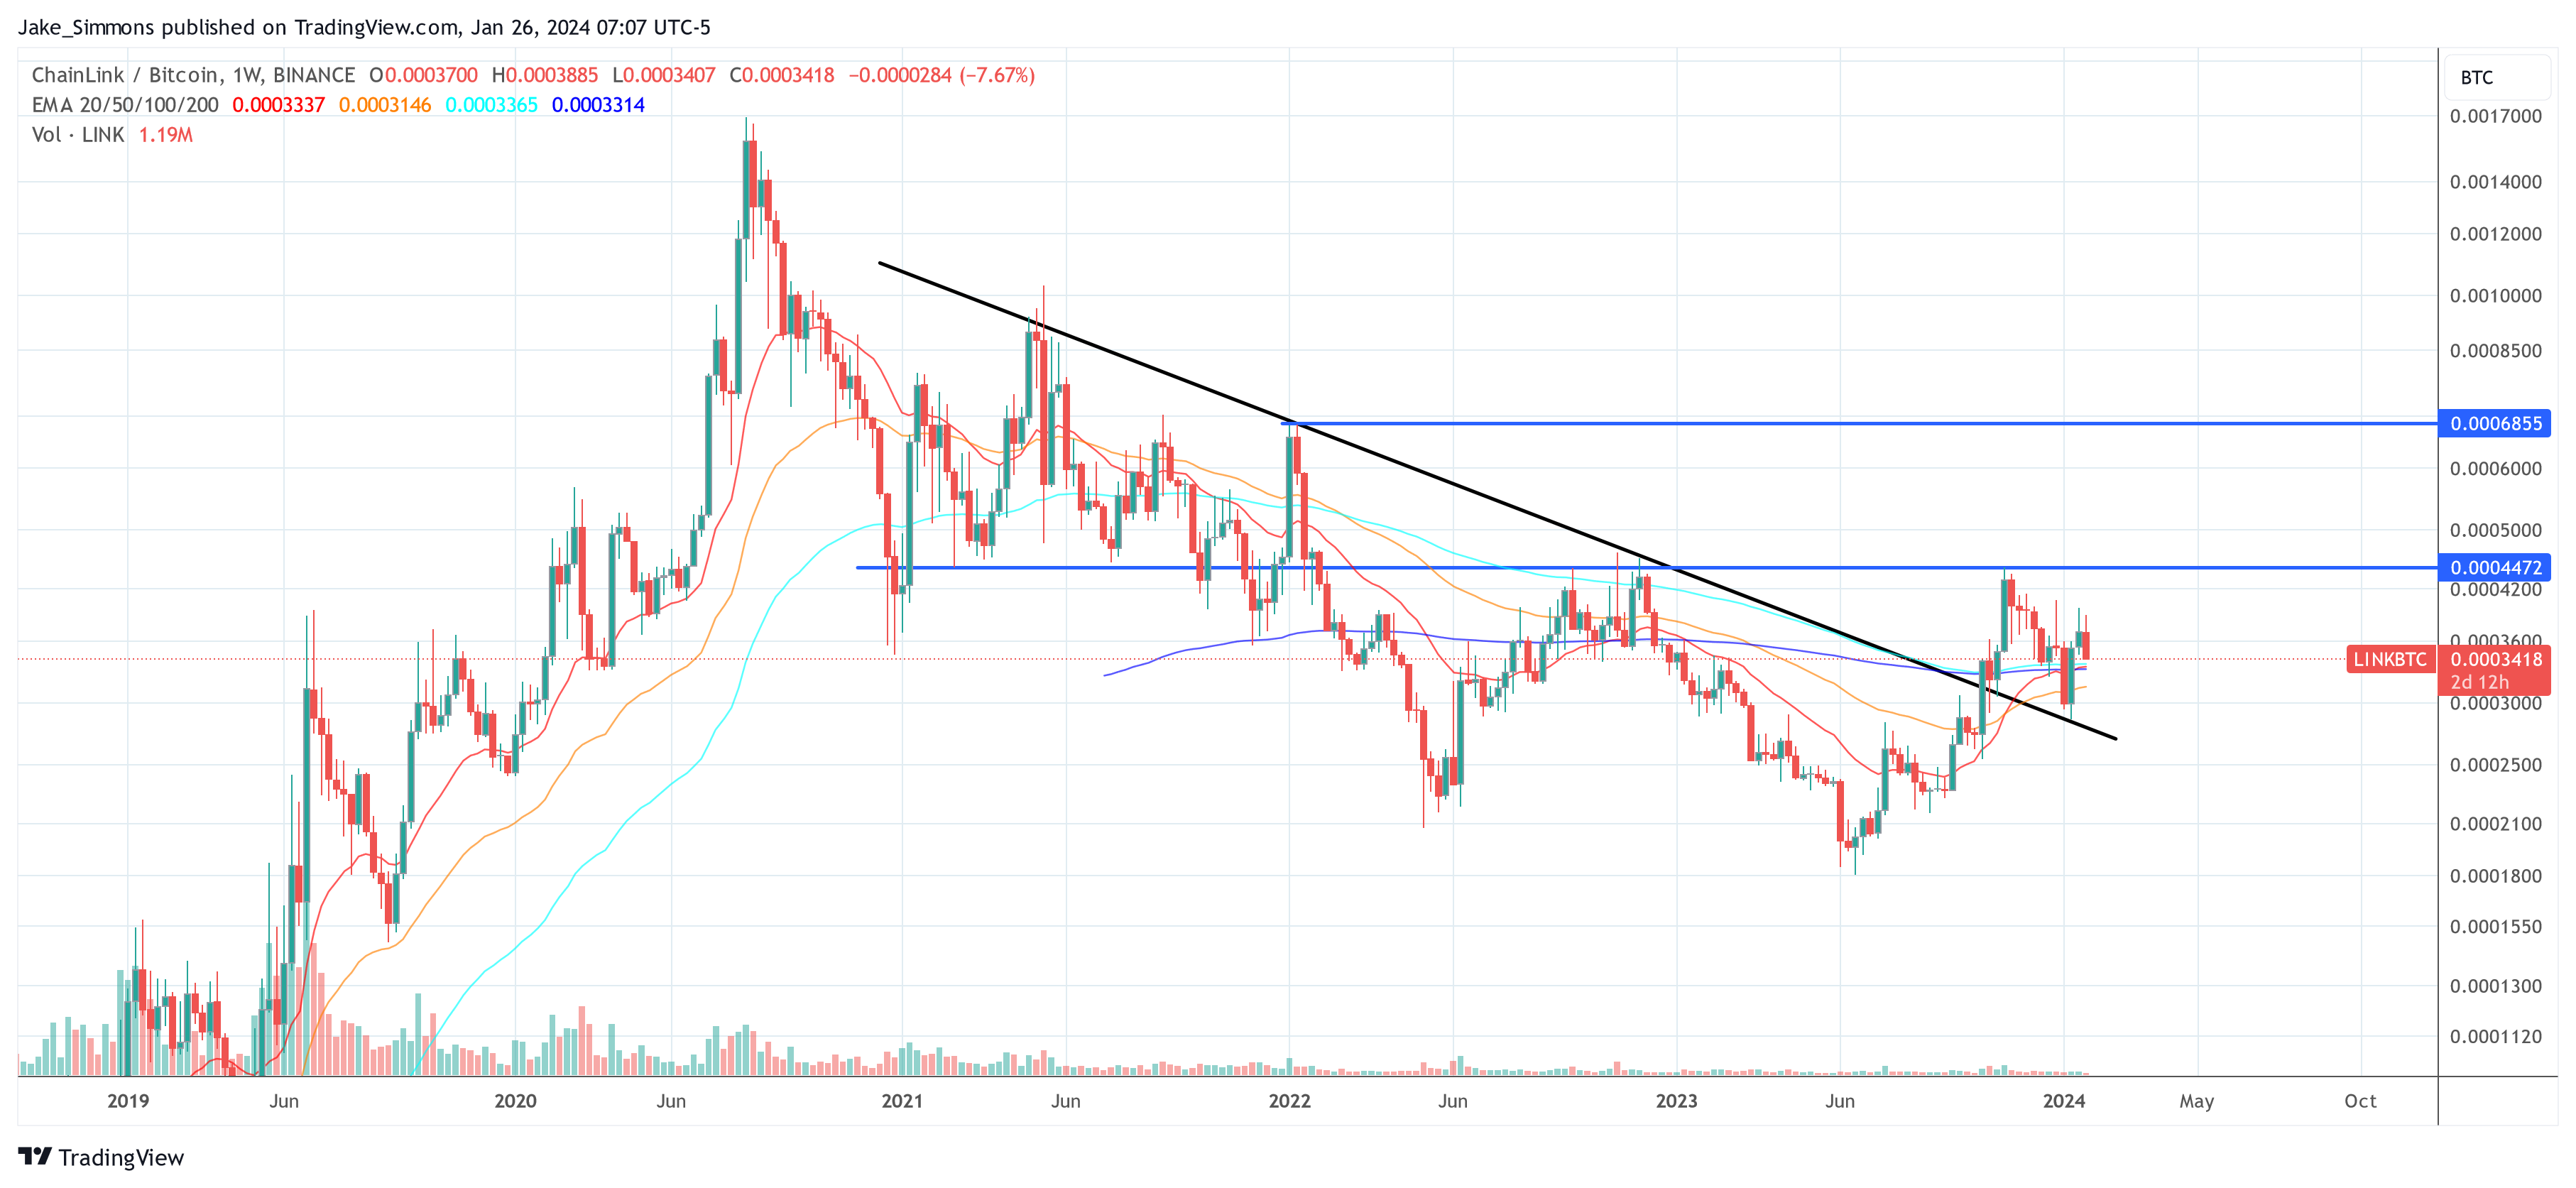
The LINK/BTC trading pair (weekly chart) is also favoring the bulls. The descending trend line, which has historically acted as a resistance since the peak in 2020, was decisively broken in October last year. This breakout is a key development, indicating a potential reversal of the downtrend that has dominated the LINK/BTC pair for a significant period.

Following the breakout, a retest of the descending trend line occurred, a move often anticipated by technical analysts. The successful retest occurred in the second week of January, when the price bounced off the trend line, reinforcing it as a new support level.

This retest is indicative of a shift in market sentiment, where former resistance levels transform into support, a classical sign of a trend reversal. A breakout above 0.0004472, and LINK could be exploding towards 0.0006875 or even 0.0009.

Chainlink price

In summary, Chainlink’s technical posture is one of cautious optimism, with a clear upward trend since November but facing immediate resistance near the $14.70 level. Market participants should watch these technical indicators closely for signs of either a continuation of the uptrend or a potential reversal if support levels falter.

Chainlink Gets Whale Backing: LINK Price Up 14% Amid Market Dip

In the midst of the recent turbulence within the cryptocurrency market, Chainlink (LINK) has emerged as a notable outlier, demonstrating resilience against the sweeping downturn that has left major altcoins crumbling.

Surprisingly, LINK has steadfastly clung to the $16 mark, showcasing a 14% rally in the last seven days and defying the prevailing market trends. However, investors are left to ponder whether this is a promising sign for Chainlink’s future or merely a momentary blip in the radar.

Massive Chainlink Whale Purchase

This positive signal coincides with a notable $8.9 million whale purchase, injecting a substantial dose of confidence into the market. Yet, beneath the surface, murmurs of a whale exodus are causing concern.

This purchase also dampens some worries especially following a recent selling spree by Chainlink investors, who offloaded a significant 2.3 million tokens since January 12th.

The positive signal also comes after recent concerns in the absence of a noteworthy uptick in fundamental growth metrics such as network usage. Without substantial real-world adoption, the coveted $20 price point for Chainlink might remain an elusive mirage.

Chainlink’s Strengths Persist Amid Market Uncertainty

Meanwhile, IntoTheBlock’s global in/out of the money (GIOM) chart uses the historical entry prices of the current LINK holders to highlight critical levels of support and resistance.

In the near term, investors may opt for short-covering maneuvers to prevent falling into a net-loss position, a strategy that could lead to the consolidation of Chainlink’s (LINK) price just below the $15 threshold in the upcoming days.

Conversely, bullish market participants could potentially counter this bearish scenario by successfully pushing the price beyond the $20 territory. However, a potential hurdle arises from the fact that over 94,000 holders have accumulated 51 million LINK at a minimum price of $18.8.

This sizable accumulation suggests the possibility of bears establishing a formidable sell-wall in that price range, potentially triggering a retreat in LINK’s value.

The interplay of these dynamics underscores the delicate balance between short-term tactical moves and broader market sentiment that currently characterizes the trajectory of Chainlink’s price.

Despite the prevailing turbulence, the core strengths of Chainlink should not be overlooked. Its established role as a leading oracle provider within the blockchain ecosystem remains undiminished.

If the broader crypto market stages a recovery and fundamental growth aligns, a resurgence for Chainlink is not out of the realm of possibility.

Featured image from Freepik

Chainlink (LINK) Breakout: Accumulation Zone Points To Upside Potential, $20 In Sight

The decentralized Oracle network Chainlink and its native token LINK have grown impressively in the past month. Despite experiencing a correction since late December, where LINK reached a 20-month high of $17.6, the token has shown signs of renewed bullish momentum. 

Key Resistance Levels For LINK’s Price Rally

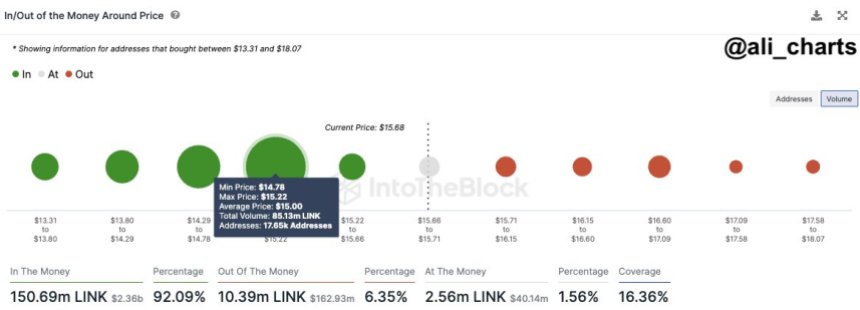
Renowned crypto analyst Ali Martinez has identified a robust demand zone for Chainlink between $14.8 and $15.2, slightly below its current trading price of $15.415. 

Within this range, many addresses (17,650) purchased 85.12 million LINK. With limited resistance, LINK appears to be well-positioned to advance towards the $20 mark.

Chainlink

Based on the analyst’s observations, if the current bullish momentum witnessed over the past seven days persists, LINK could swiftly reach the $20 price level. Looking at LINK’s 1-day chart, the next resistance levels to overcome before potentially climbing toward $20 are $15.55, $16.69, and $16.92. Breaching these levels would pave the way for a clear path towards the $20 milestone.

However, it is important to note that in the absence of major resistance walls, the battle for the next direction of LINK’s movements remains equally balanced. In the event of another price correction or selling pressure, the token lacks significant support walls to rely on.

Chainlink

Analyzing LINK’s 1-day chart, the first support level in the event of a drop would be around $14.22. If this level is breached, the next support stands at $13.31. A further decline could test the support at the $11 price level. A breach of this level could signify a breakdown in the four-month bullish structure of LINK.

Chainlink Ecosystem Growth

Despite the battle for supremacy between LINK’s bulls and bears, the protocol’s ecosystem has shown notable growth in key metrics since the last update. For example, Chainlink’s circulating market capitalization is $8.35 billion, reflecting a positive growth rate of 3.58%.

According to Token Terminal data, in terms of revenue over the past 30 days, Chainlink has generated $11.67 thousand. However, this figure shows a decline of 54.16% compared to the previous period, indicating a decrease in earnings during this timeframe.

Considering the fully diluted market capitalization, which considers the maximum number of Chainlink tokens that could exist in the future, the value stands at $14.82 billion. This metric has experienced a slight increase of 3.48% recently.

When it comes to revenue on an annual basis, Chainlink has generated $219.81 thousand. This represents a positive growth rate of 2.64%, indicating an upward trend in the company’s earnings over a year.

Regarding financial ratios, Chainlink’s price-to-fully-diluted ratio is calculated at an astonishing 68,246.47x. This metric compares the company’s market capitalization to its fully diluted market capitalization. It reflects the premium investors will pay for each unit of potential future tokens.

Similarly, based on the fully diluted market capitalization, the price-to-sales ratio is reported to be 68,246.47x. This ratio measures the company’s valuation relative to its annualized revenue and indicates how much investors will pay for each dollar of sales generated.

Featured image from Shutterstock, chart from TradingView.com 

LINK Price Rallies Over 5%, A New Uptrend In Making For Chainlink?

Chainlink’s LINK price is moving higher above the $15.00 resistance. The price is now up over 5% and might aim for a move toward the $18.00 resistance.

  • Chainlink price is showing positive signs above $14.50 against the US dollar.
  • The price is trading above the $15.00 level and the 100 simple moving average (4 hours).
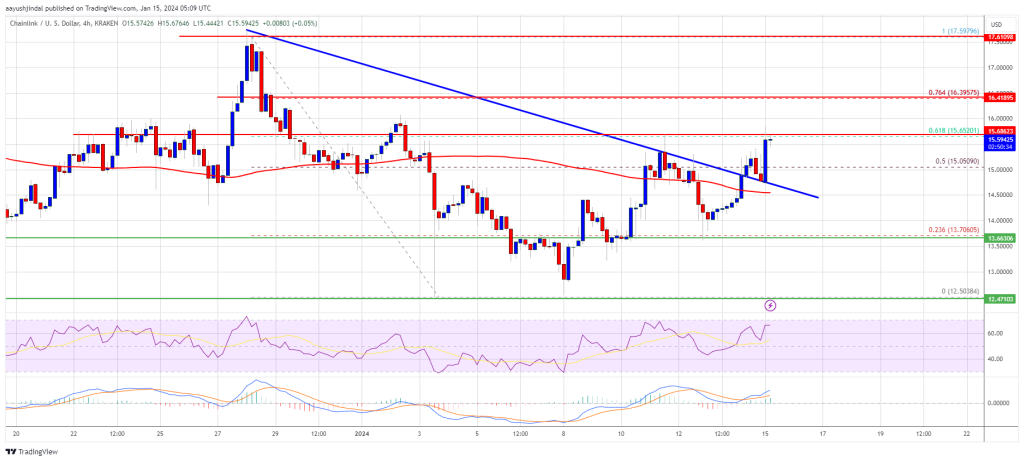
  • There was a break above a key bearish trend line with resistance near $14.85 on the 4-hour chart of the LINK/USD pair (data source from Kraken).
  • The price could rally further if it clears the $16.40 resistance zone.

Chainlink (LINK) Price Eyes More Upsides

In the past few sessions, Chainlink bulls were able to send the price above a few key hurdles at $14.50. Earlier, LINK price formed a base above the $12.50 and started a fresh increase.

There was a break above a key bearish trend line with resistance near $14.85 on the 4-hour chart of the LINK/USD pair. The bulls pumped the pair above the 50% Fib retracement level of the downward move from the $17.59 swing high to the $12.50 low.

LINK is now trading above the $15.00 level and the 100 simple moving average (4 hours). The price is up over 5% and outpacing both Bitcoin and Ethereum. If the bulls remain in action, the price could rise further. Immediate resistance is near the 61.8% Fib retracement level of the downward move from the $17.59 swing high to the $12.50 low at $15.65.

Chainlink (LINK)

Source: LINKUSD on TradingView.com

The next major resistance is near the $16.40 zone. A clear break above $16.40 may possibly start a steady increase toward the $17.50 and $18.00 levels. The next major resistance is near the $18.80 level, above which the price could test $20.00.

Are Dips Limited?

If Chainlink’s price fails to climb above the $15.65 resistance level, there could be a downside correction. Initial support on the downside is near the $14.50 level.

The next major support is near the $13.70 level, below which the price might test the $13.00 level. Any more losses could lead LINK toward the $12.50 level in the near term.

Technical Indicators

4 hours MACD – The MACD for LINK/USD is gaining momentum in the bullish zone.

4 hours RSI (Relative Strength Index) – The RSI for LINK/USD is now above the 50 level.

Major Support Levels – $15.00 and $14.50.

Major Resistance Levels – $15.65 and $16.50.

Dogecoin, Cardano, And Chainlink Get Special Listing From Binance

Binance is on the move once again with new special listings for Dogecoin, Cardano, and Chainlink, among others. The exchange has announced brand new crypto trading pairs for these cryptocurrencies which would bring advantages to traders.

Binance Adds New Dogecoin, Cardano, And Chainlink Pairs

In a new development that was revealed on Christmas Day, the Binance crypto exchange has expanded its list of pairs available for both Cross Margin and Isolated Margin users. The announcement revealed that it will be adding 11 new pairs across these two products.

The new pairs are mainly denominated in the FDUSD pair, a stablecoin that the exchange adopted after Paxos was ordered to stop issuing BUSD tokens. The new pairs in the Cross Margin feature include “ ADA/FDUSD, AEUR/USDT, AVAX/FDUSD, DIA/USDT, DOGE/FDUSD, IOTX/ETH, LINK/FDUSD, MATIC/FDUSD, OM/USDT, POLS/USDT.” Meanwhile, only a single new pair was added to the Isolated Margin feature which is IOTX/ETH.

Binance’s move to add new trading pairs across these products shows a move toward providing further liquidity for traders. “Binance Margin strives to enhance user trading experience by continuously reviewing and expanding the list of trading choices offered on the platform, allowing for greater diversification of user portfolios and flexibility with trading strategies,” the crypto exchange said in the announcement.

The move comes only two days after the exchange had announced the removal of multiple spot trading pairs which affected the likes of Dogecoin, Cardano, and Solana, among others. There were no specific reasons for the removal, although the exchange explained that trading pairs can be delisted due to multiple factors.

Dogecoin price chart from Tradingview.com (Crypto Binance Cardano Chainlink)

Crypto Exchanges Cleaning Up Shop

In the last week, there have been multiple instances of crypto exchanges delisting cryptocurrency pairs from their platform. The most prominent delistings for the week came from the Uphold exchange which delisted a number of cryptocurrencies in an effort to keep up with Canadian regulations.

As Bitcoinist reported, Uphold emailed its customers in the region to reveal that it will be desolating 10 Tier 3 cryptocurrencies from the exchange. Those mentioned in the email included Dogecoin (DOGE), Cardano (ADA), Shiba Inu (SHIB), XDC Network (XDC), Kaspa (KAS), Hedera (HBAR), Stellar (XLM), VeChain (VET), Injective (INJ), and Casper (CSPR). Additionally, the crypto exchange revealed it will be delisting all Tier 4 cryptocurrencies as well.

However, unlike Binance’s delisting which only affected some pairs of different cryptocurrencies, Uphold’s move is a total delisting. “Maintaining a healthy ecosystem of digital assets for our customers is one of our top priorities – occasionally delisting assets forms part of this process,” the exchange said.

Is Chainlink and Polygon About to Rip Higher? Whales Accumulating

According to Lookonchain data on December 20, whales are actively accumulating Chainlink (LINK) and Polygon (MATIC) and moving them from Binance, one of the world’s largest cryptocurrency exchanges by trading volume. 

Citing on-chain transfers, Lookonchain notes that LINK is specifically seeing significant accumulation from a fresh wallet labeled “0x8eAD,” which has withdrawn 247,860 LINK worth approximately $3.5 million from Binance in the past two days.

Meanwhile, two new wallets, “0xa813” and “0x38b3”, have been actively accumulating MATIC, withdrawing 5 million MATIC worth around $3.13 million from Binance earlier today.

Chainlink whale moves coins | Source: Lookonchain via X

Whales Accumulating, Will MATIC And LINK Rally?

The fact that whales, individuals, or entities controlling large amounts of a particular token or coin are circling MATIC and LINK is net bullish and might support prices in the coming sessions. 

Notably, the transfer is considered bullish when whales move coins from exchanges to non-custodial wallets like hardware wallets or even hot wallets to engage in decentralized finance (DeFi), degen trading, or NFT trading. 

This shift is because, unlike in centralized exchanges like Binance, where their intention is usually trading for other coins or USDT, in on-chain apps, they can use the same stash to earn rewards, for instance, by providing liquidity or staking. 

Therefore, considering the recent transfer, LINK and MATIC prices might recover, increasing in the coming few trading sessions. Thus far, looking at candlestick formations in the daily chart, LINK is stable and remains within an uptrend. Notably, prices are trading above the 20-day moving average, suggesting that the coin found support. LINK is currently up 155% from September lows but down 15% from November peaks. 

Chainlink price trending upward on the daily chart | Source: LINKUSDT on Binance, TradingView

On the other hand, MATIC is also stable and rejects attempts for lower lows. After days of consolidation, the coin has support at around $0.70, matching a critical level recorded in November. 

Still, whether the uptrend will resume depends on whether prices will float higher, breaking above $0.93 or November 2023 highs in the coming session. 

Technically, $0.95 marks a critical reaction level for MATIC that, if comprehensively broken, could open the doors for $1.20 and $1.60 in the coming sessions.

Polygon And Chainlink Roll-Out Critical Features

Beyond current technical formations, fundamental events prop up Polygon and Chainlink bulls, especially around decentralized finance (DeFi) and layer-2 scaling. 

Chainlink’s new staking upgrade aims to mop more LINK from circulation, possibly increasing prices on rising demand for Cross-Chain Interoperability Protocol (CCIP). 

Meanwhile, as other blockchains repurpose to become Ethereum layer-2, Polygon CDK is becoming a critical cog in fast-tracking the process, directly supporting MATIC prices.

Crypto’s Silver Lining: Market Dips Are Stepping Stones To Soaring Heights – Analyst

Crypto Rand, a renowned crypto trader, has shared insights on the current market corrections, emphasizing the necessity of these corrections for sustainable market ‘growth.’

The trader, who disseminates his views on X, stresses that despite the evident pullbacks, the crypto market’s macrostructure remains “intact.”

This perspective comes at a time when most crypto assets, including Bitcoin, have experienced significant price drops over the past couple of days.

Navigating Resistance Levels: The Path To Growth

Crypto Rand’s leveraged the price action index of various cryptocurrencies, such as Cosmos (ATOM), Chainlink (LINK), NEAR Protocol (NEAR), Algorand (ALGO), and MultiversX (EGLD), among others to highlight his point.

Rand identifies multiple resistance levels in these assets’ trajectories, suggesting these as potential points for market turnaround. These resistance levels are categorized as major or minor, depending on the frequency and intensity of price actions historically observed at these points.

Despite the temporary pullbacks that these resistance levels might introduce, Crypto Rand views them as necessary pauses that allow the market to gather strength for future upward movements.

This perspective is particularly relevant in light of Bitcoin’s recent price behavior. The flagship cryptocurrency has seen a notable dip from its recent high of $44,000, currently trading just below $42,000.

Bitcoin (BTC) price chart on TradingView amid crypto market news

This downward trend has echoed across the crypto market, impacting other major assets like Ethereum including altcoins Rand mentioned like Chainlink, and Algorand.

Over the past 7 days, BTC and ETH have experienced declines of 4.4% and 2%, respectively. Meanwhile, Chainlink has seen a 6.9% drop during the same period, and Algorand has fallen by 4.1% in just the past 24 hours.

The Broader Perspective On Crypto Market Corrections

The sentiment that market corrections are a healthy and necessary aspect of growth is not exclusive to Crypto Rand. William Clemente, the co-founder of Reflexivity Research, echoes this viewpoint.

Clemente posits that the current market retraction, which could potentially bring Bitcoin’s price closer to $40,000, should “not be a cause for alarm.”

Clemente argues that this process is crucial for eliminating weaker market participants and reducing excess leverage, ultimately establishing a firmer foundation for future upward trends.

Clemente further articulates that the inherent volatility of Bitcoin should be perceived as “a feature, not a bug”. It is worth noting that this stance reinforces the notion that the crypto market is still evolving and that such fluctuations are part and parcel of its journey towards maturity.

Featured image from iStock, Chart from TradingView