Bitcoin Analyst Reveals Why $57,938 Is The Level To Watch This Week

Crypto analyst CryptoCon has revealed a key level to watch out for as Bitcoin attempts to break critical resistance levels. The analyst suggested that a drop to this price level may not be bad for Bitcoin and could instead be necessary for it to finally make that price rally. 

$57,938 Is The Price Level To Keep An Eye On

CryptoCon mentioned in an X (formerly Twitter) post that $57,938 is the “new price to watch for the 20-week EMA (Exponential Moving Average).” He noted that such a price drop might be necessary, stating that “boredom and sideways price action allow room for growth.” Based on his analysis, any potential price decline that Bitcoin experiences is a healthy correction and shouldn’t be considered a bearish reversal. 

Bitcoin 1

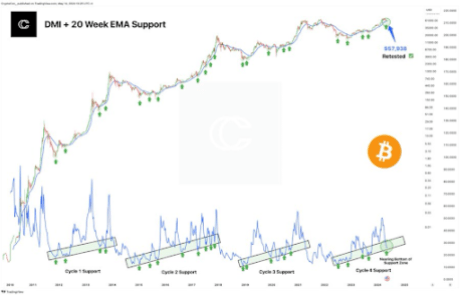
Meanwhile, Bitcoin is showing impressive strength on the charts, with CryptoCon stating that the flagship crypto “continues to hold the 20-week EMA as support while visiting the almost absolute bottom of the cycle 4 DMI support zone.” CryptoCon’s positive outlook for Bitcoin provides assurance that a parabolic move is still on the horizon. 

Crypto analyst Rekt Capital also recently shared a positive outlook for Bitcoin. He revealed that Bitcoin was out of the “Danger Zone,” suggesting that the flagship crypto was primed for a move to the upside. The analyst also remarked that Bitcoin was running out of unremarkable months before it began its parabolic phase. 

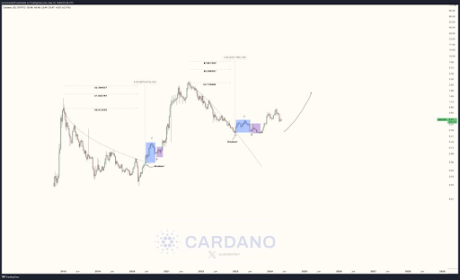
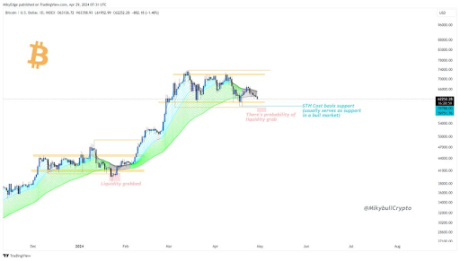
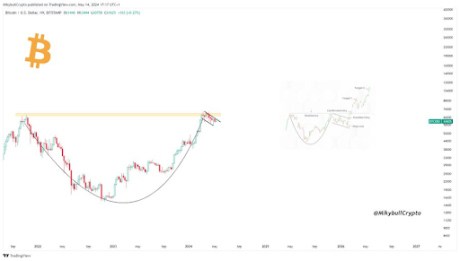
Crypto analyst Mikybull Crypto hinted that Bitcoin was already showing signs of this imminent parabolic phase. In an X post, he mentioned that Bitcoin was displaying a cup and handle reversal pattern on the weekly chart and that the “breakout will be explosive and will send it to a cycle top.”

Bitcoin 2

While agreeing with Mikybull Crypto’s analysis, Crypto analyst BitQuant mentioned that $95,000 will be “achieved in one move, and that is quite obvious.” He, however, noted that it remains uncertain when this move will happen and called for patience as everyone waits for Bitcoin “to perform as expected.”

BitQuant further advised that it might be better to leave the market for those who can’t “avoid the torture,” claiming that there “will be a lot of pain for those with weak nerves” in the coming months. Based on Arthur Hayes’s prediction, investors might have to wait until August for that big move from the flagship crypto. 

Bitcoin Is Still Far From Its Market Top

In a recent X post, Rekt Capital suggested that Bitcoin was still far from its market top. He highlighted past cycles, which show that the bull market peak usually occurs between 518 and 546 days after the halving. Based on this, the analyst predicts that the flagship crypto will likely peak in September or October 2025. 

Bitcoin 3

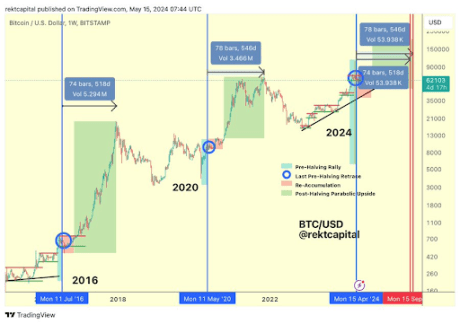
The crypto analyst also acknowledged that Bitcoin has been accelerating in this cycle by over 200 days. However, he remarked that Bitcoin could resynchronize with past halving cycles if it continues to consolidate for longer. 

Bitcoin price chart from Tradingview.com

Shiba Inu Volume Flips Dogecoin, Will SHIB Price Flip DOGE If This Analyst’s Prediction Comes True?

Shiba Inu is up by 7% in the past 24 hours amidst an uptick in the meme coin market, coming ahead of Dogecoin at this time. The meme coin niche has witnessed a strong resurgence in the past day, with the entire niche up by 7.82%. Shiba Inu has particularly done well and witnessed a strong volume of interest amidst this uptick. Interestingly, this uptick in volume for SHIB has surpassed DOGE, with on-chain data suggesting SHIB could do better in the short term. At the same time, crypto analyst Ali Martinez has revealed a phenomenon that could lead to a 20% upswing for SHIB.

Shiba Inu Volume Flips Dogecoin

Data from Coinmarketcap shows that Shiba Inu has witnessed a trading volume increase of 320% in the past 24 hours. The metric, on Dogecoin’s side, was an increase of 160%. The crypto, which has been trading inside a descending channel for a while, is now appearing to make a push above. 

Related Reading: Analyst Who Predicted Solana’s 1,100% Move Reveals Where The Altcoin Is Headed Next

Although current data from analytics platform IntoTheBlock (ITB) suggests DOGE is still holding on for a longer-term overperformance over SHIB, SHIB is starting to position itself to outperform DOGE in the short term on a cost basis. According to ITB’s holding by time metric, DOGE has seen a 1.86% increase in the number of holders in the past 30 days, compared to a 0.43% increase for SHIB. ITB terms holders as passive investors that have held the asset for more than one year. 

However, the number of cruisers (investors holding between 1 to 12 months) flips the short-term interest in the favor of SHIB. As of this writing, SHIB’s cruisers have increased by +5.69% in a 30-day timeframe. The metric, on DOGE’s side, shows a 2.44% decrease.

Shiba inu

SHIB To Breakout Of Parallel Channel

The recent increase in volume and short-term activity suggests that SHIB is ready to break out of a descending parallel channel of lower highs. As pointed out on social media by crypto analyst Ali Martinez, SHIB has been trading in a descending parallel channel since the last week of April. Current price action shows SHIB is now at the upper end of the descending and is at a critical junction for a breakout or reversal. 

Related Reading: Analyst Points Out Level To Beat If Bitcoin Is To Reach $76,000

According to the analyst, a breakout from this channel at $0.00002444 could lead to another 20% upswing to $0.00002954. The price target serves as the highest point of the descending channel under consideration. A further surge could see SHIB returning back to the $0.00003 price territory. 

At the time of writing, SHIB is trading at $0.0000236. Failure to break above $0.00002444 could send the cryptocurrency back down as far as $0.0000211.

Shiba Inu price chart from Tradingview.com (Dogecoin)

Are We Out Of The Woods? Analyst Bullish On Bitcoin’s 6-Figure Future

Bitcoin (BTC) began the month with the deepest retrace of the cycle, falling to the $56,000 support level. The retrace raised alarms for some crypto investors and market watchers, who feared the bull run had ended.

Since then, the largest cryptocurrency by market capitalization has recovered crucial levels, and analysts have identified bullish patterns on BTC’s chart, suggesting that it might finally be out of the woods.

Is Bitcoin Out Of Danger?

As the May 1st retrace developed, crypto analyst Rekt Capital highlighted the similarities between Bitcoin’s 2016 and 2024 post-halving performances. He suggested that the flagship cryptocurrency’s price development came “as no surprise,” as it was mirroring the “post-Halving Bitcoin Danger Zone” of 2016.

Per the analyst, the “Danger Zone” is officially over, which BTC is “celebrating with a good bounce from the Re-Accumulation Range Low support.” He stated that May could be an “unremarkable” month for the largest cryptocurrency, potentially continuing next month. However, Bitcoin is “running out of unremarkable months” before the beginning of this cycle’s “Parabolic Phase.”

Additionally, Rekt Capital considers that BTC’s sell-side momentum is starting to show signs of slowing down, “slowly developing a curl against the $60,000 support.” Per the post, Bitcoin must continue to hold this support zone for the curl to “progress and eventually lift up.”

bitcoin

Similarly, analyst Bluntz identified a bullish engulfing pattern on Thursday, considering there would be “a solid engulfing on the daily close.” To the analyst, it appeared that the “next push-up into ATH has started.”

This morning, Bluntz confirmed the pattern formation and announced to his followers that this cycle’s Round 2 began, which would lead to a “fresh ATH.”

BTC’s Strength Could Lead The Price To 6-Figures

Following the bullish analysis, CryptoJelle stated that BTC “is looking good.” Per his post, the cryptocurrency “has nearly completed a full reset,” as it’s back to the 100-day Exponential Moving Average (EMA).

Additionally, the chart displays a “bullish MACD cross” below the zero line and the “first higher low in a long time,” suggesting a positive divergence.

Jelle highlights that BTC’s price is again pushing into the trendline that “has pushed prices lower over the past weeks.” Despite the higher low, he points out the necessity of reclaiming the $63,000 support zone before new highs come.

For these new highs, he set an $82,000 target for BTC’s price, suggesting that a 6-figure price for the flagship cryptocurrency is possible during this cycle.

The analyst emphasizes Bitcoin’s performance this cycle, stating that the community has under-appreciated its strength during this bull run. He considers that the run is not over, as the “Halving” event occurred just a few weeks ago, and BTC’s price has been consolidating around the previous cycle’s all-time high for a long period.

On Monday, Bitcoin surged to $63,000 after hovering between $60,000 and $61,000 for the past few days. Despite its recent performance showing short-term red numbers, BTC’s price still registered a 25.7% and 76.5% increase in the three-month and six-month periods, respectively.

At the time of writing, BTC is trading at $62,752, a 3% increase in the past 24 hours.

BTC, BTCUSDT, Bitcoin

Gaming The System: Pundit Reveals Why XRP Price Will Reach $33

A crypto analyst has predicted a substantial bullish surge for the the XRP price in the future. According to the analyst, XRP is gearing up for a substantial increase to $33.5 from an initial price of $0.50. He expects the price of the cryptocurrency to explode by 6600% in this current market cycle.

Analyst Forecasts Exponential Rise In XRP Price

In a recent X (formerly Twitter) post, a crypto analyst identified as ‘Egrag Crypto,’ revealed a series of bullish price targets for XRP in the near future. The analyst focused his predictions on a technical analysis called “the Line of Hestia.” 

Related Reading: US Mega Banks JP Morgan And Wells Fargo Unveil Bitcoin Exposure As BTC Drops To $60,000

Egrag Crypto’s latest findings suggest that XRP could rise to $33.5 if it touches the Line of Hestia, a technical indicator featuring an ascending trend line which signals a potential upsurge for the price of a cryptocurrency. According to the analyst, “Historical data indicates that every time the XRP price touches the “Line of Hestia,” it experiences significant price pumps.” 

This implies that there may be a correlation between XRP’s bullish price movements and the ascending trend line. Egrag Crypto also revealed that following this historical pattern, XRP has witnessed pumps ranging from 6600%,1444%, 100%, 80%, and 171%. 

Given the established trend, Egrag Crypto predicts XRP’s ascent to new all-time highs. He calculated the average percentage increase of XRP’s price each time it touched the Line of Hestia, dividing the sum by the total number of occurrences, which is five. 

Using this data, the crypto analyst estimates that if XRP were to experience a 6600% increase, its future price would be $33.50. Similarly, he calculated new prices for XRP based on the previous percentages.

It’s important to note that the price of XRP, at the time of writing, is trading at $0.5. The cryptocurrency has been recording considerable declines over the past year, consolidating around the $0.5 price mark for months. According to CoinMarketCap, XRP has also recorded a 7.35% decrease over the past seven days and a 0.08% decline in the last 24 hours. 

Although Egrag Crypto has remained optimistic about XRP’s future price, other crypto community members have expressed skepticism over the analyst’s ambitious forecast. A few community members have denied the prediction, emphasizing that the cryptocurrency’s surge to $33.5 during this cycle was highly unlikely. 

Possible Price Correction Ahead Of Projected Surge

In one of his most recent X posts, Egrag Crypto disclosed that XRP could witness a major price correction before experiencing a significant rally. The analyst has urged crypto investors to remain cautious of the cryptocurrency unless the XRP/BTC ratio closes above the $0.00010 threshold. 

Related Reading: Is The Bitcoin Bottom In? Buy The Dip Sentiment Erodes Amid Drop Toward $60,000

Egrag Crypto anticipates a potential 45% decline for XRP/BTC, emphasizing that this substantial price drop could indicate a bottom between $0.0000055 and $0.0000077. However, he also disclosed that overcoming resistance at $0.00001 would be crucial for a rebound in XRP.  

XRP price chart from Tradingview.com

Analyst Who Predicted Solana’s 1,100% Move Reveals Where The Altcoin Is Headed Next

Crypto analyst Javon Marks has provided insights into the future trajectory of Solana (SOL) after it hit a 1,100% return. The analyst is known to have called the crypto token’s previous high correctly, which is one reason his latest prediction is worth keeping an eye on.  

Solana Could Rise To As High As $453

Marks mentioned in an X (formerly Twitter) post that despite its recent pullback, Solana’s price may be getting ready for another price rally. He noted that a move of over 54% may already be in the pipeline and that such a price move could open up room for another run of over 93%, which would send Solana to $453. 

Related Reading: Cardano Ready For 15x Move, Crypto Analyst Reveals The Major Drivers

Solana

Marks predicted last year that Solana would climb above $200, which it eventually did this year, peaking at a year-to-date (YTD) high of $202. Although the crypto token has dropped significantly from that price level, Marks’ recent prediction confirms that Solana’s run isn’t done yet and will still surpass its current all-time high (ATH) of $260.

Solana rising to $453 looks more feasible considering that crypto analysts like Altcoin Sherpa have predicted that the crypto token could rise above $500 by year-end. Crypto analyst Hansolar also predicted that Solana could climb to $600 in this market cycle. Meanwhile, Crypto YouTuber Jake Gagain predicted that Solana will rise to $750, although he mentioned that it will likely happen in 2025. 

SOL Could Become The Third-Largest Crypto Token

Solana’s rise to as high as $500 could lead to the crypto token becoming the third largest crypto asset by market cap, only behind Bitcoin and Ethereum. This is possible, as a rise to $500 is almost double Solana’s current ATH. Crypto analyst Chris O also previously predicted that this would likely happen as he predicted Solana and ADA would battle for the position. 

Meanwhile, asset manager Franklin Templeton also sounded confident in Solana’s potential to become the third-largest cryptocurrency. In a recent analysis, the asset manager highlighted the factors that could lead to this development. One is Solana’s technology, which they think will be perfect for the sectors that will drive the next wave of crypto adoption. 

Franklin Templeton also alluded to the upcoming airdrops on the Solana network, which could bring more liquidity into the ecosystem and possibly cause a surge in Solana’s price, just like when the Jito and Pyth airdrops occurred. The asset manager also noted that meme coin activity on the network isn’t slowing, which could contribute to Solana’s rise to becoming the third-largest cryptocurrency. 

Solana has become the foremost network for trading meme coins, which has led to an influx of new investors into the ecosystem. Therefore, a sustained network expansion will likely reflect positively on Solana’s price sooner or later. 

At the time of writing, Solana is trading at around $144, up in the last 24 hours, according to data from CoinMarketCap. 

Solana price chart from Tradingview.com

Theta Network Breakout Imminent: Why A 100% Rise Is Possible From Here

While the focus has mainly been on Bitcoin and Ethereum through the downtrend, other smaller altcoins such as Theta Network with much more potential have been flying under the radar. However, crypto investors are no longer ignoring these altcoins and have begun to call out the opportunities in these cryptocurrencies.

Theta Network Is Looking At A Breakout

Crypto analyst CobraVanguard has called out an interesting formation in the THETA chart that suggests that a massive breakout might be on the horizon. In the analysis which was posted on the TradingView website, the analyst points out that a bull flag is currently being formed.

This bull flag pattern started with the most recent decline below the $2 price level after a period of brief dips and recoveries. Interestingly, since this bull flag pattern is still only forming, it does not mean that the breakout will happen immediately.

CobraVanguard’s chart shows that there will be more uncertain movements in the THETA price, coupled with the possibility of the price actually falling below $1.9. At the same time, the crypto analyst points out that the price is currently bouncing from the middle line around $1.99.

Theta Network price chart from Tradingview.com

However, once the formation is complete, then the breakout can happen. The upper end of the target presented by CobraVanguard shows that the THETA price can rise as high as $3.7. This would mean an almost 100% increase in price from its current level.

Holding Up Well Amid Uncertainty

2024 has been a rather eventful year for Theta Network. The network’s native token, THETA, had begun the year trending below $1. However, within the month of March alone, it saw an over 250% increase, going from $1.1 to over $3.7 before correcting back downward.

Since then, the THETA price has lost around 40% of its value. But this is only due to the negative headwinds that can be attributed to the decline in the Bitcoin price. The altcoin has moved upward in the market since then, rising over a $2 billion market cap to become the 51st-largest cryptocurrency in the space.

Amid the broader market downturn, THETA is still seeing positive metrics, especially when it comes to its volume. According to data from CoinMarketCap, the daily trading volume of the altcoin has jumped 13% in the last day alone, suggesting that interest is returning to the cryptocurrency.

At the time of writing, the THETA price is seeing small daily gains of 1.47% to trade at $2.02. However, on the weekly and monthly timeframes, the altcoin has performed poorly, dropping 13.73% and 12.97%, respectively.

Theta Network price chart from Tradingview.com

Analyst Points Out Level To Beat If Bitcoin Is To Reach $76,000

Crypto analyst Ali Martinez has highlighted what needs to happen for Bitcoin to climb to $76,000. If that doesn’t happen, he noted that the flagship crypto risks dropping significantly to levels not seen since the start of the year. 

How Bitcoin Could Rise To $76,000

Martinez mentioned in an X (formerly Twitter) post that Bitcoin will likely rise to $76,610 if it can reclaim $64,290 as support. However, if it fails to climb above $64,290, the crypto analyst added that Bitcoin might retest support at $51,970. Martinez drew this conclusion based on MVRV (Market Value To Realized Value) extreme deviation pricing bands, which showed $51,970 as the all-time mean. 

Bitcoin has recently maintained a tepid price movement and isn’t showing any sign that it can reclaim $64,290 as support for now. Instead, the flagship crypto looks likelier to retest the $51,970 price level, seeing as it is looking to break down below $60,000. However, despite Bitcoin looking to have a bearish outlook, crypto analyst Mikybull Crypto maintains that Bitcoin’s price action is bearish. 

In an X (formerly Twitter) post, he mentioned that BTC is having a “simple retest to weary the impatient trader.” “Nothing bearish as bears seem to amplify it,” he added. The analyst had previously predicted that Bitcoin could climb to $73,000 once it clears the $67,000 price level. 

BTC May Soon Resume Its Upward Trajectory

Meanwhile, crypto analyst Rekt Capital suggested that Bitcoin may soon be out of the clear, revealing that the Post-halving “Danger Zone” officially ends on May 13. The analyst had previously explained that this Danger Zone is the downside wick that Bitcoin experienced approximately 21 days after the Halving in 2016. 

In another X post, the analyst revealed that Bitcoin had repeated the “2016 history perfectly, offering a downside wick below the bottom of its current Re-Accumulation range within a three-week window after the halving.” Therefore, with this retracement out of the way, the flagship crypto looks primed for an upward trend. 

However, this move might not happen so soon since Rekt Capital mentioned the Reaccumulation period, which usually occurs after the Bitcoin halving. The crypto analyst noted that this period usually lasts up to five months. He added that this time could be different since this re-accumulation would develop around a new all-time high (ATH) area. 

While it is uncertain when this price rally might come, Rekt Capital suggested that Bitcoin might not drop below the $60,000 price level again. He claimed that a weekly close above $60,600 for Bitcoin “would continue to solidify this price level as a base of the Re-Accumulation Range. 

At the time of writing, BTC is trading at around $61,100, up in the last 24 hours, according to data from CoinMarketCap. 

Bitcoin price chart from Tradingview.com

Cardano Ready For 15x Move, Crypto Analyst Reveals The Major Drivers

Cardano (ADA) looks primed to make that move to the upside, with crypto analyst Javon Marks revealing what could make the crypto token see a 15x increase in its price. Marks’ analysis comes amidst recent price predictions, which paint a bullish outlook for Cardano. 

How Cardano Could See A 15x Increase In Its Price

Marks mentioned in an X (formerly Twitter) post that ADA has shown “major progress since breaking the resisting trend.” The crypto analyst also noted that the crypto token attempted to move over 200% toward the first target at $2.77709 and claimed that the recent pullback Cardano faced could strengthen it to achieve an even more parabolic rise.  

Cardano

This development is why Marks believes Cardano could rise to as high as $7.80 from its current price, representing a 1,500% increase for the crypto token. A rise to that level looks more feasible, considering that crypto analyst Altcoin Daily also recently predicted that Cardano will rise to $9 in this bull run.

Meanwhile, crypto analyst Ali Martinez made an ultra-bullish case for Cardano, noting that the crypto token was currently mirroring its price action from 2019, when it made a price gain of over 4,000%. While Martinez acknowledged that history might not repeat itself, he suggested that Cardano could still make an impressive move similar to 2019. 

For Cardano to experience such parabolic moves, the crypto token needs to see a reversal in its current downtrend. Crypto analyst Trend Rider hinted that could happen soon, noting that ADA was still holding its support level. According to him, if Cardano can hold on to this support for 1 to 2 weeks, the bears will tire, and the crypto token will bounce from its current price level. 

Analyzing Cardano’s Bull Run

Dan Gambardello, the founder of Crypto Capital Venture, again suggested that Cardano’s price action in this bull run will likely mirror Ethereum’s in the last bull run. He noted that the former is currently around the level that Ethereum was at around the 2020 Bitcoin halving. As such, he expects Cardano to enjoy a similar success to the one Ethereum enjoyed in the last bull run. 

The crypto analyst also assured that Cardano was still on track for its bull run, stating that it was also down over 90% from its all-time high (ATH) months after Bitcoin halved in the last bull run. As such, he still expects Cardano to make a run soon enough, just like it did in 2021. 

The crypto analyst hinted that Cardano’s bull run would likely begin during the Altcoin Season. However, he wasn’t sure when this Altcoin season would likely start since Bitcoin hit a new ATH before the halving (which has never happened before). He added that this Altcoin season might not come until December. For now, the analyst noted that patience is the name of the game. 

Cardano price chart from Tradingview.com (Crypto analyst)

Crypto Analyst Says XRP Price Can Break Out From Falling Pennant, But Can It Reach $1?

The XRP price, like the rest of the crypto industry, continues to struggle against the bearish winds that have taken over. This has seen its price consistently decline in spite of bulls’ best efforts to prop it up. However, it seems all hope is not lost for the altcoin as expectations are that it will recover soon enough. More specifically, crypto analyst WalterMoon is particularly bullish on the XRP price, noting that it is possible that it will break out of its current pennant.

Analyzing The XRP Price Movement

To try and pinpoint where the XRP price is headed, the crypto analyst first analyzed the movement of the altcoin over the last few weeks. This analysis showed a consistent breakout trend, albeit short-lived, that suggests that the altcoin could be getting ready to mount another one soon.

One of these breakout trends took place last month in May when the price had entered a failing channel. Eventually, the XRP price was able to muster enough momentum, even after breaking below its support line below $0.5 and then made a run for $0.52.

Again, this is seen later in the month when the price once again fell into a falling channel. This decline saw it fall below support. But like the previous time, it was able to move upward inside this falling channel and eventually broke out of the channel.

XRP price chart from Tradingview.com

This trend was recorded a number of times in the month of May, showing XRP’s strength in the market right now. However, the altcoin has fallen inside another falling channel once again, but can it maintain its breakout trend from last month?

Gathering Support Inside A Pennant

Crypto analyst WalterMoon has identified the XRP price inside a falling channel and as it continues to decline inside this pennant, the price has taken hit after hit. But given the performance from the last month, Moon believes there is still upside to come for XRP.

According to the analyst, there is a possibility that the altcoin can exit its current pennant by bouncing off the support at $0.533. In this case, it could send the price as high as $0.54, like it did the previous times. “Now, I think that Ripple can bounce up from support line to $0.5330, thereby exiting from pennant,” the analyst said.

Despite the bullish outlook, WalterMoon’s target is still conservative for all intents and purposes. The target still remains above the $0.54 level, which, unfortunately, doesn’t show much expectation for the XRP price to cross $1.

XRP price chart from Tradingview.com

Bitcoin Short Term NUPL Value Turns Negative, What This Means For Price

Crypto analyst Onchained recently provided valuable insights into an important metric that can be used to gauge the future trajectory of Bitcoin. The analyst suggested there was no cause to worry at the moment but highlighted what to watch out for to know the right time to exit the market. 

Bitcoin Short-Term Holders NUPL Turns Negative

In a blog post, the analyst noted that the NUPL (Net Unrealized Profit/Loss) for Bitcoin’s short-term holders recently turned negative. The analyst added that this signals fear among this category of investors, which is very much likely given Bitcoin’s current price action. The last time this trend occurred was shortly after the Spot Bitcoin ETFs were approved, with Bitcoin dropping from $49,000 to $38,000 following that occurrence. 

Related Reading: What Triggered The 6,350% Spike In XRP Long Liquidations Compared To Shorts?

Bitcoin

While the short-term holders’ NUPL turning red again suggests that a significant price decline may be on the horizon, the analyst remarked that this price level may simply represent a significant support line. The real cause for concern might be when the NUPL for mid-term holders also turns negative. “It could indicate widespread market fear and serve as a crucial risk management indicator for exiting the market,” the analyst claimed. 

It is worth noting that the short-term holder’s NUPL being negative means they are currently seeing an unrealized loss in their investments. This could trigger a wave of sell-offs among these investors, mainly because of fear that Bitcoin’s price could further dip. However, based on the analyst’s analysis, this might not significantly lower Bitcoin’s price. 

Instead, market speculators should be more worried about the PUNL of mid-term holders (those who have been holding Bitcoin for 3 to 6 months). The PUNL also turning negative will “suggest widespread pessimism or negative sentiment.” This could lead to massive selling pressure on Bitcoin’s price as this category of investors might also offload their holdings out of fear.  

The Worst May Already Be Over

Crypto analyst Ali Martinez had previously shared a similar analysis to Onchained’s, noting that Bitcoin short-term holder’s (STH) realized price was at $59,800. The analyst warned back then that Bitcoin dropping below this level could trigger “notable Bitcoin price corrections.” Following his prediction, Bitcoin fell below $59,800, dropping to as low as $57,000. 

Related Reading: Crypto Analyst Says Ethereum Price Will Drop To $2,500, Here’s Why

However, the flagship crypto has since then recovered nicely above $60,000. Although Bitcoin is still showing signs of a bearish outlook, its quick recovery above $60,000 suggests that the worst might be over, and all the crypto token needs right now is a catalyst to spark a continuation of its bull run. 

Arthur Hayes, BitMEX’s co-founder and former CEO, also confirmed this belief, noting that Bitcoin has already found its local bottom. However, he predicted that Bitcoin will likely have a “range-bound price action between $60,000 and $70,000 until August.”

Bitcoin price chart from Tradingview.com

Crypto Analyst Says Ethereum Price Will Drop To $2,500, Here’s Why

The Ethereum price has been closing mirroring the performance of Bitcoin recently and since the Bitcoin price has been on a downtrend, the ETH price has followed. However, Ethereum on its own seems to possess more bearish fundamentals compared to Bitcoin, leading crypto analysts to believe that the second-largest cryptocurrency by market cap will fall further from here.

Ethereum Poised To Crash Further

A crypto analyst known as Shin Forex took to the TradingView website to share an interesting analysis of the Ethereum price. The analysis, which focused on the ETH/BTC chart, unveiled some concerning developments in the ETH price.

The analyst explained that during this time, the liquidity in Ethereum has been dwindling. Instead of flowing toward altcoins like ETH, it is instead flowing toward Bitcoin. This suggests growing disinterest in Ethereum from investors and as liquidity flows to Bitcoin, Ethereum has nothing propping it up at this time.

Furthermore, the crypto analyst explains that the ETH/BTC pair has now broken below its support of 0.05. Now, this drop below its support level is important given what has happened each time that it broke. Shin Forex points back to the last two market cycles, one in 2016 and one in 2019, of the ETH/BTC breaking below its support.

Both times that this has happened, a crash in the price has followed, before it can rally again. The crypto analyst does not expect this time to be any different and believes that ETH/BTC will fall below 0.04. If this happens, it will send Ethereum spiraling and the analyst has set a price target of around $2,500 for this.

Can ETH Price Survive The Crash?

In the short term, the Ethereum price doesn’t look to good, especially as the altcoin is currently trending downward inside its current channel, according to the crypto analyst. However, zooming out to the larger timeframe can help give an inkling of how the ETH price could perform after the crash.

Looking at Shin Forex’s chart of the last two times that a formation like this occurred, it has also set a precedent for money to flow back into Ethereum. In November 2016, the price had crashed but in a few months, there was a massive recovery as ETH/BTC rose to a new all-time high.

Ethereum

A similar thing happened the next time in 2019, with the crash coming ahead of a market rally, albeit a bit slower at this time. So, if this trend holds, then the ETH crash is inevitable. However, a recovery is expected that will likely kickstart the beginning of another massive rally.

For now, bears continue to dominate the Ethereum market and have successfully dragged the price down below $3,000. It is trading at. $2,975 at the time of this writing, with a small 0.36% decline in the last day, according to Coinmarketcap.

Ethereum price chart from Tradingview.com

Cardano Entry Of A Lifetime: Analyst Predicts 5,600% Rally To $25

Cardano is currently in a downtrend, continuing to show bearish tendencies as its price trends below $0.5. However, where many have seen an altcoin that does not have many prospects, crypto analyst FieryTrading believes that the digital asset is giving investors an opportunity to get in for cheap.

Cardano Can Break Out Of Parallel Channel

In an analysis on the TradingView website, crypto analyst FieryTrading alludes to Cardano’s ability to break out and go on a massive bull run. The analysis draws from a previous analysis where the analyst had pointed out that the Cardano price had entered a parallel channel.

This parallel channel emerged with the last cycle’s top going into the current cycle top with a line drawn from the last cycle’s bottom when the lockdown had sent crypto prices crashing. Despite the crypto analyst first pointing out this parallel channel back in 2023, they believe that it continues to remain valid, especially as the price continues to rtend low.

Back then, the crypto analyst had predicted that the ADA price, if it were to break out of this parallel channel, could rise as high as as $35. This bullish expectation continues with the most recent analysis, albeit with a price adjustment.

In the Wednesday analysis, FieryTrading notes that There is still the possibility for the altcoin’s price to reach the top of the channel. In this case, the price would fully complete the move toward $30. However, the crypto analyst’s chart carries a $25 target, which would be a 5,600% rally from its current level.

Cardano price chart from TradingView.com

ADA Bears Maintain Control

Despite the bullish outlook maintained by the crypto analyst, Cardano has succumbed to the bears. The price has dropped as low as $0.44 in the last day, indicating a 1.38% decline. On a wider timeframe, the ADA price looks even worse, with an almost 28% drop in one month.

However, despite this trend, the analyst still believes that investing in Cardano right now is a risk worth taking. FieryTrading refers to it as “the entry of a lifetime” that could guarantee good returns. Moreover, the analyst gives it a R/R (risk/reward) ratio of 116, which is a good number.

For now, the ADA price is still struggling to hold up in the market. This is not helped by the decline in market sentiment, leading to a nasty 22% drop in its daily trading volume, according to data from Coinmarketcap.

Cardano price chart from Tradingview.com

Crypto Analyst Predicts 350% Surge For Shiba Inu – Here’s The Target

Crypto analyst Crypto Dona has predicted a 350% price surge for Shiba Inu (SHIB). He suggested that the meme coin will unlikely go higher than that in this bull run. 

Shiba Inu To Rise To $0.00011

Crypto Dona revealed in an X (formerly Twitter) post that his price target for Shiba Inu is $0.00011 and that he doesn’t see the meme coin going higher. A rise to that level represents a 350% price surge for the meme coin, which will undoubtedly appeal to Shiba Inu investors.

Related Reading: Here’s How This Ethereum Whale Made $16 Million From A Single Trade

Crypto Dona joins a host of other crypto analysts who predict that Shiba Inu could shed another zero from its current price level and rise to $0.0001. However, some of these analysts have given a way higher price prediction than Crypto Dona’s. One is Javon Marks, who predicts that Shiba Inu could rise to as high as $0.0001553.

Crypto analysts like Armando Pantoja and Ali Martinez have also made much higher predictions, predicting that Shiba Inu could rise to $0.001 and $0.011, respectively. Forecasts like these have undoubtedly raised the expectations for SHIB in this bull run, with community members optimistic that the meme coin could flip Dogecoin (DOGE) in this market cycle. 

Shiba Inu’s lead developer, Shytoshi Kusama, is also confident about the meme coin’s potential in this market cycle. He suggested that the meme coin is in a good position to lead this season. He alluded to Shiba Inu’s technology, vision, plan, and community as some of the reasons he holds this belief. 

The First Step Is Hitting A New All-Time High (ATH)

While Shiba Inu undoubtedly looks primed to make big moves in this bull run, the first step will be for the meme coin to rise above its current all-time high of $0.00008845, as it is currently 70% down from that price level. Shiba Inu’s Marketing Lucie has earlier predicted that the meme coin could hit a new ATH before or shortly after the Bitcoin Halving.

Related Reading: Can Ethereum Reclaim $4,000? Fragile Fundamentals Threaten To Send ETH Crashing

Crypto analyst and trader Xanrox also hinted that SHIB may hit a new ATH of $0.00008854 by July. Shiba Inu rising to a new ATH by then could set the pace for it to hit other bullish price predictions that crypto analysts have made for the meme coin. Meanwhile, it is also worth mentioning that Shiba could soon come close to its current ATH with Ali Martinez highlighting a bull flag on Shiba Inu’s chart which he belives could send the meme coin to $0.000072323. 

At the time of writing, Shiba Inu is trading at around $0.0000227, down over 4% in the last 24 hours, according to data from CoinMarketCap. 

Shiba Inu price chart from Tradingview.com

AI Tokens ‘Preparing For Round 2’: Industry Shows 8% Growth With RNDR And FET

Excluding Bitcoin, memecoins were the biggest narrative of this cycle. However, Artificial Intelligence (AI) tokens also performed remarkably during the first quarter of 2024.

The crypto market recovered over the weekend from the May 1st retrace, with AI tokens showing significant gains. As a result, many industry experts think that the sector is poised for a ‘Round 2’ this cycle.

AI Sector Recovers By 8%

Crypto analysts highlighted AI tokens alongside memecoins as the hottest topic of 2024, responsible for most of the massive gains during this cycle.

According to CoinGecko’s report, AI was one of the three sectors that delivered three-digit returns in Q1. Moreover, the largest AI token by market capitalization, Fetch.ai (FET), saw gains of 378.3% during this period.

As a result, some analysts deem the AI sector to be the next main narrative of the cycle. Trader John Walsh, known as CryptoGodJohn, considers “The future of AI coins preparing round 2.”

Walsh added that the AI season is “extremely obvious” and will go “so much higher” based on the developments in the sectors, including Nvidia earnings, Apple AI, and Microsoft’s $100 billion AI fund.

To this, crypto analyst MacroCRG replied that a massive AI growth “will be obvious in hindsight,” considering that the sector’s market capitalization is “just” $27.3 billion.

According to a MacroCRG post, the AI market cap had increased 8% by Monday morning, and its daily trading volume was around $1.9 billion. On Tuesday, the market cap surged to $27.8 billion, a 2.3% increase from 24 hours ago.

In comparison, memecoins $54.4 billion market cap doubles AI’s. However, its market cap decreased by 2.8% in the last day, with the top ten memecoins showing red numbers in the past 24 hours.

Is Artificial Intelligence About To Bloom Or Ruin the World?

Despite the remarkable performance, some figures think the sector has a more pessimistic future. According to memecoin trader Murad, the developments in the industry will “be replacing more & more jobs every year.” As a result, there will be an increase in “Anxieties and desperate attempts to ‘make it.’”

To the trader, the industry will serve as a push for the memecoins sector, as “Growing AI capabilities will be one of the big forces accelerating the Memecoin Bubble.”

Financial giant Warren Buffett shared a more skeptical view on Saturday. The Co-founder and CEO of Berkshire Hathaway revealed he is not sold yet by artificial intelligence. To the CEO:

We let a genie out of the bottle when we developed nuclear weapons. AI is somewhat similar — it’s part way out of the bottle.

Despite this, Buffet recognized the potential for AI technology to change the world positively.

On The Brink Of A Millionaire Boom

“The AI industry is on the brink of a multi-trillion-dollar boom,” stated Alex Wacy. The analyst believes the reasons behind this are the vast and diverse potential of applications.

Moreover, the expert highlights that interest in the sector has steadily increased over the last year. A crypto and AI combination could potentially “create a market valued in the trillions.”

According to the post, the market is projected to reach nearly $2 trillion by 2030, which suggests that the crypto industry should not overlook it.

Tokens like RNDR showed a remarkable performance over the past week, with the price soaring by 45%. RNDR regained the $10 support zone this week after struggling to retest it over the last month.

In the past 24 hours, the token’s price surged 6.4%, and its daily trading volume increased by 16.8%, with over $455 million being traded.

FET is “a top performing AI coin headed into the Nvidia earnings,” as stated by John Walsh. The trader forecast that the token is “looking for a next leg higher up” after successfully retesting the $2.35 resistance level.

FET broke above this level over the weekend, rising to $2.5 on Monday and remaining above the $2.40 support zone since.

At writing time, the token is trading at $2.42, representing a 2.4% increase in the last 24 hours and a $22.9% surge in the past week.

AI, FET, FETUSDT

Can Ethereum Reclaim $4,000? Fragile Fundamentals Threaten To Send ETH Crashing

Ethereum has put on a disappointing performance for its investors over the last few weeks, leading to concerns on whether the second-largest cryptocurrency by market cap has lost its shine. The cryptocurrency continues to skirt around the $3,100 level, not making any significant breaks upward. This points to weak fundamentals that could trigger a price decline.

Ethereum Fails To Make Meaningful Moves

Markus Thielen, Head of Research at 10x Research, has pointed out some worrying developments with the Ethereum price. In a new report shared with NewsBTC, he explains that despite Ethereum remaining highly correlated to Bitcoin with an R-Square of 95%, it continues to perform poorly while the latter has made new all-time highs.

Thielen points back to ETH’s performance in the last bull market, which was closely tied to new sectors popping out of the network, such as decentralized finance (DeFi) and non-fungible tokens (NFTs). This caused demand to skyrocket, and in turn, the price followed as users gobbled up ETH for the high gas fee required to transact on the blockchain.

However, Ethereum has failed to maintain this momentum, which can be attributed to its inability to bring the upgrades that users needed in time. Thielen explains that the Dencun upgrade which helped solved the high gas fee issues had come three years too late because by 2024 when the upgrade arrived, users had moved on to Layer 2 networks. Also, during this time, other Layer 1 networks have seen a rise in users and Solana is one example of this.

Ethereum fees

The researcher further explained that the weak fundamentals of ETH are now not only affecting its price but has had a spillover effect to Bitcoin. “Ethereum’s weak fundamentals are becoming a roadblock for Bitcoin as they prevent broad fiat inflow into the crypto ecosystem,” Thielen stated.

Better To Short ETH

Thielen’s analysis of Ethereum also spreads to the drop in stablecoin usage on the network. Back in 2021, Ethereum had dominated stablecoin transactions such as USDT and USDC. However, it seems like, with other things, the high fees have driven users towards other networks. Blockchains such as Tron (TRX) are now dominating stablecoin transactions, leaving ETH in the dust.

Additionally, there is also the fact that ETH’s issuance is turning inflationary once again. After the London Hard Fork, also known as EIP-1559, was completed in 2021, the network saw its issuance turn deflationary for the first time as ETH burned quickly surpassed ETH being brought into circulation.

However, this has now changed in the past months as there have been more ETH issued than those burned, Thielen notes. To put this in perspective, a total of 74,000 ETH were issued compared to only 43,000 ETH burned. This inflation, coupled with the fact that staking rewards have now dropped to 3%, below the 5.1% offered by Treasury Yields, Ethereum has had a hard time maintaining bullish sentiment.

Given these developments, the researcher believes it is better to be bearish on Ethereum right now. “Right now, we would be more comfortable holding a short position in ETH than a long one in BTC as Ethereum’s fundamentals are fragile, which is not yet reflected in ETH prices,” Thielen concludes.

Ethereum price chart from Tradingview.com

Bloomberg’s Mike McGlone Reveals Why A $150,000 Bitcoin Price Target Is Far Off

Mike McGlone, Senior commodity strategist at Bloomberg Intelligence, has made a rather pessimistic prediction for Bitcoin, emphasizing that the cryptocurrency’s potential rise to $150,00 was a long shot. The strategist has revealed factors that could make Bitcoin’s projected surge to $150,000 difficult, highlighting both macroeconomic trends and Bitcoin’s performance in 2024

Bitcoin Surge To $150,000 Unlikely

In a recent interview with Scott Melker, the host of “The Wolf Of All Streets,” podcast, McGlone discussed Bitcoin’s price fundamentals and its possible rise to $150,000 in the 2024 bull cycle. 

Comparing Bitcoin with the stock market index, the S&P 500, the Bloomberg strategist disclosed that the cryptocurrency was currently showing “divergent weakness,” highlighting that Bitcoin’s performance against the S&P 500 in 2021 was greater compared to 2024. 

He also revealed that Bitcoin was displaying a similar weak performance to Gold, emphasizing current market conditions and the risk of short-term deflation in the financial market. 

The combination of these factors pushes McGlone to believe that Bitcoin’s short-term projected rise to $150,000 was unlikely. 

While the Bloomberg strategist made his foreboding prediction despite Bitcoin’s overperformance at the beginning of the year, McGlone still remains optimistic about the cryptocurrency’s price and fundamental value in the long term. 

Co-founder and CEO of CoinRoutes, Dave Weisberger, who was also in the podcast with McGlone, made a more optimistic prediction for Bitcoin. Basing his analysis on historical trends and patterns as far back as 2015, Weisberger forecasted that Bitcoin could rise to $200,000 this cycle. 

His forecast is also acknowledged by reformed hedge fund manager, James Lavish, who revealed in the podcast that Spot Bitcoin ETFs could become a potential driver for Bitcoin’s continuous growth. This is attributed to the massive impact Bitcoin ETFs had on the cryptocurrency’s price following its launch on January 11, 2024. 

After Spot Bitcoin ETFs were successfully released into the market, the price of Bitcoin skyrocketed to new all-time highs above $73,000. At the time of writing, the cryptocurrency is trading at $63,778, marking a 0.89% increase over the past seven days, according to CoinMarketCap. 

BTC Crash Presents Perfect Opportunity

According to Lavish, if Bitcoin crashes down to the $30,000 to $40,000 range, it would present a “tremendous opportunity” for investors to acquire substantial value in a long-term asset that will essentially hold its value and continue to appreciate in the future. 

The reformed hedge fund manager revealed that Bitcoin’s short-term volatility and market unpredictability could produce long-term capture of value. This suggests that by strategically navigating through the price fluctuations of Bitcoin, investors could potentially capitalize on its volatility to accumulate wealth over time, which in turn could favorably impact the price of the cryptocurrency.

Bitcoin price chart from Tradingview.com

Crypto Analyst Says Cardano Bloodbath Far From Over, Sets Bottom Price For ADA

Cardano has recovered from its April lows and continues to maintain a strong momentum above $0.45. This has prompted expectations that the altcoin will go on a rally from here. However, not everyone shares this sentiment as one crypto analyst expects the price to crash further from here.

Cardano Will Crash Back Below $0.45

In the latest video on his YouTube channel that revolved around Cardano’s future trajectory, crypto analyst, ‘More Crypto Online’, revealed why the ADA price is poised for more decline. The analyst pointed out that the altcoin is currently in its 3-wave corrective rally.

Now, the Elliot Wave Theory which is being referred to by the crypto analyst consists of five waves. Out of the five, three are bullish and two are bearish. The bullish waves involve the 1, 3, and 5, with 2 and 4 being bearish waves.

If the analyst is correct and the Cardano price has only completed three waves so far, that means the fourth wave, which is a bearish wave, is yet to be established. As a result, the crypto analyst believes that the Cardano price will further break down as it enters the fourth wave.

He further pointed out that the altcoin’s price had fallen below the $0.48 support, which was an important level for it. This, coupled with the fact that it is yet to enter the fourth wave, has the analyst convinced that the price crash is far from over.

As for where the ADA price might end up in this fourth wave, the crypto analyst believes it will go as low as $0.42 before recovering again. However, the good news is that once the fourth wave is completed, it gives way for the fifth wave to begin, which is the most bullish of all the waves and could see the ADA price barrel past $1.

ADA Metrics Still Bullish

Despite the bearish outlook presented by the crypto analyst, major Cardano metrics continue to show bullish divergence. For example, the daily trading volume of the altcoin has risen almost 17% in the last day to cross $286 million, data from CoinMarketCap shows.

This drastic rise in daily trading volume suggests a return of interest in the altcoin and this could quickly translate to a bullish trend, especially in the short term. Additionally, the fact that the price is on the rise at this time suggests that the majority of the transactions as a result of this renewed interest is from buyers rather than sellers. This suggests that the price will continue to rise if this demand is sustained.

At the time of writing, ADA is still sitting firmly above $0.45, with a 1.78% increase in the last day.

Cardano price chart from Tradingview.com

Shiba Inu Price Prediction: Crypto Analyst Says Massive Surge Is Coming, Here’s The Target

Shiba Inu has rebounded by over 19% from its $0.00002081 price point at the beginning of the month. Current price action shows the cryptocurrency might be on its way to performing an interesting price surge in the coming weeks. According to one crypto analyst, SHIB could actually go on a 120% price surge after breaking out of the current consolidation.

Crypto Analyst Says Massive Surge Coming

SHIB kickstarted a price correction immediately after reaching 0.00003556 in early March. Bullish investor sentiment surrounding the meme cryptocurrency at the time quickly changed into a bearish one. This pushed SHIB on a decline that bottomed out at $0.00002117 in the middle of April, indicating a 40% price correction in those two months. Interestingly, this was the worst SHIB price decline since the May 2022 collapse of the Terra ecosystem.

Related Reading: Why Did The Solana (SOL) Price Jump Today?

As noted on the 8-hour timeframe chart shared on social media platform X by crypto analyst World Of Charts,  SHIB has been on a consolidation channel for the past two months. However, the analyst foresees a bullish breakout to create a strong bullish wave that’s going to send SHIB holders on a profit margin between 100% and 120%.

Interestingly, a further look into the chart shared by World Of Charts shows that the analyst is open to a higher price surge over a longer period of time. The last price target indicated on the chart is $0.00009500, which is a 280% target from the current price levels. 

Can Shiba Inu Push Higher?

Shiba Inu recently formed a higher low on the weekly timeframe, an indicator that the bulls might be starting to gain the upper hand. Despite the past decline, over 56% of SHIB holders remained in profit as many long-term holders opted to hold on to their tokens. At the time of writing, SHIB is trading at $0.00002489 and is up by 6.4% in the past seven days. This price increase has seen the number of SHIB holders in profit rising concurrently to 61%.

Related Reading: Bitcoin Relative Strength Jumps To 40%: 10x Research Reveals Next Steps From Here

Many addresses that just moved into profit margin are not taking profit indicating that majority of investors are anticipating a price increase in May. One catalyst that could lead to a further price increase is the recent partnership between PayPal and MoonPay which will allow PayPal users within the United States to buy the dog-themed cryptocurrency easily.

Popular crypto analyst Ali Martinez also predicted a SHIB price surge based on a bull flag that has recently appeared on the token’s price chart.

Shiba Inu price chart from Tradingview.com

Analysts Foresee Altcoins ‘Explosive Rally’ Incoming, Is The Correction Phase Over?

Over the weekend, the crypto market started recovering from the largest retrace of this bull cycle. The strong correction caused Bitcoin and the altcoins market to drop to levels not seen since February.

While some sectors of the crypto community felt like the bull run was over or needed to “cool-off”, others seemed optimistic about the cycle’s future. Now that the market is back from the correction, analysts foresee that the altcoin season might come soon.

Is The Correction Phase Over?

Over the weekend, crypto analyst and trader MilkybullCrypto shared with his X followers that the Altcoins market capitalization was at “an RSI level that initiates an explosive rally.”

Per his chart, this level is a “reset for a healthy rally,” as seen in 2016 and 2020. During these two cycles, when the altcoins reached this level, a “huge rally” followed.

The analyst shared his latest forecast on Monday after seeing the market strengthen its recovery. To Milkybull, the altcoins market cap finished a “Heatly retest.”

The market displayed a similar correction during the 2020-2021 rally before skyrocketing to all-time high (ATH) levels. The chart seems to display the same performance, which could mean that altcoins are “in preparation for an explosive rally,” if history repeats itself.

altcoins, crypto

Similarly, crypto trader and analyst Captain Fabik considers the “Healthy Correction is done.” In his X post, the analyst identified a bullish falling wedge pattern, which signals a “bullish rally incoming.”

Altcoins “Cool-Off” Or “Euphoria” Incoming?

According to analyst and trader Rekt Capital, the Altcoin market cap, excluding the top 10 cryptocurrencies, has “successfully retested the $250 billion level as a support level” over the last several weeks.

Per the trader, the altcoins are following the proposed path of his “Ultimate Altcoin Market Cap Game Plan For The Coming Months.” On this plan, Rekt Capital forecasted altcoins market cap would surge to the $315 billion level before retracing back to the $250 billion mark. This retrace would be followed by an explosive surge above the $440 billion market capitalization.

Altcoins have stayed above the $250 billion support zone despite the strong corrections, as seen in the chart below. To the analyst, this suggests the market is “now showing initial signs of trying to curl up from here.”

Renowned figures have expressed their “disappointment” in altcoins’ performance this cycle. Altcoin Sherpa considers that “many alts didn’t even run that hard over the last few months,” which could suggest that it’s time for a “cool-off.” At the time, the analyst deemed altcoins’ rally was “done” for the next 1-4 months.

However, others believe the “euphoria phase” for altcoins is coming. According to Crypto Yhodda, “The alts will rise again, and by the end of 2024, they will go crazy.” Moreover, the analyst believes that “Altcoins Cycle III” will give us some crazy pumps.

According to his chart, the altcoins’ cycle I and II displayed a symmetrical triangle pattern before the breakout. The surge was followed by a slowdown before the upward trajectory continued, called “Round 1” by the analyst.

Subsequently, the rally would repeat the pattern on a second round before reaching the cycle’s top. “Cycle III” appears to be in the middle of Round 1, which suggests to the analyst there is a long road ahead before it “hits the euphoria phase.”

Altcoins, crypto

Here’s Why This Crypto Analyst Believes Bitcoin Is At A ‘Prime Buy Zone’

Crypto analyst Ali Martinez has revealed that it may still be an excellent time to accumulate Bitcoin. This comes amidst the flagship crypto’s recent price recovery, with the crypto token skyrocketing above $64,000. 

Bitcoin Is Still In A “Prime Buy Zone”

Martinez mentioned in an X (formerly Twitter) post that Bitcoin’s Market Value to Realized Value (MVRV) 90-day ratio indicates that it is still in a “prime buy zone” despite its recent price surge from $57,000 to $64,000. The MVRV is a metric used to determine whether a crypto token is undervalued or overvalued. 

 Bitcoin

Based on Martinez’s findings, Bitcoin looks to be currently undervalued, which presents a good opportunity to accumulate the crypto token. The analyst’s revelation undoubtedly provides reassurance for those who failed to buy the dip and are looking for a perfect entry to invest in Bitcoin. 

Interestingly, Bitcoin whales didn’t waste time accumulating during Bitcoin’s recent decline, as Bitcoinist reported that these investors bought 47,500 BTC ($2.8 billion) between May 2 and 3. However, the MVRV ratio being at that level suggests that many of these whales are investors adding to their positions, meaning that significant buying pressure shouldn’t be expected anytime soon. 

Crypto analyst Michaël van de Poppe also recently suggested that Bitcoin is still undervalued. He noted that the crypto token is back above $60,000, and retail isn’t here yet. He mentioned in another X post that these retail investors won’t return until the summer, which means that everyone currently positioning themselves is still early. 

BTC Almost Ready For Next Leg Up

Crypto analyst Mikybull Crypto recently hinted that Bitcoin is almost ready for another parabolic rally. He stated that Bitcoin’s local bottom is in considering that the “next liquidity grab interest is above.” He added that Bitcoin will first “clear out the $67,000 level and consolidate in preparation for the $73,000 level. 

Related Reading: Fantom Revival: Crypto Analyst Predicts A Jump To $1.2 For FTM Price

Bitcoin 2

Meanwhile, the analyst revealed in another X post that Bitcoin has “finally experienced a MACD (Moving Average Convergence/Divergence) bullish cross” on the daily chart, just like it did in January 2024, which led to the crypto token rising to as high as $73,000 in March. According to Mikybull Crypto, Bitcoin reclaiming above the 50-day Moving Average will “further confirm the bullish continuation.”

For those looking to long Bitcoin, Mikybull Crypto remarked that the $64,000 range is an “ideal zone” to do so. He predicts that Bitcoin might clear out the CME gap between $62,580 and $64,105 before consolidating at around $64,000. 

At the time of writing, Bitcoin is trading at around $65,300, up over 2% in the last 24 hours, according to data from CoinMarketCap. 

Bitcoin price chart from Tradingview.com