Fetch.AI Soars 14.5% As AI Tokens Surge, Can FET Reach $4?

The crypto market is 5.1% up today, with a total market capitalization of $2.3 trillion. The recent pump has propelled different sectors, with memecoins being 9% up and Artificial Intelligence (AI) tokens increasing 11.2% in the last 24 hours.

Fetch.AI (FET) is at the forefront of the AI sector with its remarkable 14.5% increase in the past day. Some analysts foresee a bullish breakout for the token soon.

Are AI Tokens Taking The Lead?

As reported by NewsBTC, many market experts consider Artificial intelligence tokens a contender for the cycle’s biggest narrative in round 2.

Alex Wacy said the artificial intelligence industry is “on the brink of a multi-trillion-dollar boom” due to the increasing interest over the last year. As a result, the analyst considers the sector could create a market valued in the trillions, reaching $2 trillion by 2030.

This week, AI tokens have performed strongly. Altcoin Sherpa pointed out that the sector is “looking decent overall,” with tokens like Arweave (AR), Ocean Protocol (OCEAN), and Fetch.ai performing the best.

Renowned traded Daan Crypto considers the AI sector to be “bouncing the strongest” on this new market move, while memecoins seem to be the “weakest.” The trader shared his thoughts on Fetch.AI’s recent performance.

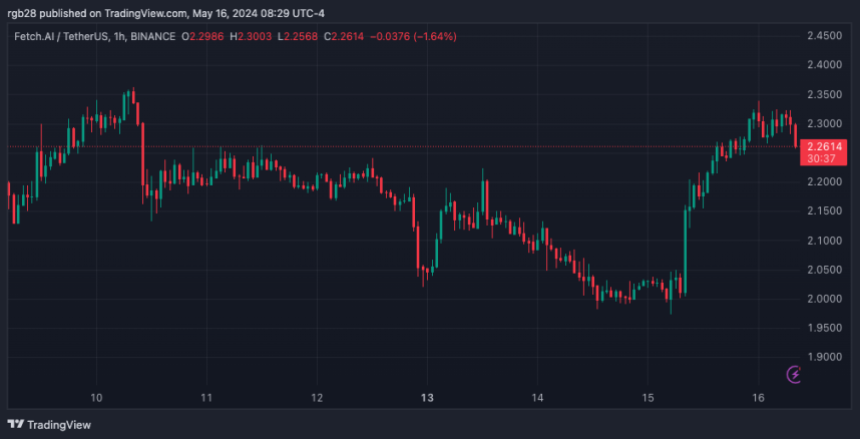
Daan highlighted the token’s attempt to break above the diagonal trendline. Per the chart, FET is testing the diagonal resistance, with the $2.35 mark being the first resistance level to reclaim.

AI, FET

A breakout above this level could be a “good start to a further trend change.” Moreover, the token broke “above the 4H 200MA/EMA already.” Per the trader, FET would need to test the $2.5 mark and remain above the $2.35 price range to “break the trend and head higher over the next couple of weeks.”

Similarly, crypto trader Scient considers the token consolidating inside a one-day ascending bullish triangle. His chart highlights the $2.12 mark as support for the diagonal trendline.

He forecasted a deviation below the trendline “towards 1D 100EMA” before reclaiming the $2.12 price range and moving back inside the triangle. If a retest and confirmation of the trendline reclaim occurred, the trader suggested he “would long it.”

Analysts Forecast $4 For FET

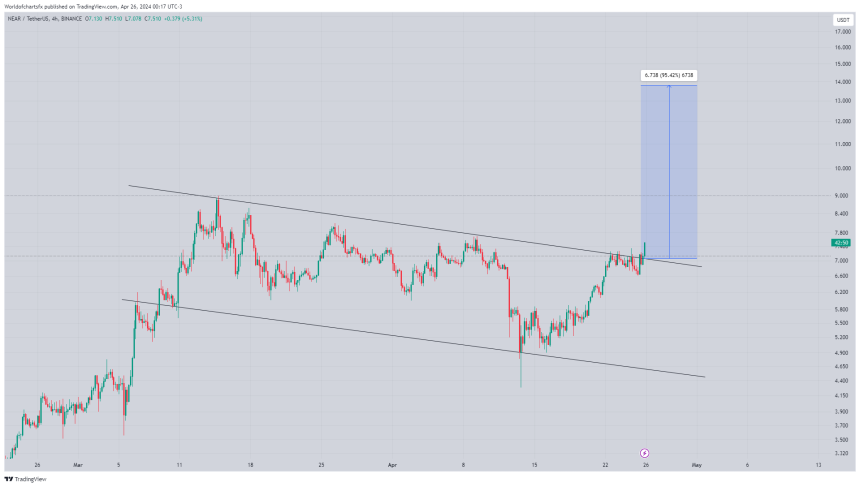
Crypto analyst World of Charts identified a “textbook” bullish pennant pattern on FET’s chart. The analyst expects an upside breakout soon, potentially leading to a 2x bullish wave. If the breakout is successful, the token’s price could move above the $4 price range.

Moreover, CryptoBoss seems to concur with this forecast. The trader shared a similar chart, signaling a possible breakout that could drive the token to double its price. In the post, he stated, “$FET 4$ exe loading…”

In the past 24 hours, the token has surged an impressive 14.5%, going from $2.04 to hover between the $2.3-$2.32 price range. This increase represents 7.5% and 13.2% in the weekly and monthly timeframes.

Similarly, FET has seen a rise in market activity. Its daily trading volume increased by 102%, with $354.2 million traded on the last day.

AI, AI tokens, FET, FETUSDT

NEAR Protocol Soars 7.3%, Is It Poised To Go Higher?

As the crypto industry navigates the waves of this bull run, projects like NEAR Protocol (NEAR) are edging forward with new partnerships and developments. NEAR’s remarkable performance has crypto analysts considering that the toke is getting underway for a massive surge.

Is NEAR Protocol A “Market Leader”?

At the beginning of the week, crypto analyst World of Charts recognized a bullish flag pattern formed on NEAR’s monthly chart. According to the analyst, a successful breakout could be followed by a 60-65% bullish wave in the coming days.

On Thursday, NEAR tested the $7.00 resistance level, reaching above the $7.50 mark before retracing as the day ended.

NEAR Protocol, crypto

Affirming his previous forecast, the analyst stated that if the token successfully holds above the breakout level, investors could expect the price to move towards $14-$15. Since then, the token has remained above the $7.00 mark, hovering between $7.3-$7.1.

Another crypto analyst has been following NEAR’s performance this week similarly. According to Bluntz, the token “has been one of the strongest movers from the lows and will probably be one of the first to make fresh highs.”

Moreover, he considers NEAR “one of the better performers” in the top 20 cryptocurrencies. Previously, the trader displayed a chart identifying an ABC zigzag pattern followed by a still-forming impulse wave pattern.

NEAR; crypto analyst

As NEAR broke out of the $7,00 resistance, the analyst reaffirmed his prediction for the token’s movements, considering it “a market leader right now.”

Bluntz added that the token kept “plodding along making fresh highs while everything else has stalled out and continued accumulating.”

Network Expansion And Price Surge

The NEAR Protocol is a Layer-1 “user-friendly and carbon-neutral” blockchain focused on performance, security, and scalability. According to its team, the “blockchain for everyone” was built with “usability in mind.”

NEAR’s total value locked (TVL) of $309 million makes it the 16th largest blockchain by this metric. Notably, the network has doubled its TVL since Q4 2023, when it sat in the 25th spot with $128 million.

The protocol collaborates with other projects constantly to continue “expanding financial horizons.” Projects like NodeKit and TrueZK have recently integrated NEAR’s solution designed for Ethereum rollups, NEAR DA.

Similarly, on Thursday, it announced its partnership with Colombian fintech Lulo X and Peersyst Technology “to redefine the parameters of digital finance.” These collaborations have been seemingly well-received by the NEAR community.

Despite being down by 6.25% in the monthly time frame and 65% below its all-time high (ATH) of $20,44 set in January 2022, the blockchain’s token has shown a remarkable performance during this bull run. In the last three months, NEAR has soared over 146%.

Moreover, the token’s daily trading volume has increased by 6.5% in the past day, with over $800 million traded. Likewise, its market capitalization has risen 5% during the same timeframe, making it the 17th biggest cryptocurrency by this metric.

As of this writing, NEAR is trading at $7.2, representing a 7.3% jump in the last 24 hours and a 26% rise in the past week.

NEAR, NEARUSDT, crypto

Is Bitcoin Getting Ready For An Explosive Breakout? These Analysts Believe So

The fluctuations in Bitcoin’s price have marked the tempo of the crypto market and the community’s sentiment. While some feel pessimistic about the rally slowdown, some analysts believe the flagship cryptocurrency is just getting ready to reach higher notes.

Next Stop: Bitcoin’s “Parabolic Upside”

Crypto analyst and trader Rekt Capital considers Bitcoin (BTC) is currently awaiting a period of consolidation. In an X post, the trader highlighted that, during the previous “Halvings,” BTC saw “Re-Accumulation Ranges.”

The analyst shared his chart for Bitcoin phases during the “Halving,” which he has previously used to explain BTC was at the “Last Pre-Halving Retrace” before April 19.

At the time, the analyst pointed out that the re-accumulation phase was next. Bitcoin went through one during the previous “Halving,” as seen in the chart.

The re-accumulation consisted of two consolidation periods followed by the “Post-Halving Parabolic Upside,” which saw BTC reach last cycle’s all-time high (ATH) of $69,000.

Bitcoin, BTC

Rekt Capital highlighted that, during this cycle, the flagship cryptocurrency has already experienced five re-accumulation ranges. Similarly to the last cycle, the latest re-accumulation phase seems to have started during the “Pre-Halving Rally” phase. Per the analyst, this will be followed by the “Parabolic Upside” if history repeats itself.

Analyst Mikybull seems to share a similar view to Rekt Capital’s, as he highlights that Bitcoin’s “parabolic rally is loading.” The re-accumulation breakout is set to be “explosive,” and “not many are prepared for this,” he added.

The analyst explained that “the RSI on a macro scale is at the same level as it was in 2017, which was followed by a huge rally to cycle top.” Based on this, he believes the current consolidation comes from institutions preparing “for a huge rally to cycle top.”

Analyst Sets Crucial Level For Bitcoin’s Breakout

A day before Bitcoin’s “Halving,” the cryptocurrency faced a correction that shredded 7% of its price in a few hours. BTC went from hovering between the $64,000-$63,000 price range to trading below the $60,000 support zone.

Since then, the largest cryptocurrency by market capitalization appears to have steadily recovered from the drop. Over the weekend, Bitcoin regained the $65,000 support level before testing the $66,000 one, which it reclaimed on Monday.

Over the last few days, BTC has hovered between $66,000 and $67,000. However, it has not been able to successfully test the resistance level set at the $67,000 price range.

According to the crypto analyst Bluntz, Bitcoin’s most recent performance suggests that the price will continue to move sideways between the $66,000 and the $67,000 range.

However, he also considers that BTC is “gagging for a breakout soon,” as the chart displays a bullish pennant pattern forming. Per the analyst, “once we clear 67k,” the whole market will fly above the latest ATH.

As of this writing, Bitcoin is trading at $66,665, a 7.5% increase from a week ago and a 66.22% in the last three months.

BTC, BTCUSDT, Bitcoin

Analysts Bullish On Bitcoin Despite Peter Schiff’s $20,000 Doom Scenario

Over the weekend, the Bitcoin (BTC) crash had the crypto community on its toes. With the price dropping to $60,000, many investors worried that the flagship cryptocurrency was in trouble ahead of the “Halving” event.

Amid the correction, Bitcoin critic Peter Schiff claimed that his previous predictions regarding spot Bitcoin ETFs (exchange-traded funds) were correct and presented the possibility of a doom drop for BTC.

Peter Schiff’s Doomsday Prediction For Bitcoin

Back in March, known Bitcoin opposer Peter Schiff asserted what he thought was the problem with Bitcoin ETFs. According to the economist, the problem with owning these investment products was that liquidity was limited to US market hours, which would mean that investors could not sell if the market crashed overnight.

On Sunday afternoon, Schiff claimed that, as he previously warned, Bitcoin ETF owners would be helpless if the flagship cryptocurrency started selling off that night. BTC traded around $63,460 at the time of his post and recovered in the following hour to trade above the $65,000 support level.

Earlier that day, Schiff had warned of a critical support zone for BTC. To the economist, breaking below $60,000 could “create a formidable triple top.” This trend reversal could lead to an “immediate downside projection” of $20,000.

Following his dooming scenario, Schiff stated that, at that price, MicroStrategy would “have a $2.7 billion unrealized loss on 214K Bitcoin acquired at an average price of $34K.” Additionally, he believes that BTC’s price could increase “before it crashes.”

Analysts Unfazed By BTC’s Correction

Several analysts concurred that the correction was a “minor drop” in the macro picture. According to MacroCRG, Bitcoin’s chart “looks incredible.” The analyst stated: “They threw a full-on war at her and all it managed to do was wick the range low.”

Similarly, trader and analyst Rekt Capital considers that BTC “successfully protected the Range Low of its Re-Accumulation Range as the week of the Bitcoin Halving begins.”

Per the analyst’s chart, Bitcoin is at the “Last Pre-Halving Retrace” during the “Pre-Halving Rally.” If history is to repeat itself, after April 19, BTC will enter the “Re-Accumulation” phase before experiencing the “Post-Halving Parabolic Upside.”

BTC, BTCUSDT, Bitcoin, Crypto

Moreover, Crypto Jelle urged investors to “not get shaken out” as BTC is “consolidating above the previous cycle highs.” The analyst and investor reaffirmed his prediction of $82,000 after the upcoming “Halving” event.

However, Jelle also set a higher target for this bull cycle. The bullish megaphone pattern on BTC’s chart “still has a pattern of $180,000” despite the recent correction, as stated in the post. The analyst claims he wouldn’t be surprised “if the meme pattern plays out once again.”

The correction caused BTC to register bleeding numbers for several periods. The biggest cryptocurrency exhibits an 8.4% and a 3.1% dip in the weekly and monthly timeframes. Similarly, BTC’s market activity has decreased by 32.1% in the past day, with a trading daily volume of $42.56 billion.

Nonetheless, Bitcoin has recovered 3.5% from its price 24 hours ago, currently trading at $66,275. Since the lowest point of this correction, BTC has surged 10.3%.

BTC, BTCUSDT, Bitcoin

Analyst Predicts Solana (SOL) Bounce Amid Network Congestion Problems

Solana (SOL) faced difficulties the past week after the network’s transaction failure rate reached over 75%. Since then, Solana’s core contributors have been working to find the congestion problems.

SOL’s price tumbled 7.8%, and users seemed worried about the network’s state. Despite this, some analysts predict a more optimistic performance for SOL soon.

Is Solana Poised For A Bounce?

According to crypto analyst Bluntz, Solana’s drop has reached its bottom. When the news of network congestion broke, the analyst predicted that SOL’s price would likely fall to $160 before seeing a bounce.

According to his chart, the performance was starting to show an ABC zig-zag pattern. At the time, the token was trading around the $184 price range, which meant that the C wave of $160 had yet to be confirmed.

The analyst remained open to the “possibility of a sideways correction.” Nonetheless, he considered it “would make no sense for sol/usd to sweep down lower below 160.”

On Wednesday, SOL reached a low of $162, sweeping the “A wave low.” To the analyst, this seems to be the bottom for SOL’s price despite being $2 short of his prediction. As a result, Bluntz considers that the token’s price will go “higher from here.”

Crypto, Solana, SOL

Another analyst, Immortal Crypto, pointed out that SOL has shown a “good range” between $210 and $160. According to the analyst, “a deviation from here is a fat long, 100%.”

Despite the possible bounce forecast, analyst Altcoin Sherpa expects SOL to drop to $140, a level it has not seen in almost a month.

Will The Network Upgrade Help SOL?

In the last 24 hours, Solana’s price has risen 6%, recovering from the drop to the $162 range. Despite a 7.8% drop in the past week, the price surged 13.5% in the last 30 days.

Similarly, the daily trading volume increased by 28% in the past 24 hours, suggesting a surge in the token’s market activity.

Nonetheless, investors remain concerned about the network as the problems continue, with some suggesting that the token’s price won’t start pumping until the “tech is sorted out.”

Solana is widely recognized for its fast transactions and low fees. However, the current on-chain failure rate presents problems for both users and developers.

Responding to the critics and concerns, Austin Federa, Head of Strategy at the Solana Foundation, gave insights into the problem.

According to Federa, developers from the core contributors to the Solana chain are “working diligently to shore up Solana’s networking stack to meet the unprecedented demand the network is seeing today.”

The developer explained that “the implementation of a software system is today not robust enough to handle the amount of traffic being thrown at it.” As a result, the core protocol developers are working to test and implement improvements, leaving “increasing fees as a last resort.”

At the time of this writing, SOL is trading at $174.57.

Solana, SOL, SOLUSDT

Analysts Say XRP Price Is Ready To Breakout, Here Are The Targets

Crypto analyst Egrag Crypto has stated that a breakout could be on the horizon for the XRP price. He also outlined price targets that the crypto token could hit if this price breakout were to happen successfully. 

XRP Price Could Rise To As High As $0.78

Egrag mentioned in an X (formerly Twitter) post that the next price target for XRP is between $0.702 and $0.786. However, the crypto analyst failed to give a timeline for when this price breakout could happen. He also raised the possibility of a short-term move to the downside but quickly added that it has no impact on XRP’s long-term trajectory. 

Regarding XRP’s long-term target, the accompanying chart that Egrag shared showed that XRP could still rise to $7.5 at some point. The crypto analyst labeled this price level as a “critical target level,” possibly in relation to higher price targets that Egrag believes XRP can attain before this bull run ends. The crypto analyst has, at different times, predicted that XRP could rise to as high as $27 at the peak of this market cycle. 

The $27 price prediction no doubt seems ambitious, and XRP holders are more likely to set their focus on Egrag’s more conservative prediction of $5. The crypto analyst recently boldly claimed that XRP is “guaranteed” to see as much as a 1000% gain on its way to a new all-time high of $5.5.

Egrag further mentioned that the crypto token will begin to experience its rise to the $5 price range between this month and July. Interestingly, Egrag boldly asserted in January that XRP would reach $5 in the next 90 days, meaning that the crypto token is meant to attain this price level sometime this month. 

Will April Be Another Unfulfilling Month For XRP Holders?

XRP holders will be cautious about getting their hopes high despite Egrag’s bullish predictions, which could be actualized this month. These investors had many expectations for XRP in March, with crypto analysts like Crypto Rover predicting earlier that XRP would experience a “massive breakout” last month. 

However, that did not happen, as XRP maintained a relatively tepid price action even when the broader crypto market enjoyed significant gains at different points in March. XRP’s underperformance last month further underlined its rather unimpressive price action since the beginning of the year, with a year-to-date (YTD) price loss of over 4%. 

At the time of writing, XRP is trading at around $0.58, down in the last 24 hours according to data from CoinMarketCap. 

XRP price chart from Tradingview.com (Crypto analysts)

Are Arbitrum Investors Still Selling Off? Analysts Remain Bullish On ARB As Price Surges 5.2%

Arbitrum (ARB), the Ethereum Layer 2 (L2) scaling solution, recently went through an unlocking event as part of its 2024 roadmap. However, the event raised concerns about how the token’s price would react amid the market slowdown. 

It’s been a week since Bitcoin’s price started to dip. Despite BTC’s recovery, the market still exhibits red numbers. Crypto analysts remain optimistic about ARB and the market’s bullish run. 

Are Arbitrum Whales Still Dumping On Exchanges? 

The event on March 16 unlocked 1.1 billion ARB tokens. These tokens were distributed among the team, advisors, and investors, who received 438.25 million ARB, approximately 40% of the total tokens unlocked. 

Since then, Arbitrum whales have dumped millions of ARB on exchanges. As reported by NewsBTC, eleven whales recently sent over $58 million worth of the token to different trading venues. 

Yesterday, the trend continued as two ARB whales sent around $12.72 million worth of ARB to the Binance exchange. These whales are seemingly investors who received around 28.43 million ARB tokens during the unlock.

As reported by an X user, the first wallet received 19.845 million ARB on March 16. This whale sent 3 ARB to Binance as a test before offloading 3.9 million tokens worth $6.9 million.

The second whale sent 3.424 million ARB tokens to Binance yesterday in two transactions, accounting for $5.79 million. Out of the 28 million tokens these investors received during Arbitrum’s unlock, the wallets now only hold 804,000 ARB, worth around $1.42 million. 

Analysts Foresee Leg Up For ARB

Arbitrum’s most recent downward trajectory started right before the unlocking event. After ARB’s price failed to maintain the $2 support level, the token dropped over 30% to trade around $1.48 on March 19. 

Since then, ARB has started to rise and retest its resistance levels again. According to crypto analyst World Of Charts, ARB broke a bullish flag on March 20. 

Successfully retesting the $1.64 price range could potentially bring a “40-45% Bullish Wave,” per the analyst.

ARB’s retest above the suggested price range succeeded in the following hours. The token rose to the $1.8 mark in the early hours of today before returning to the $1.75 price range.  

Crypto analyst Bluntz projected a leg up for Arbitrum after the price neared the $1.8 resistance level. As the analyst highlighted, ARB’s price performance shows an a,b, and c zigzag pattern that could suggest an upward trajectory for the token. Additionally, he expressed optimism about the market’s health based on the token’s performance.

ARB is trading at $1.76 at writing time, representing a 5.2% increase in the last 24 hours. Although it shows a 14% and 12% decrease in the weekly and monthly timeframes, its current price still represents a 29.4% surge since the year began.

arbitrum arbusdt

BNB On The Rise: Analysts Predict Easy Path To New ATH As It Nears $600

Binance Coin (BNB) has been on a bullish run despite the regulatory scrutiny that Binance has faced over the last several months. The token registered an impressive 13.7% price surge after almost reaching $600, and analysts predict that a new all-time high (ATH) might be coming in the next couple of months.

Is The Cost Clear For A New ATH?

As the crypto market rallies, Bitcoin continues to hit ATH after ATH, and altcoins’ prices keep regaining the levels of the previous bullish run. BNB has not been the exception; it surged over 13.7% in the last 24 hours and is near a crucial support level that could propel the token even higher during this cycle.

The price increase could be attributed to market dynamics and BTC’s performance. However, the recent announcement of ether.fi (ETHFI)’s introduction to the Binance Launchpool also seems to fuel the price since it will allow users to farm ETHFI by staking their BNB.

Crypto analyst Altcoin Sherpa shared his forecast for the token as the price was nearing $600. The analyst considers that, given the current BNB’s performances, the path to the previous ATH level is clear: “This one goes to ATH easily, and this was kind of obvious IMO.”

In the post, the analyst shared a chart that displays BNB’s performance since its ATH of $686.3, which is currently only 13.51% away. The token has registered mostly green candles every week since 2024 and only weekly green candles since February.

In the past month, BNB’s price went from oscillating between the $300-$320 price range to hovering between $520-$590, representing an increase of over 80%.

Despite the sunny forecast, Altcoin Sherpa doesn’t rule out cloudy days. The analyst expects pullbacks along the way but foresees BNB breaking the ATH “soundly” in the next couple of months.

Similarly, pseudonym crypto trader and analyst Captain Faibik highlighted that the token has gained over 120% since his ATH timeline prediction at the end of 2023. In late December, the trader forecasted that BNB would reach a new ATH in the first half of 2024, and the current performance seemingly reaffirms this stance.

BNB Price Performance

Despite the recent legal scrutiny faced by Binance, BNB has been able to sustain its recovery path. According to the crypto hedge fund Split Capital, the token has added more than $50 billion in market capitalization since the exchange settled with the Department of Justice (DOJ) for $4 billion in November.

BNB’s market cap of $91.22 billion represents a 10% increase in the last 24 hours. By this metric, the token is the fourth largest cryptocurrency in the market. Similarly, its trading volume significantly increased by 50% on the last day.

Earlier today, the price reached $599.8, just cents away from hitting the $600 price range, according to CoinMarketCap data. At the time of writing, BNB has been trading at $595.6, a price surge of 38.6% in the last seven days.

BNB, BNBUSDT; Binance, Bitcoin

Crypto Analysts Are Giga-Bullish On XRP Price, Set Multiple Price Targets

Crypto analysts are currently optimistic about the XRP price trajectory in the coming months, setting different price targets, with some of them more bullish than others. XRP, like most top cryptocurrencies, is always subject to price predictions from analysts as the entire crypto market continues to anticipate the resumption of a market-wide rally

Consequently, experts on social media are calling for some pretty wild price targets for XRP if the bull run kicks back into gear. Other market factors, like the possibility of an XRP ETF, are also bound to come into play in the quest for a price rally.

Crypto Analysts Remain Bullish On XRP Despite Price Consolidation

XRP has been on price decline since the beginning of the year. At the time of writing, the XRP price is trading at $0.5375, down 14% from the $0.625 level in early January. Notably, price movement recently went on a surge at the beginning of February as the broader cryptocurrency market witnessed inflows spearheaded by Bitcoin. As a result, XRP climbed to the $0.57 price level on February 15. 

Despite the ongoing consolidation and lackluster price action, crypto analyst EGRAG CRYPTO has predicted a $1.4 XRP price target in the coming months. The analyst, known for his strong positive stance on XRP, made this prediction while looking at the wicking, ranging, consolidation, and bullish stages of XRP.

According to a color-coded price chart shared on social media by EGRAG, XRP is currently in the wicking stage. XRP recently closed above a long-term support level of $0.5141 at the top end of the red flag stage. Consequently, we could see XRP passing through into the bullish stage and $1.4 in the coming months. 

It’s worth noting that the $1.4 price point coincides with a 1.618 Fib extension from $0.3536. EGRAG had noted in the past that XRP reaching $1.4 would set the stage for a progression to $5.

Dark Defender, another crypto analyst, used the wave strategy to predict various bullish price points. According to a social media post, XRP could continue the current downturn until it reaches the end point of a wave 2 correction between $0.5198 and $0.5066. Subsequent waves 3, 4, and 5 formations would then see XRP tearing past  $0.6649, $0.7707, and $0.9191.

Analyst Dr. Profit also noted the potential of inflows rushing into XRP in the next 30 to 60 days. The analyst divulged that he bought 500,000 recently while calling XRP the “next shining bull.”

In the spirit of bullish countenance, a popular Bitcoin day trader recently disclosed that his father sold his house for $800,000 and allocated the proceeds to purchase XRP. Although this might seem very daring and unbelievable, it emphasizes the vast amount of optimism among some XRP investors.

XRP price chart from Tradingview.com (Crypto analyst)

XRP Price Set To Explode: Analyst Identifies Trigger For Next Parabolic Move

Crypto analyst JD has once again commented on XRP making a “parabolic” move. This time around, he has identified exactly what needs to happen for the crypto token to enjoy a significant rally

All Eyes On The MACD

In a post shared on his X (formerly Twitter) platform, JD highlighted the MACD (Moving Average Convergence Divergence) as the trigger for the crypto to enjoy a significant rally. He noted how XRP went “parabolic” the last time the MACD crossed the 0 level. According to him, that hasn’t happened this time, but the market seems very close to that level. 

JD shared an accompanying chart to elucidate his point. From the chart, one could see that XRP enjoyed a 650x gain the last time the MACD crossed 0. This significant breakout, which came in 2017, happened after a 4-year trendline that dated back to 2014. 

This time, the coin has consolidated for a longer period as he highlighted an 8-year trendline that dates back to 2017. He expects the market to instantly become bullish if there can be a breakout from that trendline. For now, JD believes that a bullish cross is still in play despite the fact that the MACD is below 0. 

In response to his post, another X user stated that “it’s game over” once XRP crosses the $0.92 price level. JD seemed to agree as he stated that it was going to happen. Meanwhile, the crypto analyst has remained cautious about giving a prediction as to what price level XRP could hit. However, from the chart he shared, XRP could rise to as high as $15, taking a cue from 2017.

Between XRP And Bitcoin

Crypto analyst Egrag Crypto has also given his view on the future trajectory of XRP in relation to Bitcoin. He spoke about a “Helheim Gate Way” scenario and how Bitcoin’s price could affect XRP’s. He said BTC surging to the 48k-50k range might exert pressure on XRP, causing it to decline against the flagship cryptocurrency

In this scenario, XRP’s decline is a result of Bitcoin apparently absorbing substantial liquidity, driving the latter’s dominance higher. However, things could turn out differently if XRP decides to “decouple and carve its unique path.”

Although this projection doesn’t seem favorable for XRP, Egrag noted that it could still be “remarkably bullish.” The reason is that liquidity could flow back “aggressively and abruptly” to altcoins like XRP once Bitcoin releases all the absorbed funds. Crypto analyst CrediBULL Crypto has once mentioned something in this regard. 

He stated that XRP’s price could decline in the short term as Bitcoin continues to enjoy a parabolic rise. He, however, mentioned that XRP will be one of the biggest benefactors once there is an “influx of new money.”

Featured image from iStock

Is $10,000 Possible For XRP Price? Crypto Analysts Weigh In

The possibilities of how high the XRP price can go has triggered heated debate among crypto community members over the past week. One particular forecast put the price of the cryptocurrency as high as $10,000 as Ripple advances in the payments sector. However, the validity of this prediction is still heavily debated, leading crypto analysts to weigh in on whether this price point is possible.

Analyst Explains Why $10,000 Is Not Possible

One analyst who has weighed in on the XRP price to $10,000 debate is Zach Rector. Following the circulation of predictions that the altcoin could rise to this level, Rector came forward to explain why he doesn’t believe that the XRP price can climb that high.

In the post that was made on X (formerly Twitter), Rector points toward a currency reset and debt restructuring as the reason behind his belief. According to him, both a Currency Reset and Debt Restructuring would have to take place before the altcoin can mount such a rally.

Explaining further, Rector points toward both of these taking place before the cryptocurrency could even rise to a much lower price point of $50. So he believes that instead of putting forward such price predictions, the question to be asked is, “How high will XRP go before we have a RESET?”

Another X user chimed in in response to Rector’s tweet to say it is possible for the XRP price to reach $10,000. However, they believe that this will only happen if the current high inflation rates are maintained. In a follow-up tweet, the user gives XRP a 5% chance of actually reaching $10,000.

“$10,000 is possible but that would be assuming that we maintain this disastrous inflation rate, XRP becomes worldwide cross border payment currency of choice with no competition, and Tokenization takes place and at least 10-20% of one of the top 10 markets worldwide utilizes XRP,” the tweet reads.

Why The Sudden Bullishness On XRP Price?

Indicators and investors alike first turned bullish for the XRP price following Ripple’s victory over the United States Securities and Exchange Commission (SEC) in July. The price of the coin had risen over 60% in the days following the ruling as interest ballooned.

The token’s rally has since slowed down since then, wiping the majority of its gains from the ruling. However, crypto analysts remain bullish. One analyst put the XRP price at $130, while another analyst sees it going as high as $500.

XRP’s trading volumes, which have been nearly consistent above $1 billion, also show that investors are heavily involved in the coin. This sustained bullishness is further fueled by Ripple’s exploits in the payments sector, as well as working with various countries on their Central Bank Digital Currencies (CBDCs).

Ripple XRP price chart from Tradingview.com (XRP $10,000)