Ethereum Burn Rate Hits Yearly Low: What This Means For ETH’s Future
In recent weeks, Ethereum has displayed subtle signs of recovery amidst a generally bearish crypto market, with the altcoin mimicking Bitcoin’s modest uptrend.
Despite Ethereum’s price increasing slightly by 0.2% over the last 24 hours, a parallel trend that might significantly affect Ethereum’s economic model has been unfolding beneath the surface.
Decline In Network Activity Reduces ETH Burn
April witnessed Ethereum’s ETH burn rate hitting an annual low, primarily due to a significant decrease in network transaction fees.
These fees have typically fluctuated just below 10 gwei this year, but recent weeks have seen them dip to some of the lowest levels, directly influencing the rate at which ETH is burned.
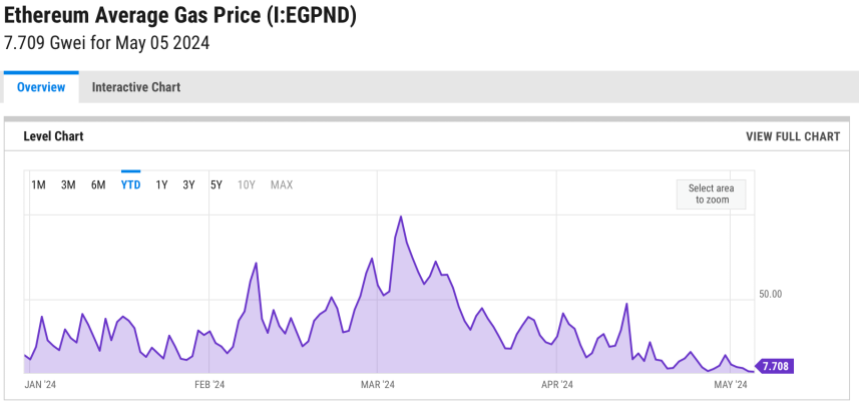
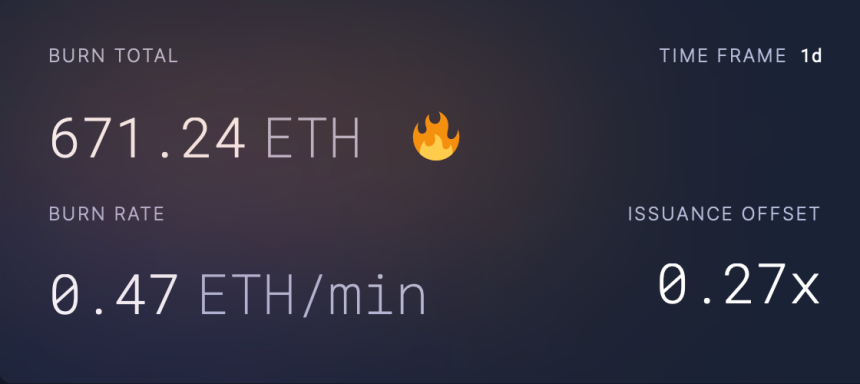
This reduced burn rate is evidenced by the stark drop in daily burned ETH, which reached a low of 671 ETH in the past day a notable decrease from the daily figures of 2,500–3,000 ETH seen earlier in the year.
Such a decline in burn rate is not merely a statistical anomaly but a reflection of broader shifts within the Ethereum network.
A significant factor contributing to the lowered gas fees is the increased migration of network activities to Layer 2 solutions, which enhance transaction speeds while lowering costs.
Moreover, innovations like blob transactions, introduced in Ethereum’s recent Dencun upgrade, have further optimized costs on these secondary layers.
Notably, Blobs are a feature introduced to enhance Ethereum’s compatibility with Layer 2 solutions like zkSync, Optimism, and Arbitrum by efficiently managing data storage needs. This functionality is part of the Dencun upgrade, which integrates proto-danksharding via EIP-4844.
While beneficial in reducing transaction fees, these technological strides pose challenges to Ethereum’s deflationary mechanisms.
This upgrade introduced a new fee structure in which a part of every transaction fee, the base fee, is burned, potentially reducing the overall ETH supply. However, with decreased transaction fees, the anticipated deflationary pressure via burning has softened, signaling a shift to a more inflationary trend in the short term.
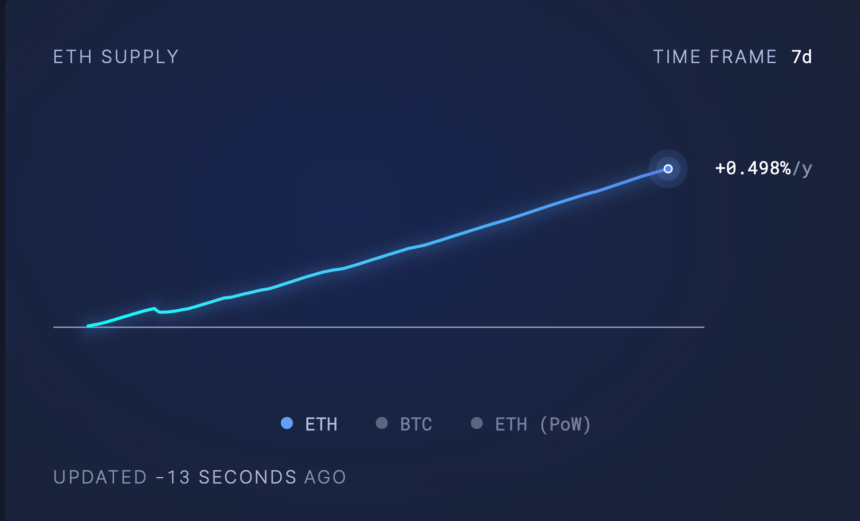
According to Ultrasoundmoney, Ethereum’s supply dynamics have swung to a mildly inflationary mode with a growth rate of 0.498%. This shift could realign if network activity intensifies, leading to increased transaction fees and, consequently, higher burn rates.
Ethereum Market Response
Despite these underlying network dynamics, Ethereum’s market price has struggled to regain its former highs above $3,500. The asset trades around $3,085, reflecting a slight downturn over recent weeks.
This price behavior underscores the broader market’s reaction to internal network changes and external economic factors, such as regulatory struggles from the US Securities and Exchange Commission (SEC) and macroeconomic uncertainties.
Looking ahead, the trajectory of Ethereum’s gas fees and subsequent ETH burn rate will be crucial in determining the sustainability of its economic model.
Featured image from Unsplash, Chart from TradingView
Bitcoin Hits ‘Danger Zone’: Peter Schiff Warns Of ‘Do or Die’ Scenario
Bitcoin is facing a critical juncture as it has entered a ‘danger zone,’ according to prominent gold advocate Peter Schiff. This investor, known for his skepticism toward Bitcoin, suggests that the cryptocurrency is entering a “do or die” phase, potentially marking the end of its bullish run if current trends continue.
Breaking Points And Bearish Signals
Peter Schiff has often voiced his bearish outlook on Bitcoin, and his latest comments come as Bitcoin has just slipped below the crucial $60,000 mark.
This level had previously served as strong support during the short-term bull run, and its breach has intensified the bearish sentiment among investors. Schiff warns that staying below this threshold could spell doom for the bullish fervor, potentially derailing Bitcoin’s momentum.
At the time of writing, Bitcoin is trading at approximately $57,054, teetering close to its 100-day Exponential Moving Average (EMA). Schiff points out that remaining below this EMA could confirm a bearish trend, signaling an end to the rally.
Amidst these developments, the market has seen an increase in trading volume, coupled with the price drop, indicating strong selling pressure.
Over the last 24 hours, Bitcoin’s trading volume has dropped from $45 billion to $48 billion, coinciding with a 6.3% price dip during the same period. This heightened activity is a traditional bearish indicator, lending weight to Schiff’s prediction of a downturn.
Moreover, investor sentiment is treading thin ice with significant outflows from Bitcoin spot ETFs, hitting a weekly high of $162 million. This departure of funds is particularly poignant as it unfolds just before the FOMC meeting, where potential interest rate hikes are on the agenda.
These outflows reflect a broader market trend, with the Grayscale Bitcoin Trust (GBTC) experiencing a substantial daily outflow of $93.23 million.
According to SoSoValue, total net outflows from Bitcoin spot ETFs yesterday, April 30, were as high as $162 million. GrayscaleETF GBTC had a single-day net outflow of US$93.2277 million, and the current historical net outflow of GBTC is US$17.303 billion. The total net asset… pic.twitter.com/jSCtfVrW8l
— Wu Blockchain (@WuBlockchain) May 1, 2024
The Bitcoin ETF Conundrum And Market Forecasts
It is worth noting that last month was quite challenging for US Bitcoin ETFs. After a promising start with positive inflows in the initial months following their launch, April witnessed collective outflows amounting to $182 million across all active spot Bitcoin ETFs in the US.
This pullback is attributed to macroeconomic concerns and geopolitical tensions, which have clouded the investment landscape.
As the market braces for further turbulence, analysts such as Micheal Van de Poppe are forecasting an additional correction, potentially pushing Bitcoin’s price down to $55,000 before any sign of recovery.
Monthly close approaching for #Bitcoin and FOMC day tomorrow.
I think we’ll see that sweep beneath $60K and potentially cascade towards $55-58K from which we’re finding the low and rotate back upwards.
From there: Ethereum ETF hype in May to pick up momentum. pic.twitter.com/Iki4De9mSF
— Michaël van de Poppe (@CryptoMichNL) April 30, 2024
Featured image from Unsplash, Chart from TradingView
Bitcoin’s Profit Crunch: Hash Price Hits Record Low Post-Halving—What’s Next For Miners?
In Bitcoin mining, the activity’s profitability is significantly influenced by a metric known as the ‘hash price.’ This metric has recently plummeted to unprecedented levels, causing concerns within the mining community.
Bitcoin’s Latest Halving Sends Hash Price Into Freefall
As Bitcoin underwent its fourth halving event on April 20, expectations were high regarding a potential increase in miner revenue. However, contrary to these expectations, the hash price witnessed a steep decline, currently valued at less than $50 per PH/s per day.
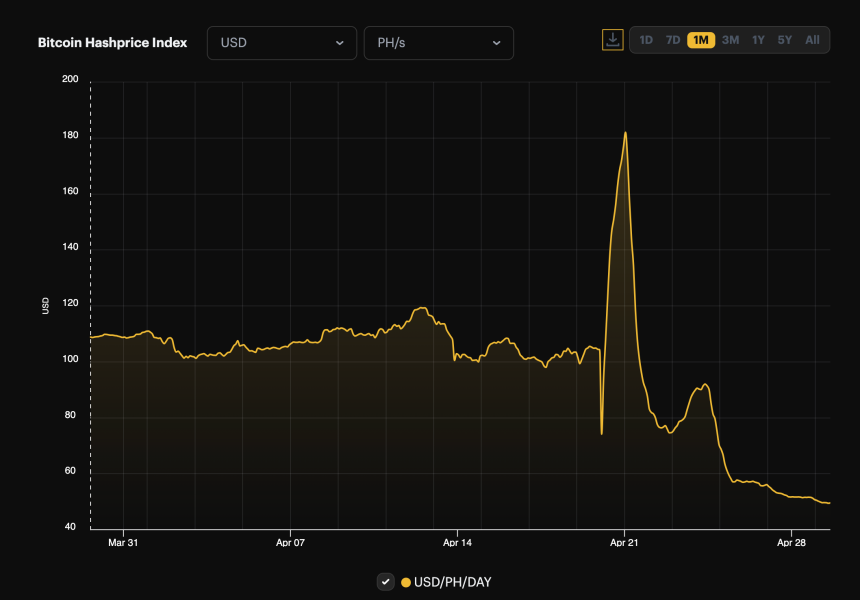
The concept of hash price, developed by Luxor, a Bitcoin mining services company, helps understand the daily dollar earnings a miner can expect per unit of hashing power.
Despite Bitcoin’s hash rate remaining strong, the halving event, which reduced the mining reward from 6.25 BTC to 3.125 BTC per block, has exerted downward pressure on the critical profitability metric.
This reduction in potential earnings comes when the overall cryptocurrency market, including Bitcoin, is experiencing volatility.
This downturn in hash price is not isolated but coincides with other declining metrics in BTC. According to TradingView, Bitcoin’s dominance index has also reduced, highlighting a decrease in capitalization relative to the total crypto market.
Bitcoin’s dominance has declined from 57.10% mid-month to approximately 54.69% today. Concurrently, Bitcoin’s market value has also trended downward; over the past week, the cryptocurrency experienced a decrease of about 4.4%.
This downward trend persisted into the past day, with Bitcoin’s price dropping an additional 0.8%.
Signs Of A Bullish Future Amid Bitcoin Current Slump
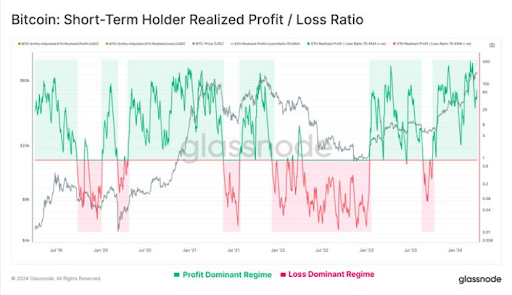
Despite the downward turns, analysts like those from CryptoQuant suggest that bullish signals might still be on the horizon. They point to the Adjusted Spent Output Profit Ratio (aSOPR), which, despite current market indecisiveness, continues to exhibit bullish trends.
Moreover, expert analysts like Rekt Capital have weighed in with a long-term perspective, suggesting that Bitcoin could see a significant rally as part of this halving cycle, drawing parallels with previous cycles.
Historical data shows that Bitcoin typically reaches a market peak within 500-550 days post-halving. If these patterns hold, Bitcoin could be poised for substantial gains by mid to late 2025, reinforcing the cyclical nature of this leading digital asset’s market movements.
Overall, while the immediate effects of the halving on hash price and market dynamics paint a sad picture, the underlying data indicates a mix of caution and optimism.
Featured image from Unsplash, Chart from TradingView
Cracking the Crypto Code: ETH/BTC Signals The Next Altcoin Explosion – Here’s How
Recently, a seasoned crypto investor, Daan Crypto Trades, offered a fresh perspective on evaluating altcoin market sentiment.
Daan believes the ETH/BTC ratio is a superior indicator of altcoin market sentiment over the SOL/BTC ratio, showing data that suggests the potential for an upcoming altcoin season.
ETH/BTC vs. SOL/BTC: Decoding The True Alts Barometer
Daan Crypto Trades has challenged the emerging view that SOL/BTC might be a better gauge for altcoin strength, arguing instead for the enduring relevance of ETH/BTC. According to Daan, while Solana’s performance has been notable, it hasn’t significantly impacted Bitcoin’s dominance, which remains strong.
This observation suggests that SOL/BTC may not accurately reflect broader alternative coins market trends. On the other hand, ETH/BTC has historically mirrored shifts in altcoin market sentiment more closely, making it a more reliable metric.
This distinction is crucial for investors seeking to understand the real-time health and potential shifts within the broader altcoin market.
Seeing a lot of people claim $SOL/BTC is a better proxy for general alt strength than ETH/BTC.$SOL performed extremely well and the general alt market underperformed BTC as BTC.D grinded higher.
Therefore, I would not say SOL/BTC is a good gauge for overall altcoin strength at… https://t.co/8KpdnACoOt
— Daan Crypto Trades (@DaanCrypto) April 28, 2024
Daan’s analysis points out that significant movements in the ETH/BTC ratio have often preceded dynamic phases in the altcoin market, commonly referred to as ‘altcoin seasons.’ These periods are characterized by rapid price increases across altcoins, often outpacing Bitcoin.
Signs Of An Emerging Altcoin Season?
Current market analysis by Daan and on-chain data from Santiment underline a brewing sentiment that could lead to another alternative coins season. Santiment’s report highlights an unusual accumulation pattern across altcoins, with their Market Value to Realized Value (MVRV) ratios suggesting many are undervalued.
Over 85% of altcoins analyzed are currently positioned in what Santiment describes as the historical “opportunity zone.” This zone indicates that the assets are trading below their realized value, presenting potential buying opportunities for savvy investors.
According to our model, the mid-term gains and losses by average wallets indicate heavy realized losses across most #altcoins. Over 85% of assets we track are in a historic opportunity zone when calculating the market value to realized value (MVRV) of wallets’ collective… pic.twitter.com/NogkCSH5PG
— Santiment (@santimentfeed) April 25, 2024
Further reinforcing this sentiment, the Bitcoin dominance index (BTC.D), which tracks Bitcoin’s market cap relative to the entire crypto market, has slightly declined. BTC.D has dropped from 57.10% as of the middle of this month to roughly 54.69% as of today.
This decline could suggest that capital is beginning to flow more substantially into altcoins. Notably, the combination of favorable MVRV ratios and shifting dominance lends credence to Daan’s assertion that an alternative coins season may be on the horizon, ready to unleash notable gains similar to past cycles.
Featured image from Unsplash, Chart from TradingView
Is A $72K Bitcoin Surge On The Horizon? Glassnode’s Latest Analysis Points To An Answer
Recent insights from Glassnode’s cofounders, shared under their X (formerly Twitter) account ‘Negentrophic’ have sparked interest in Bitcoin market dynamics, leading to a promising stabilization and possible price surge.
Market Sentiments And EMA Trends
With Bitcoin’s value recently wavering below the $70,000 mark, a detailed analysis from the cofounders suggests that a strong support level around the $62,000 50-day Exponential Moving Average (EMA) could set the stage for a significant rebound.
This crucial support level indicates a strong buying sentiment, indicating the market’s confidence in the cryptocurrency’s value and a potential resistance against further declines.
Using the strategic placement of the 50-day EMA as a support point, the analysis suggests that investors might see the current price levels as a solid base, preventing significant downward movements.
#BTC potential trajectory may offer Buy-the-dips Opportunities
BTC’s 50-day EMA near $62k provides potential support, targeting $72k for a rebound.
Shorter EMAs signal a tendency to buy, while longer EMAs suggest a preference for selling.
Given BTC’s recent significant gains… pic.twitter.com/3NjUUqa001
— 𝗡𝗲𝗴𝗲𝗻𝘁𝗿𝗼𝗽𝗶𝗰 (@Negentropic_) April 23, 2024
This perspective is reinforced by recent price movements, where despite a pre-halving general dip, Bitcoin has experienced a 7.1% increase in value over the past week, and the same uptick continued in the last 24 hours.
Further analysis by the Glassnode cofounders delves into the behavior of EMAs over different durations. Short-term EMAs indicate a growing inclination among investors to buy, while longer-term EMAs lean towards selling.
This contrasting behavior between short and long-term EMAs sheds light on the current phase of the market, which seems to be in a period of consolidation after the notable 92% increase in Bitcoin’s price over six weeks earlier in the year.
Such insights are vital as they offer a deeper understanding of the underlying market forces and investor behavior during volatile periods.
Meanwhile, Glassnode’s team’s analytical approach extends beyond simple price movements. Yesterday, they compared the current market conditions to the early 2021 “strong correction,” which they term “wave 4” of the ongoing market cycle.
This historical perspective provides a lens through which current trends can be evaluated, suggesting a cyclic return to bullish conditions reminiscent of past market behaviors.
Bitcoin Bullish Projections And Market Dynamics
Bitfinex analysts have highlighted significant activities around Bitcoin withdrawals, supporting the optimistic outlook on Bitcoin. The current levels, echo those of January 2023, suggest that investors are increasingly moving their Bitcoin to cold storage—a sign that many anticipate further price increases.
Veering back to Glassnode’s projections yesterday based on their indexes and Fibonacci levels, the cofounders were boldly optimistic, anticipating a potential 350% increase from current market levels.
The #Crypto Bull Market Continues.
“OTHERS” follows Crypto excl. the largest 10 Cryptos.
Observe that we in early 2021 had a strong correction. We believe that was a wave 4.
We now have a similar strong decline.More upside is coming. This index and our Fibonacci levels… pic.twitter.com/qKtIOSXneP
— 𝗡𝗲𝗴𝗲𝗻𝘁𝗿𝗼𝗽𝗶𝗰 (@Negentropic_) April 22, 2024
Notably, this forecast highlights the expected financial trajectory and underscores a growing confidence among experts and market analysts in Bitcoin’s market performance and its foundational economic principles.
Featured image from Unsplash, Chart from TradingView
Samson Mow On Bitcoin Halving: Brace For Supply Shock, Omega Candle In Sight
Samson Mow, the chief executive at Jan3, recently spoke to Forbes about the latest Bitcoin halving and its potential to catalyze what he refers to as the “Omega candles” – significant price movements that could elevate Bitcoin to the $1 million mark.
According to Mow, halvings ensure a controlled distribution of Bitcoin, maintaining scarcity and value.
The Mechanics Of Halving And Its Market Implications
Samson Mow detailed in the interview with Forbes the mechanics behind Bitcoin halvings—a critical process built into Bitcoin’s framework by its creator, Satoshi Nakamoto.
Omega Candle in sight! Omega Candle in sight! The #halving is proof that this system works, but it also means a supply shock is coming for any parties looking to buy large amounts of #Bitcoin. Check out @Excellion‘s comments on the recent halving in this @Forbes article by… pic.twitter.com/xp23ulxQIJ
— JAN3 (@JAN3com) April 22, 2024
This mechanism is designed to halve the block rewards given to miners every 210,000 blocks, or approximately every four years, reducing the reward by 50%.
So far, the most recent halving has reduced the reward for mining from 6.25 BTC to 3.125 BTC per mined block. However, initially, miners received 50 BTC per block.
Still, due to the halvings, this amount has decreased over time to manage inflation and extend the mining lifecycle of Bitcoin’s capped supply of 21 million coins. If not for these halvings, the total supply of Bitcoin would have already been mined.
In the same discussion, Mow highlighted the significant impact of newly approved spot-based Bitcoin ETFs, which received SEC approval earlier this year. He believes these ETFs, combined with the reduced block rewards from the halving, could precipitate a “supply shock” in the BTC market.
Mow further speculated on the occurrence of what he calls “Omega candles”—large price movement events in the Bitcoin market.
He noted that even before the recent halving, the daily demand for Bitcoin was significantly outstripping supply, predicting these Omega candles as almost certain events due to their high volatility and substantial price changes.
Mow views these developments as marking the beginning of a new era for Bitcoin, coinciding with its next, or fifth, halving in the coming four years.
Bitcoin Bright Future And Market Performance
Regarding positive sentiment on Bitcoin, Geoff Kendrick of Standard Chartered also supports this bullish outlook, projecting substantial inflows into BTC akin to those experienced by gold with the advent of gold ETFs.
Kendrick suggests that the maturation of the spot ETF market could channel between $50 and $100 billion into BTC.
However, despite the post-halving price not reaching the anticipated heights, BTC has demonstrated resilience and potential for considerable growth. Meanwhile, analysts remain confident, predicting significant long-term value increases.
For instance, Michael Sullivan’s analysis suggests a possible reach of $245,000 by 2029 if BTC maintains a 30% compound annual growth rate, underlining the optimistic projections shared by several market experts.
This optimism is further supported by recent trends, including a 7.1% increase in Bitcoin’s price over the last week, which indicates a possible recovery on the horizon.
Featured image from Unsplash, Chart from TradingView
Beyond Halving: Expert Predicts Bitcoin To Soar Above $200,000 With Surprising Catalyst
Global investor Dan Tapiero recently shared his optimistic outlook for Bitcoin (BTC), suggesting that the leading cryptocurrency soars above the $200,000 mark might be on the horizon.
Tapiero, known for his investment insights and co-founding roles in Gold Bullion International and 10T Holdings, took to X to express this bullish sentiment.
Catalyst That Could Drive Bitcoin To $200,000
According to Tapiero, a significant macroeconomic factor is expected to drive Bitcoin’s price to new heights, offering investors an opportunity for substantial gains. Tapiero’s bullish stance on Bitcoin’s future price trajectory revolves around a unique correlation he observed in the market.
Particularly, the expert highlighted concerns about “monetary debasement” driven by a notable 60% increase in the Treasury market over the past five years.
This factor leads Tapiero to anticipate a surge beyond $200,000 for the digital gold, Bitcoin. While acknowledging the potential for gold to perform well in such a scenario, Tapiero remains particularly bullish on Bitcoin’s prospects.
Most remarkable macro correlation break I’ve seen in some time.
Suggests extreme concern about monetary debasement driven by 60% Treasury mkt increase past 5yrs.
Theme not yet widely subscribed.
Bullish #GOLD and more so when rates drop.
Vaults #Bitcoin to 200k+

— Dan Tapiero (@DTAPCAP) April 8, 2024
Bitcoin’s Recent Performance And Analyst Insights
In the past 24 hours, Bitcoin has exhibited bullish momentum, surpassing and reclaiming the $71,000 price level. With a 2.6% increase over the week and a 3.1% surge in the last 24 hours, Bitcoin’s upward trajectory continues to attract attention from investors and analysts alike.
Notably, the current price performance of the asset coincides with a notable event: over 600 BTC of $100,000 strike call options have recently been traded in a Block trade. This significant development, as illuminated by Greek Live, carries a notional value of up to $45 million, with $8.5 million worth of premiums alone.
Greeks Live further reported that this occurrence has propelled the entire market into a prolonged bullish momentum. In addition, with the halving event on the horizon, the prospect of reaching new all-time highs, including the milestone of $100,000, appears to be within reach.
Bitcoin broke through the $70,000 zone without warning, one step away from a new all-time high.
The rapid rise has driven all major term IVs up significantly, with BTC Dvol now over 78%, and market sentiment has quickly reversed to a long atmosphere.
More than 600 BTC of $100,000… pic.twitter.com/JY9QXyzGMi— Greeks.live (@GreeksLive) April 8, 2024
Echoing Tapiero’s optimism, analyst Michael Van De Poppe has also recently emphasized Bitcoin’s potential for unprecedented growth.
According to Van De Poppe, despite encountering resistance, Bitcoin’s ability to break through key levels could pave the way for a surge towards new all-time highs, with projections reaching as high as $300,000 in the current bull run.
Featured image from Unsplash, Chart from TradingView
Bitcoin’s Recovery Rally: Breaking Through This Level Is Key To Bullish Momentum – Analyst
Over the past week, Bitcoin (BTC) has struggled to move significantly to the upside as the leading cryptocurrency has entered a consolidation phase below the $69,000 mark.
This subdued volatility departs from Bitcoin’s usual fluctuations, raising speculation about a potential stagnation phase in its market trajectory.
Anticipation Builds For Bitcoin’s Next Rally
The cryptocurrency community has closely monitored Bitcoin’s movements, especially as it approaches crucial resistance levels. Insights from prominent crypto analyst Captain Faibik shed light on Bitcoin’s current outlook.
Captain Faibik suggests that Bitcoin could be on the brink of a significant breakout, contingent upon surpassing the $70,000 resistance threshold. According to the crypto analyst, the BTC “Bulls must Clear the $70,000 Resistance area to Confirm the upside Breakout.”
$BTC is Bouncing back Nicely but still Consolidating within the Triangle.
Bulls must Clear the 70k Resistance area to Confirm the upside Breakout.#Crypto #Bitcoin #BTC pic.twitter.com/NxAz8Y1ktq
— Captain Faibik (@CryptoFaibik) April 5, 2024
Another crypto analyst, Jelle, Echoes similar sentiments and emphasizes the importance of patience among investors, particularly with the impending Bitcoin halving event on the horizon.
Notably, the Halving is a pre-programmed event built into the Bitcoin protocol that occurs approximately every four years within the Bitcoin network to reduce the reward for mining new BTC blocks.
Despite Bitcoin’s recent consolidation, anticipation for a potential rally above the $70,000 mark continues to build within the crypto community, especially as the halving is now less than 20 days away. This is because the halving ultimately decreases the supply of new BTC, and reduced supply often leads to increased demand and speculative buying.
Hope For Bitcoin Bull Run
Jelle’s analysis underscores the historical precedent of Bitcoin’s price movements, noting that previous all-time highs were often preceded by periods of consolidation and uncertainty.
Drawing attention to bullish indicators such as the pennant formation and strong support levels, Jelle predicts a breakout in the coming weeks, providing hope for investors seeking upward momentum in Bitcoin’s price trajectory.
While #Bitcoin did not break $69,000 in one go, it looks like it’s forming a new higher low here.
Hold $66,500, and we’ll be at $69k again soon.
Be patient – the halving is approaching fast. pic.twitter.com/LgMjodV4mF
— Jelle (@CryptoJelleNL) April 5, 2024
Meanwhile, current market data indicates a favorable environment for retail traders, with Glassnode reporting increased Bitcoin accumulation by short-term holders since December 2023.
This trend suggests growing confidence among retail investors in Bitcoin’s long-term potential, further fuelling expectations for a potential rally beyond $70,000.
Featured image from Unsplash, Chart from TradingView
Bitcoin Bulls Roar: Analysts Predict Surge To $82,000 Amid Bullish Pennant Formation
Renowned crypto analyst Jelle has caught the attention of the Bitcoin (BTC) community with his bold prediction of a target price of $82,000.
Notably, despite recent challenges in breaking above the $66,000 mark, Bitcoin currently hovers around $67,780, showing resilience in the face of a short-term pullback.
BTC To $82,000 Soon?
In an X post uploaded earlier today, crypto analyst Jelle shared his latest view on Bitcoin. According to the analyst, the Bitcoin target “remains the same: $82,000”.
It is worth noting that Jelle’s forecast is based on his observation of a “bullish pennant” formation, a technical pattern that suggests a potential surge in the price of BTC. According to the analyst, the asset might experience some volatility this month.
Jelle emphasized that a bullish pattern is forming, coinciding with the upcoming BTC halving in a few weeks. This adds credibility to the emerged bullish pennant formation and the possibility of Bitcoin reaching $82,000 shortly.
#Bitcoin has formed a bullish pennant, right as we head into the halving event.
Safe to say we’re in for some volatility this month.
My next target remains the same: $82,000. pic.twitter.com/PgBIG1wluX
— Jelle (@CryptoJelleNL) April 4, 2024
Notably, the Halving is a pre-programmed event built into the Bitcoin protocol that occurs approximately every four years or after every 210,000 blocks are mined to reduce the reward for mining new Bitcoin blocks, ultimately decreasing the supply of new coins.
Historically, the event has triggered bullish price movements, as reduced supply often leads to increased demand and speculative buying. The Bitcoin halving is currently less than 20 days away.
Bitcoin Latest Price Action
While BTC has faced challenges in its upward trajectory over the past week, recent movements suggest a shift in momentum. Within the last 24 hours alone, the asset has shown a promising 2.7% increase, rising from a low of $65,135 to its current trading price of $67,628.
Despite this positive movement, BTC still reflects a decline of approximately 6.4% over the past 7 days. However, amid this fluctuation, analysts such as Captain Faibik foresee the potential for a significant rebound in Bitcoin’s value before April concludes.
Captain Faibik’s analysis, mirroring the sentiments of fellow analyst Jelle, focuses on Bitcoin’s bullish pennant formation observed on the 12-hour timeframe chart. This formation suggests an imminent breakout towards the upside.
If this breakout materializes successfully, BTC could soar to unprecedented levels, with projected price targets ranging from $88,000 to $90,000 by month’s end, according to Captain Faibik.
$BTC Bullish pennant formation on the 12hrs timeframe Chart.
Expecting upside Breakout later this Week.
In Case of Successful Breakout, Bitcoin might hit the 88-90k this month.#Crypto #Bitcoin #BTC pic.twitter.com/TLsujGNSYj
— Captain Faibik (@CryptoFaibik) April 2, 2024

Featured image from Unsplash, Chart from TradingView
Bitcoin Teeters On The Edge Of Glory: Will It Smash The $70,000 Resistance?
Bitcoin (BTC) has been making waves with its steady climb towards setting a new all-time high (ATH), currently finding a foothold at the $68,000 zone.
This level of performance represents a culmination of investor confidence, market dynamics, and underlying economic factors that paint a broader picture of the digital currency’s “resilience and appeal.”
Crypto analyst Ali has recently shed light on a critical juncture in Bitcoin’s journey, identifying a significant resistance level that could influence its short-term price movements.
Key Resistance Awaits
Ali’s analysis brings to the forefront a specific resistance barrier that Bitcoin faces on its path to achieving a new ATH. According to Ali, a resistance level at $70,320, characterized by a total volume of 599,260 BTC held by 736,380 addresses, stands as the gatekeeper to further bullish momentum.
Surpassing this threshold could potentially catalyze Bitcoin’s ascent, further solidifying its status as the pinnacle of the cryptocurrency market.
This resistance particularly represents the collective anticipation and strategic positioning of hundreds of thousands of investors who have staked their claims in Bitcoin’s digital gold.
#Bitcoin finds solid ground at $68,300, yet a break below could lead to a downswing to the next support range at $65,250-$63,150, where 760,000 wallets hold 520,000 $BTC.
On the brighter side, securing $70,320 as support is vital for #BTC next leg up! pic.twitter.com/EMPBRRADzT
— Ali (@ali_charts) April 1, 2024
Meanwhile, the crypto market’s sentiment has been a rollercoaster, with Bitcoin experiencing a slight retreat, marking a 1.4% decrease over the past week and a 2.4% dip in the last 24 hours, landing at a market price of $68,448, at the time of writing.
Caution Amid Bitcoin Record Streak
Amidst this backdrop, author and former hedge fund manager Jim Cramer has voiced his observations, suggesting that the market is “the most overbought” it has been in a while.
The observations come just as Bitcoin marks its seventh month of positive performance, a milestone last achieved in 2012. This period of growth is highlighted by a monthly candlestick chart closing higher than the peak of its last cycle.
Adding to this “overbought” sentiment by Jim Cramer is a transaction of the seventh wealthiest Bitcoin address withdrawing 8,889 BTC from Bitfinex, valued at roughly $627 million, recorded by Peckshield.
However, despite this, Cramer’s statements have sparked debates and skepticism among the crypto community, with some questioning the timing of his comments as an April Fool’s jest.
April Fools + Cramer Signal = Massive rip incoming
— TB – JDUN (@Jduntrades) April 1, 2024
Featured image from Unsplash, Chart from TradingView
Bitcoin Rockets Past $69,000: Over 60k traders Caught In $200 Million Total Liquidations
The cryptocurrency market recently witnessed significant liquidations, totaling over $200 million, as Bitcoin surged past the $69,000 mark.
The Bitcoin price surge led to many short positions being liquidated, causing notable financial repercussions across various trading platforms.
Bitcoin’s Sudden Rebound And Liquidations
The data from Coinglass provide a clearer picture of the impact, showing that around 60,388 traders and counting faced losses exceeding $200 million in just 24 hours.
The distribution of these liquidations varied among the major exchanges, with OKX traders experiencing the highest losses at $81.19 million, narrowly surpassing Binance’s $80.40 million in liquidations.
Bybit and Huobi also reported significant figures of $18.98 million and $17.05 million in liquidations, highlighting the widespread effect of Bitcoin’s unexpected rally.
The resurgence of Bitcoin to over $69,000 was particularly noteworthy, given its position below $66,000 in the early hours of Monday. While the exact catalyst for this abrupt rise remains uncertain, it puts Bitcoin a few dollars in value away from reclaiming its previous all-time high of $73,000.
Analysts and traders are now closely watching the market for signs of Bitcoin’s next move, with speculation about the potential for new record highs in the near term.
Looking Ahead: Bitcoin Bullish Prospects
Crypto analyst Cryptoyoddha has provided an optimistic outlook for Bitcoin’s future, suggesting that the cryptocurrency is on the cusp of entering a new phase of its cycle that could see it reaching unprecedented heights.
According to Cryptoyoddha, Bitcoin’s historical pattern of accumulation, followed by a parabolic surge, sets the stage for what he terms “Cycle IV,” a period that could potentially elevate Bitcoin’s value to $150,000 or more.
According to the analyst, factors such as increased institutional investment, evolving regulatory clarity, and growing public acceptance of digital assets are key drivers of this bullish sentiment.
The real pump will start after the halving next month. pic.twitter.com/eV5FWkzkxX
— Yoddha (@CryptoYoddha) March 23, 2024
Meanwhile, Bernstein analysts Gautam Chhugani and Mahika Sapra recently updated their forecast for Bitcoin’s year-end price, elevating it from an initial $80,000 to $90,000.
This adjustment was prompted by notable factors such as the robust inflow into Spot Bitcoin ETFs and earnings from mining activities, which have contributed to a more optimistic outlook on Bitcoin’s valuation.
Additionally, they maintained that Bitcoin is on track to reach $150,000 by mid-2025, attributing this anticipated growth to several elements, including the impact of Spot Bitcoin ETFs, which they expect to drive a significant upswing in the cryptocurrency’s price.
Similarly, Standard Chartered has revised its prediction for Bitcoin’s end-of-year value. Moving beyond their original estimate of $100,000, the institution now suggests that Bitcoin could ascend to $150,000 by year’s end, citing the catalytic role of Bitcoin ETFs in fostering their positive outlook on the asset’s future performance.
Featured image from Unsplash, Chart from TradingView
Beyond Bitcoin ETFs: ‘There Are Other Players Controlling This Market’ – Says Analyst
Recent observations by Eric Balchunas, a senior ETF analyst at Bloomberg, suggest that the movements in Bitcoin’s price are influenced by factors beyond just the flows of spot Bitcoin Exchange Traded Funds (ETFs).
According to Balchunas, who shared his insights on X, “bigger forces at work” shape the largest cryptocurrency’s valuation. This indicates that the correlation between spot ETF flows and Bitcoin’s price action is less direct than some assume.
The ETF Influence And Market Movements
This analysis emerges amid a period of significant financial activity for Grayscale, which has seen substantial outflows, described by Balchunas as experiencing a “second wind” of departures.
Yesterday, Grayscale reported outflows of $281.57 million, marking a notable decrease in its Bitcoin holdings by more than 40% since the inception of spot Bitcoin ETFs on January 11.
This scenario highlights a broader narrative within the cryptocurrency investment sphere, where the relationship between ETF activities and Bitcoin’s market performance is complex and multifaceted.
Interesting is price of bitcoin still went up yesterday and yet it went down second half of last week when Ten saw net inflows = there are other players controlling this market. ETFs def a factor but bigger forces at work here.
— Eric Balchunas (@EricBalchunas) March 21, 2024
Despite the record outflows from Grayscale’s GBTC, Bitcoin’s market behavior has shown resilience. The cryptocurrency recently exceeded the $67,000 mark before experiencing a slight retracement, currently trading at a price of $66,106.
This movement coincides with comments from Federal Reserve Chair Jerome Powell, which seemingly spurred a rally across various risk assets, including cryptocurrencies.
Powell’s reassurances regarding the outlook on rate cuts prompted a slight recovery in Bitcoin’s price, demonstrating how external economic factors and sentiments can impact cryptocurrency markets. It is worth noting that Bitcoin traded below $65,000 before the announcement.
On-Chain Insights And Bitcoin Future Prospects
Further deepening the analysis, Charles Edwards, a crypto analyst, recently suggested that pullbacks are common in Bitcoin’s bull runs, with corrections of around 30% within the realm of possibility.
A normal Bitcoin bullrun pullback is 30%. Back in December, we were already in the longest winning streak in Bitcoin’s history. A 20% pullback here takes us to $59K. A 30% pullback would be $51K. These are all levels we should be comfortable expecting as possibilities.
— Charles Edwards (@caprioleio) March 19, 2024
In related news, data from the on-chain analysis platform CryptoQuant has recently indicated a nearly 40% reduction in Bitcoin’s supply on exchanges over the past four years.
This trend points towards a bullish sentiment within the Bitcoin ecosystem, suggesting that investors are inclined to hold onto their assets in anticipation of future value increases.
Moreover, CryptoQuant’s data reveals that Bitcoin’s demand has consistently outstripped its supply since 2020, a trend that supports the asset’s value on the premise that scarcity enhances perceived value.
This dynamic is expected to intensify following the upcoming Bitcoin halving event, which will reduce the miners’ supply by half, potentially leading to further increases in Bitcoin’s price.
Featured image from Unsplash, Chart from TradingView
Historical Data Signals Bitcoin’s Imminent 25% Plunge – Time To Buy Or Bail?
Historical data suggests that no Bitcoin cycle has peaked without experiencing significant double-digit corrections. These downturns, while daunting, have historically presented lucrative ‘buy-the-dip’ opportunities for investors.
As Bitcoin continues its ascent, with its price hovering above $62,000, the anticipation of a potential correction looms large, offering a window into the cyclical nature of cryptocurrency markets.
Market Maturity And Correction Patterns
Seasoned investor CryptoJelleNL recently shared a post on X earlier today pointing towards an imminent correction in the 20-25% range for Bitcoin.
Based on cycle analysis, this predicted dip indicates a potential drop to the $46,500 range, earmarking an opportunity for investors to bolster their positions in the leading crypto.
Corrections are an essential part of a #Bitcoin bull market — but with each passing cycle, the dips become shallower.
This cycle, it looks like ±20-25% will be the sweet spot for dip-buying.
Your job is to be ready to take advantage when it comes. pic.twitter.com/xrI7iKfiPR
— Jelle (@CryptoJelleNL) March 1, 2024
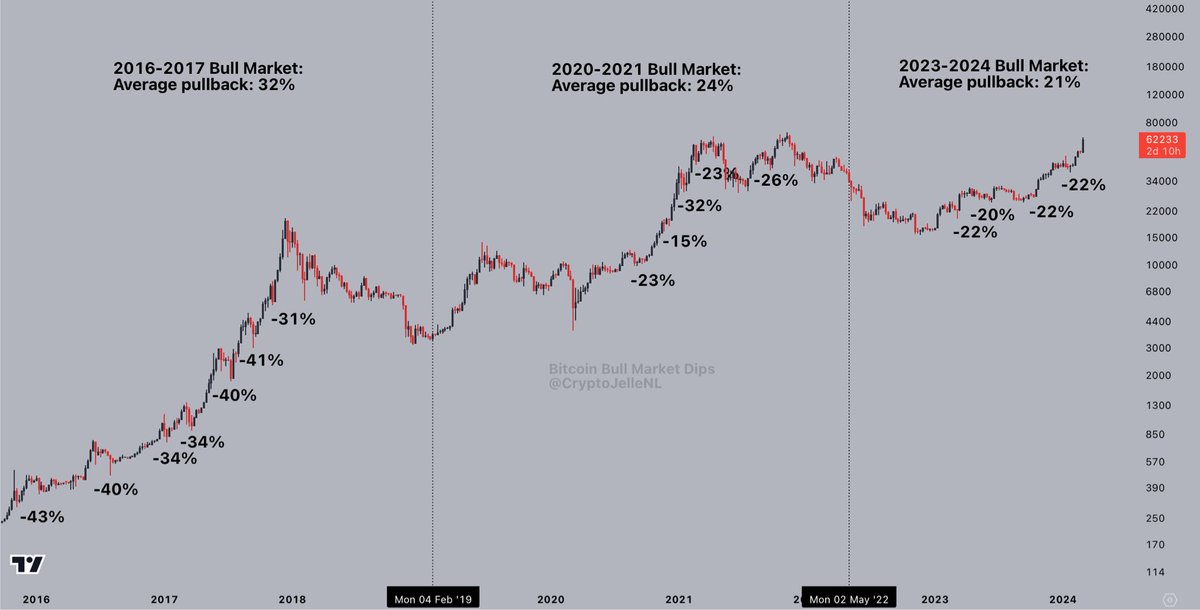
This perspective gains further credence when examining the diminishing severity of corrections as the market matures; the 2016-2017 Bitcoin cycle was characterized by seven substantial corrections, with an average pullback of 32%, significantly impacting investor sentiment and portfolio values.
In the subsequent cycle that propelled BTC to its current all-time high of $69,000, the market conditions were considerably more lenient for bullish investors: experiencing five downturns, the average decline was limited to 24%.
Fast forward to the present cycle, and the landscape appears somewhat different. With only four notable corrections recorded so far and an average pullback of 21%, Bitcoin should see a notable pullback, though not as harsh as previous ones. This indicates the market’s growing maturity.
Additionally, this evolution suggests that while corrections remain a staple of the Bitcoin experience, their capacity to deter the asset’s long-term trajectory diminishes.
Navigating Bitcoin Upcoming Corrections
The potential correction for Bitcoin, as indicated by CryptoJelleNL is echoed by other market observers. Galaxy Digital Holdings CEO Michael Novogratz has also highlighted the possibility of a temporary dip, attributing it to factors such as excessive leverage among younger investors.
Despite these forecasts, Bitcoin’s current momentum remains strong, with recent price action showing a near 2% increase in the past 24 hours, underscoring the asset’s sturdy appeal.
In addition to speculative analysis, real-world examples of investor success stories provide tangible evidence of Bitcoin’s enduring allure. A notable instance is a smart whale who, per lookonchain analytics, invested $1.39 billion in Bitcoin in July 2022 at an average price of $21,629 per BTC.
With BTC price now surging past the $62,000 mark, this investor’s unrealized profit is a testament to the strategic potential of timely market entry and the value of patience in the face of volatility.
A smart whale has accumulated 22,670 $BTC($1.39B) at an average price of $21,629 since $BTC entered the bear market in July 2022.
He currently has an unrealized profit of more than $900M!https://t.co/gT1kfWq5YF pic.twitter.com/BTcijZB0IA
— Lookonchain (@lookonchain) March 1, 2024
Featured image from Unpslah, Chart from TradingView
Bitcoin Bulls On The Charge: Crypto Platform Forecasts $63K Surge By March
Prominent digital asset financial services platform Matrixport has recently issued a bullish projection indicating a potential surge in Bitcoin’s (BTC) value. According to their analysis, Bitcoin may surpass its previously established two-year peak and climb to $63,000 by next month.
This bold prediction stems from a confluence of factors poised to exert significant influence on the trajectory of Bitcoin’s price in the coming weeks and months.
Rationale Behind Matrixport’s Optimistic Projection
The primary driver behind Matrixport’s optimistic outlook is the live trading of Bitcoin spot Exchange-Traded Funds (ETFs). According to the report, these spot ETFs have opened the doors for more investors to engage in crypto trading through conventional financial channels.
Additionally, with the increasing demand for these spot ETFs and the daily trading volumes reaching noteworthy levels, signaling growing investor interest in Bitcoin as an asset class, this could help propel the flagship crypto to trade above $60,000 by next month, according to the report.
[1/3] Bitcoin ETF Flow – Up to 22 Feb 2024
All data in. +$251.4m net flow on 22nd Feb. A strong day. pic.twitter.com/IdrCmgq5u8
— BitMEX Research (@BitMEXResearch) February 23, 2024
Furthermore, the impending Bitcoin halving event, scheduled for April 2024, is anticipated to catalyze further upward momentum in BTC prices. Bitcoin halvings result in a reduction in the rate of new BTC generation, and historically, this leads to a decrease in supply, typically driving up Bitcoin’s value.
Matrixport’s report also mentions the influence of macroeconomic factors on BTC’s price. The expectations of interest rate adjustments following the Federal Reserve’s Federal Open Market Committee (FOMC) gatherings are anticipated to have a significant impact.
Furthermore, the forthcoming uncertainty surrounding the US presidential elections may instigate market fluctuations, leading investors to turn to alternative assets such as Bitcoin to safeguard against potential shifts in economic policies.
Bitcoin Price Action And Expert Sentiments
Meanwhile, despite Bitcoin experiencing a nearly 10% surge over the past 14 days, the asset has witnessed quite a retracement in the previous week, declining by 2.2%. It’s worth noting that despite this setback, the cryptocurrency’s market capitalization remains above the $1 trillion mark.
An analyst known as Mags has expressed an overwhelmingly bullish sentiment toward Bitcoin, noting that the asset has “never been this bullish.” Mags city’s historical patterns and bullish technical signals reveal that BTC has recently closed a weekly candle above the 0.618 Fibonacci level, a rare occurrence in the cryptocurrency’s four-year cycle.
#Bitcoin has never been this bullish
For the first time ever, BTC is deviating from the 4 year cycle by closing a weekly candle above the 0.618 level before the halving event.
The best part about this deviation is it’s a bullish one, with the rise in demand among institutional… pic.twitter.com/F9xpTbEZ1d
— Mags (@thescalpingpro) February 22, 2024
However, Mike Novogratz, CEO of Galaxy Digital, has cautioned against potential downside risks, speculating on the possibility of a regulatory setback or market sentiment shift that could lower BTC prices to the $45,000-$42,000 range.
Featured image from Unsplash, Chart from TradingView
XRP On The Brink: Urgent Call For Bulls As Analysts Predict Dire Correction Ahead
XRP is currently at a critical juncture, as crypto analyst CoinsKid has pointed out. The analyst has raised concerns about the altcoin’s immediate future and emphasizes the urgent need for bullish momentum to prevent a significant downturn.
Bulls Should Step In Quick
In the post shared on X, CoinsKid stressed that if the bulls don’t step in soon, XRP could face a drastic “macro correction,” potentially plummeting its price toward the $0.38 level. This warning follows a period of declining prices for XRP, which has seen the asset struggle to maintain its value.
The analyst elaborated, “Squeaky bum time. TICK TOCK,” highlighting the urgency and the nervous anticipation surrounding XRP’s price movement in the coming days.
This sentiment reflects a broader concern among XRP investors and market observers. The lack of bullish activity in the recent period has left XRP vulnerable to further losses, raising fears that it could slide to its lowest levels in months.
The potential drop to $0.38 would represent a loss in value and mark a new phase of uncertainty for the cryptocurrency. This comes when the broader crypto market is experiencing its own challenges, with various assets facing downward pressure.
We need to see the bulls step in here for #xrp. Otherwise, we could see a bigger macro correction play out towards the 0.786 at $0.38
Squeaky bum time. TICK TOCK pic.twitter.com/jKlBsiXu6h
— CoinsKid (@Coins_Kid) January 19, 2024
XRP Price Action And Bearish Confirmation
XRP’s recent market performance has been far from reassuring for its holders. Over the past week, the asset has seen a decline of more than 10%, and so far, this bearish trend shows no signs of abating. The altcoin is trading below $0.53, a drop of nearly 5% in the past 24 hours.
This downward trajectory is further corroborated by crypto analyst Ali, who has pointed out that should XRP breach the $0.55 level, the altcoin could tumble down to as low as $0.34. Such a drop would take the altcoin to a price point not seen since April 2023, an alarming prospect for investors and the XRP community.
$XRP is currently grappling to maintain its footing at the crucial $0.55 support level. Should this support fail to hold, be prepared for a possible sell-off scenario that could see #XRP descending toward $0.34! pic.twitter.com/6oKObjpnnm
— Ali (@ali_charts) January 18, 2024
Despite this downturn, XRP’s daily trading volume has remained relatively stable, fluctuating between $1.4 billion and $1.2 billion over the past week. At the time of writing, Altcoin’s trading volume was around $1.28 billion.
Featured image from Unsplash, Chart from Tradingview
Tether Strikes Gold In Bitcoin: Profits Soar Above $1 Billion Amid Bull Market
Tether, known for its USDT stablecoin, has recently made headlines with its Bitcoin holdings soaring in value, generating a profit exceeding $1 billion.
Notably, this significant financial gain can be attributed to the stablecoin issuer’s approach of buying Bitcoin using a portion of its net profits. This move has proven highly lucrative amid the recent surge in BTC prices.
According to reporter Wu Blockchain, Tether’s holdings currently stand at 57,576 BTC, valued at an estimated $2.4 billion. These holdings were acquired at an average rate of $22,480 per BTC, reflecting a savvy investment strategy in the volatile crypto market.
Tether’s holdings of BTC currently have a profit of $1.1 billion (+85%). Tether currently holds a total of 57,576 BTC ($2.4B), with a cost of $22,480 per bitcoin. Among them, 53,492 BTC were reserved before March this year, and 4,083 BTC were purchased regularly using 15% of…
— Wu Blockchain (@WuBlockchain) December 5, 2023
The recent surge in Bitcoin’s value, which has surpassed the $41,000 mark, has been a major contributor to Tether’s significant profit margin, showcasing the potential of strategic crypto investments.
BTC Accumulation And Market Impact
The notable profit realized by Tether is the result of its investment strategy implemented in May 2023. The company began allocating up to 15% of its net realized operating profits towards Bitcoin purchases.
This strategic decision has not only diversified Tether’s investment portfolio but also aligned the company with Bitcoin’s potential as a “transformative” technology, according to Tether’s CTO Paolo Ardoino.
Paolo Ardoino noted that the choice to invest in Bitcoin was based on its decentralized nature, limited supply, and growing global adoption. Ardoino emphasized Bitcoin’s “resilience” as a “long-term store of value” and its potential to reshape business and lifestyle paradigms.
The Tether CTO stated:
Our investment in Bitcoin is not only a way to enhance the performance of our portfolio, but it is also a method of aligning ourselves with a transformative technology that has the potential to reshape the way we conduct business and live our lives.
As of the first quarter of 2023, Tether’s BTC reserves were valued at around $1.5 billion, a testament to the success of its Bitcoin accumulation strategy.
Bitcoin Rains Profits
The ongoing bull run in the crypto market has benefitted Tether and other prominent Bitcoin proponents. Max Keiser, a well-known trader and BTC supporter in the crypto community, recently revealed a significant surge in his Bitcoin holdings on X.
I’m up 20,000,000% since 2011 with my #Bitcoin https://t.co/nfj4AMSgmR
— Max Keiser (@maxkeiser) December 4, 2023
Keiser, who has been investing in Bitcoin since 2011, recognized the potential of BTC early on. While Keiser has not publicly disclosed the exact amount of BTC he owns, it’s clear that his early investment has paid off handsomely over the years.
Featured image from iStock, Chart from TradingView
Here Are Four Crypto Assets Poised For A Major Price Explosion – Analyst
The general crypto market has recorded a slight boost in the last week as market leader Bitcoin surged by 4.44% to trade above the $39,000 price mark. As bullish sentiments continue to rise, popular crypto analyst Austin Arnold has now highlighted four tokens that offer investors a high potential for profitability in the coming weeks.
Top Crypto Tokens Set For A Massive Price Rally – Austin Arnold
Speaking in a recently published video on his YouTube channel Altcoin Daily, Arnold stated that certain tokens are “set to rip through the crypto markets.”
The first cryptocurrency he highlights is Injective (INJ), a layer 1 blockchain and decentralized protocol backed by Binance, Pantera, and renowned tech billionaire Mark Cuban. Arnold states that Injective’s potential for a massive price surge is tied to multiple factors, including its impressive tokenomics facilitated by its buyback and burn auction system.
This is a process in which Injective utilizes 60% of all fees collected across its multiple native dApps to buy back INJ from the market. The bought INJ is then burned, allowing the token to maintain a controlled supply and increase market value.
Furthermore, Injective currently possesses one of the lowest network fees in the market, which is considered an attractive feature for most users and developers. In addition, the Cosmos-SDK built protocol is also set to undergo its largest mainnet upgrade – Volan Upgrade – in the next few weeks.
Joining Injective on Arnold’s list is Chainlink (LINK), an Ethereum-based decentralized blockchain oracle network. The crypto analyst notes that Chainlink recently celebrated a milestone of 2,000 integrations and projects, which only underlines the network’s appeal to developers and the wider crypto community.
Furthermore, Arnold lauds Chainlink for its multiple strategic partnerships with major traditional institutions, including the SWIFT banking system and the Depository Trust and Clearing Corporation (DTCC), which could drive institutional adoption of the crypto project.
In addition, Chainlink recently launched an upgraded staking mechanism, which introduces greater flexibility, better security guarantees for oracle services, and a modular architecture, all of which Arnold believes’ contributes to the cryptocurrency’s potential for massive price gain soon.
Bitcoin And Ethereum Await Spot ETF Boost
The final cryptocurrencies on Austen Arnold’s list are, unsurprisingly, the two biggest assets in the market, namely Bitcoin and Ethereum.
For Bitcoin, The crypto analyst notes that crypto whales have been stocking up their supply of the premier cryptocurrency, citing an example of Michael Saylor’s Microstrategy. In addition, he also references an impending rise in BTC’s institutional demand, which hinges on the approval of a spot exchange-traded fund (ETF).
In addition, Arnold pinpoints there is also a rising interest in Ethereum as more asset managers continue to approach the US Securities and Exchange Commission with applications to launch an Ether Spot ETF. This development was revealed by American investor Ric Edelman, who personally claims to be more excited about Ethereum than Bitcoin, as it offers more technological capability and commercial applications.
New Zealand Is Not Exploring Crypto Regulation, but Recommends Increased Vigilance
After receiving 50 submissions as part of a consultation process, the Reserve Bank of New Zealand (RBNZ) has said it won’t propose a regulatory approach towards stablecoins and crypto-assets.
Leaked bids: Binance, Galaxy Digital among secret bidders for Celsius assets


Crypto blogger Tiffany Fong has shared documents she claims to have obtained in late December detailing several bids for Celsius’ crypto assets.


