Crypto Sentiment Index Stays Bullish Despite Corrections, Report Reveals Positive Outlook

In a recent blog post, ETC Group’s Head of Research, Andre Dragosh, provided a comprehensive analysis of the current state of the crypto market. Dragosh’s findings shed light on the market’s performance dynamics, profit-taking activity, and derivative trends.

High-Risk Appetite In Crypto Market

According to Dragosh’s analysis, crypto assets showcased their resilience as they outperformed traditional assets like equities, supported by a significant repricing in monetary policy expectations and short futures liquidations at the beginning of last week. 

However, this outperformance encountered some limitations in the short term due to stronger-than-expected US jobs data, which began to dampen the recent rally. The US non-farm payroll growth and unemployment rate surpassed consensus estimates, leading to a reversal in US Treasury yields and a decrease in overall risk appetite across traditional financial markets.

Notably, altcoin outperformance gained momentum during the period, with Avalanche (AVAX) and Cardano (ADA) returning over 50% each. Among the top 10 crypto assets, Avalanche, Cardano, and Polkadot (DOT) stood out as the relative outperformers. 

According to Dragosh, this surge in altcoin outperformance compared to Bitcoin (BTC) indicates a “high-risk appetite” within the crypto market. On the other hand, on-chain data for Bitcoin suggests that investors are increasingly taking profits, evidenced by the rising number of coins in profit being sent to exchanges.
Crypto

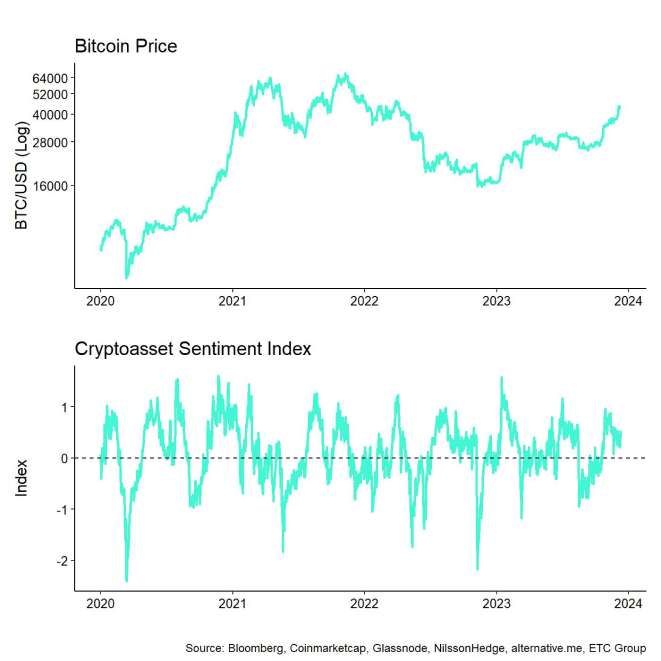
ETC Group’s in-house Crypto Asset Sentiment Index remained relatively elevated compared to the previous week, indicating positive market sentiment. However, major reversals to the downside were observed in the Crypto Dispersion Index and the BTC 25-delta 1-month option skew. 

The Crypto Fear & Greed Index continued to reside in “Greed” territory, reflecting ongoing market optimism. Although ETC Group’s Cross Asset Risk Appetite (CARA) measure declined slightly, it remained in positive territory, signaling a decrease in risk appetite in traditional financial markets.

Performance dispersion among digital assets decreased compared to the previous week but remained relatively high. This implies that correlations among crypto assets have decreased, and investments are driven by coin-specific factors, highlighting the importance of diversification among digital assets.

Short-Term Holders Cash In

The market remains in a strong profit environment, with a significant percentage of BTC and ETH addresses in profit. According to Dragosh, profit-taking activity, particularly among short-term holders, has increased as Bitcoin approaches recent highs, leading to higher selling pressure. 

Long-term holders have also increased their transfers of profitable coins to exchanges, potentially hindering short-term price increases. However, it is worth noting that there is no evidence of older coins being spent, which would indicate a larger price correction.

On the other hand, aggregate open interest in BTC futures and perpetual remained stable, with notable futures short liquidations recorded. BTC option open interest saw a significant increase, accompanied by relative put-buying and an increase in the put-call open interest ratio. 

The 25-delta BTC option skews also increased, indicating higher demand for puts compared to calls. However, overall at-the-money (ATM) implied volatilities did not change significantly.

Crypto

At the time of writing, BTC has lost its $42,000 support line, trading at $41,600, down 5% in the last 24 hours.

Featured image from Shutterstock, chart from TradingView.com 

Crypto Market Back To High Correlation As All Indexes Closely Follow Bitcoin

Data shows the crypto market has become highly correlation again in the past week as all indexes have been closing following Bitcoin.

All Market Cap Weighted Crypto Indexes Have Been Moving Together Recently

According to the latest weekly report from Arcane Research, the 30-day ETH-BTC correlation now has a value of 0.95.

To assess the performance of the different portions of the market as a whole, the coins are divided into the “crypto indexes.” The criteria for putting any asset into an index is using its market cap.

The “market cap” here simply refers to a measure of the total worth of a cryptocurrency’s entire circulating supply.

There are three main categories of indexes: the “large caps,” the “mid caps,” and the “small caps.” As their names already imply, these indexes give a look at how the different sized coins are doing right now.

Here is a chart that shows how each of these altcoin indexes have performed against Bitcoin during the last month:

Bitcoin Vs Altcoins

Looks like the small caps have performed the worst in recent days | Source: Arcane Research’s Ahead of the Curve – November 22

As you can see in the above graph, the market cap weighted indexes didn’t diverge too much during the past month, but in the last week especially they have been following each other very closely.

Both Bitcoin and the mid caps currently stand at exactly 18% in the red during the period of the last thirty days, while the large caps have also only minimally performed worse as the index’s returns are at 19% currently.

The small caps have taken a noticeably higher hit than the rest of the pack, as this index is 23% underwater in this timespan.

As is apparent from the data, assets across the crypto market have become pretty correlated in recent days.

The report additionally notes that the 30-day rolling correlation between Bitcoin and Ethereum has now hit a value of 0.95. The correlation metric can have a maximum value of 1, which means these two cryptos are now almost fully moving in tandem.

Since the year 2016, the BTC-ETH correlation has only been seen at such high levels for 3% of the total time.

Bitcoin Price

At the time of writing, Bitcoin’s price floats around $16.4k, down 1% in the last week. Below is a chart that shows the recent trend in the value of the crypto.

Bitcoin Price Chart

The price of the coin seems to have made some recovery from the plunge below $16k during the last couple of days | Source: BTCUSD on TradingView
Featured image from Art Rachen on Unsplash.com, charts from TradingView.com, Arcane Research