Ethereum Bull Flag Breakout: ATH On The Horizon As Major Metrics Turn Bullish

Crypto analyst Javon Marks has highlighted several metrics that have turned bullish for Ethereum (ETH). The analyst noted that one of these metrics suggests an all-time high (ATH) for the second-largest crypto token. 

Bullish Metrics For Ethereum

Marks remarked in an X (formerly Twitter) post that the bull flag-like price structure has formed on the Ethereum chart. He added that higher lows are forming in Ethereum’s price action, which is also a bullish signal as it suggests a strong resistance to downward trends. Meanwhile, the analyst claims lower lows in the Relative Strength Index (RSI) indicate a hidden bullish divergence with Ethereum’s price.

Ethereum 1

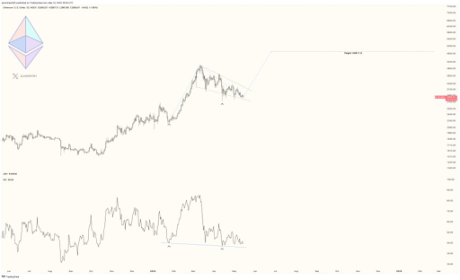
Marks then raised the possibility of Ethereum hitting a new ATH, stating that the “bull flag breakout might lead into new all-time highs and be of major service in many Altcoin progressions.” Before then, he claimed that Ethereum could soon experience a larger price breakout, making the crypto token experience a 63% upside to $4,811.

Crypto analyst Michaël van de Poppe also recently suggested that Ethereum could make a major move soon enough and lead altcoins to make new highs. According to him, this will be triggered by the news surrounding the Ethereum ETF, as he expects that to be the “rotation for the Altcoins.”

Ethereum 2

However, Ethereum also risks experiencing a significant decline, considering reports that the Securities and Exchange Commission (SEC) might reject the Ethereum ETF applications. Crypto analyst James Van Straten stated that a rejection of the Spot ETF “sends the ETHBTC ratio lower 0.047 to 0.03 as a long-term projection.”

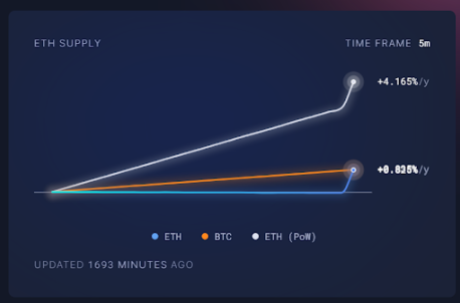
This was one of the reasons why the analyst stated that “Ethereum looks like it’s going to the grave.” He also alluded to the fact that ETH has become inflationary with the Decun upgrade reducing transaction fees, which has ultimately reduced ETH’s burn rate. 

Ethereum 3

Things Aren’t Looking Good For ETH

Crypto analyst Derek recently mentioned that “Ethereum dominance and recent performance are heading toward their worst ever.” He noted that attention has turned to Bitcoin due to the reports about a potential rejection of the Ethereum ETF and securities status, which has put pressure on investment sentiment. According to him, this has caused the “imbalance in dominance” to reach its worst point. 

Derek further noted that Ethereum’s unimpressive price action is affecting other altcoins, as their prices are “depressed.” He also claimed that the prices of layer two coins “continued to be under pressure.” The analyst suggested that things could get worse, as the ETH/BTC chart shows a downward wedge pattern in progress. He claims that altcoins can only “breathe” if Ethereum can escape this pattern quickly.

At the time of writing, Ethereum is trading at around $2906, down in the last 24 hours according to data from CoinMarketCap. 

Ethereum price chart from Tradingview.com

Bitcoin Analyst Reveals Why $57,938 Is The Level To Watch This Week

Crypto analyst CryptoCon has revealed a key level to watch out for as Bitcoin attempts to break critical resistance levels. The analyst suggested that a drop to this price level may not be bad for Bitcoin and could instead be necessary for it to finally make that price rally. 

$57,938 Is The Price Level To Keep An Eye On

CryptoCon mentioned in an X (formerly Twitter) post that $57,938 is the “new price to watch for the 20-week EMA (Exponential Moving Average).” He noted that such a price drop might be necessary, stating that “boredom and sideways price action allow room for growth.” Based on his analysis, any potential price decline that Bitcoin experiences is a healthy correction and shouldn’t be considered a bearish reversal. 

Bitcoin 1

Meanwhile, Bitcoin is showing impressive strength on the charts, with CryptoCon stating that the flagship crypto “continues to hold the 20-week EMA as support while visiting the almost absolute bottom of the cycle 4 DMI support zone.” CryptoCon’s positive outlook for Bitcoin provides assurance that a parabolic move is still on the horizon. 

Crypto analyst Rekt Capital also recently shared a positive outlook for Bitcoin. He revealed that Bitcoin was out of the “Danger Zone,” suggesting that the flagship crypto was primed for a move to the upside. The analyst also remarked that Bitcoin was running out of unremarkable months before it began its parabolic phase. 

Crypto analyst Mikybull Crypto hinted that Bitcoin was already showing signs of this imminent parabolic phase. In an X post, he mentioned that Bitcoin was displaying a cup and handle reversal pattern on the weekly chart and that the “breakout will be explosive and will send it to a cycle top.”

Bitcoin 2

While agreeing with Mikybull Crypto’s analysis, Crypto analyst BitQuant mentioned that $95,000 will be “achieved in one move, and that is quite obvious.” He, however, noted that it remains uncertain when this move will happen and called for patience as everyone waits for Bitcoin “to perform as expected.”

BitQuant further advised that it might be better to leave the market for those who can’t “avoid the torture,” claiming that there “will be a lot of pain for those with weak nerves” in the coming months. Based on Arthur Hayes’s prediction, investors might have to wait until August for that big move from the flagship crypto. 

Bitcoin Is Still Far From Its Market Top

In a recent X post, Rekt Capital suggested that Bitcoin was still far from its market top. He highlighted past cycles, which show that the bull market peak usually occurs between 518 and 546 days after the halving. Based on this, the analyst predicts that the flagship crypto will likely peak in September or October 2025. 

Bitcoin 3

The crypto analyst also acknowledged that Bitcoin has been accelerating in this cycle by over 200 days. However, he remarked that Bitcoin could resynchronize with past halving cycles if it continues to consolidate for longer. 

Bitcoin price chart from Tradingview.com

Crypto Analyst Shares Top AI Altcoin Investments This Month

In an analysis of the current landscape at the nexus of artificial intelligence and altcoins, crypto analyst Prithvir (@Prithvir12) recently shared insights via X that highlight both the opportunities and pitfalls in the AI coin market this month. His analysis covers upcoming AI catalysts, their impact on specific tokens, and personal investment recommendations, shedding light on the nuanced strategies required in this volatile segment.

In-Depth Look At The AI Crypto Market

Prithvir underlines a series of significant events in the AI space that are anticipated to directly impact the crypto markets. He first points to NVIDIA’s earnings announcement scheduled for May 22nd, emphasizing NVIDIA’s pivotal role in AI technology, which could have cascading effects on AI-centric cryptocurrencies.

Further stirring the market is the buzz around OpenAI’s GPT-4oT. Moreover, Prithvir discusses the influence of major tech conferences focused on AI advancements, notably Google’s I/O conference and Apple’s emphasis on AI at its upcoming Worldwide Developers Conference (WWDC). He predicts these events are poised to introduce new AI initiatives that could impact crypto markets.

In his post, Prithvir also analyzes several tokens that have responded differently to these AI catalysts. He describes WLD, associated with OpenAI through Sam Altman, which experienced a 20% drop in price last week, a typical “sell the news” reaction post the GPT-4o announcement. He expresses concerns about WLD’s “ridiculous tokenomics” and the risks posed by potential coordinated short squeezes, advising traders to approach with caution.

Prithvir also touches upon OLAS, which, despite losing some visibility since its peak in 2023, remains active on the Gnosis chain and could be poised for a comeback depending on market conditions and developments within its platform, according to the analyst.

The token SPEC, however, has shown significant volatility, skyrocketing from $5 to $15 and then retracting to $8 within two weeks. Prithvir critiques its high fully diluted valuation (FDV) close to $1 billion, warning of the speculative nature and the inherent risks of engaging with such a volatile asset.

Lastly, he addresses the group of ASI tokens FET, AGIX and OCEAN, representing the Super Intelligence Alliance, noting that their once-leading positions in AI-driven market rallies have dwindled. According to Prithvir, these tokens are currently overvalued, with limited upside potential, indicating a saturated market state for these assets.

Prithvir’s Top Altcoin Picks

Navigating through the complexities of the AI coin market, Prithvir shares his preferred investment strategies and picks. He highlights Render (RNDR) as a favorable choice, especially leading up to NVIDIA’s earnings and Apple’s WWDC, due to its direct ties to their technologies and expected feature enhancements which might boost its value.

NVIDIA due to comparisons of GPU networks and Apple due to the rendering software they have built that Apple always features at different keynotes. Hence, I think this could be a good swing trade leading up to WWDC Time period – 3 weeks,” the analyst stated.

AR is Prithvir’s “biggest AI coin holding currently.” The project is praised by him for its pivot to AI functionalities with the AO Computer and robust team. The presence of AR on Tier-1 exchanges and its substantial backing makes it a “no-brainer” for a medium-term hold.

He also mentions NEAR, albeit with a smaller investment footprint due to the perceived limited upside. “Smaller position than AR due to more limited upside. But could become one of the consensus AI trades of this cycle due to its brand value, good liquidity and innovations in other sectors such as Chain Abstraction,” Prithvir wrote via X.

At press time, RNDR traded at $10.1089.

Render RNDR token price

XRP Set For Major Upswing: Top Analyst Reveals Timing For $10-$20 Price Milestone

XRP, the cryptocurrency associated with Ripple, has been locked in a lengthy period of consolidation, trading between $0.300 and $0.600 for the past seven years. 

Despite a brief surge during the 2021 bull run that saw XRP reach a three-year high of $1.9 in April, the token has since returned to its range, lacking the bullish momentum to overcome upper resistance levels. 

However, some crypto analysts are now predicting a major uptrend for XRP in the coming months, potentially propelling it to new heights.

Analysts Anticipate XRP Breakout

A technical analyst using the pseudonym “U-COPY” on the social media site X (formerly Twitter) suggests that XRP could experience significant movement between May 15 and August. 

U-COPY points out that XRP has been slowly moving up from its previous low at $0.46 and is nearing the end of a long triangle formation, which has been in accumulation since 2018. 

The analyst believes that XRP’s real potential will be revealed in the fully formed bull cycle, with the token possibly experiencing substantial growth by the end of the year.

Supporting this bullish outlook, another analyst, Armando Pantoja, proposes that the crypto bull run could begin in September or October 2025, with XRP potentially reaching a price of $0.75. 

Pantoja further suggests that if former US President Trump wins the election and the Securities and Exchange Commission (SEC) eases its stance on cryptocurrencies, XRP could be propelled to higher levels. 

This change in regulatory dynamics, combined with the ongoing legal battle between Ripple and the SEC, may increase the likelihood of XRP gaining approval for an exchange-traded fund (ETF) similar to Bitcoin. 

Pantoja outlines a price range of $1-2 for an XRP ETF announcement in early 2025. If interest rates are cut multiple times during the same period, XRP could potentially reach $5-10. Ultimately, Pantoja predicts the possibility of XRP hitting $10-$20 by the fourth quarter of 2025 or the first quarter of 2026.

‘Buy the Dip’ Opportunity? 

According to market intelligence platform Santiment, The XRP Ledger (XRPL) has recently witnessed a notable increase in the movement of dormant tokens, signaling a potential shift in market dynamics for the token. 

Coinciding with the opening of May, the company’s Token Age Consumed metric reveals a spike in the transfer of old coins, reminiscent of a similar occurrence in April, just before a significant downturn in the market. During that period, XRP experienced a sharp decline in value, dropping by 16%.

However, in contrast to the previous event, Santiment suggests that there is a “compelling argument” that this current surge in old coin movement might be attributed to the interest of key stakeholders looking to “buy the dip.” 

Furthermore, it is worth noting the growing open interest in exchanges, which has recently reached a three-week high. This uptick in open interest indicates increased active positions in XRP, potentially reflecting growing market participation and heightened trading activity.

Considering these factors together—the surge in dormant token activity, the potential buy-the-dip interest from key stakeholders, and the rising open interest on exchanges—there appears to be a shift in sentiment surrounding XRP. 

XRP

At press time, the seventh-largest cryptocurrency trades at $0.5020, down over 7% in the past week alone and 1% in the past 24 hours. 

Featured image from Shutterstock, chart from TradingView.com 

Bitcoin, Ethereum, And Solana: Galaxy Digital CEO Predicts Next Market Movements

Mike Novogratz, the CEO and founder of Galaxy Digital, shared his insights on the current state of the cryptocurrency market. According to Bloomberg, Novogratz predicts that Bitcoin (BTC) will likely remain within a relatively narrow trading range for the current quarter as the adoption of cryptocurrencies in traditional finance continues to evolve.

Stagnant Crypto Market

Per the report, Novogratz described the current phase in the crypto market as a consolidation period. He emphasized that Bitcoin, Ethereum (ETH), and other cryptocurrencies, including Solana (SOL), are expected to consolidate. 

This consolidation phase suggests that the Bitcoin price will likely trade within a range of approximately $55,000 to $75,000 until significant market events drive prices higher.

The crypto market has experienced a period of stagnation following the historic bull run witnessed in the past two quarters. This surge was fueled by the launch of spot US Bitcoin exchange-traded funds (ETFs) and the Bitcoin Halving, which reduced the supply of new BTC. 

However, Bitcoin’s price trend reversed due to diminishing optimism surrounding interest rate cuts by the Federal Reserve (Fed), amid consistently strong economic indicators.

According to Novogratz’s analysis, if his predictions hold, Solana could continue to consolidate within its current trading range of $120 to $150. This consolidation has been observed over the past month, indicating a period of stability for the cryptocurrency.

Similarly, Ethereum’s price has closely mirrored Bitcoin’s movements and has traded between the $2,870 and $3,200 levels. 

Ethereum recently failed to consolidate above the significant $4,000 mark reached in mid-March. As a result, Ethereum has experienced a period of price consolidation within the range above.

Bitcoin Volatility Persists

Novogratz acknowledged the tailwinds that propelled the market during the fourth quarter of 2023 and the first quarter of 2024. 

Galaxy’s CEO believes that these tailwinds will likely persist throughout the current quarter and possibly the next unless there are significant developments, such as the Fed initiating rate cuts due to an economic slowdown or until the regulatory landscape becomes clearer after the upcoming election.

Moreover, Novogratz noted a significant shift in counterparties’ willingness to lend crypto for extended periods without collateral, a trend that was not prevalent just six months ago. He emphasized that engagement in the crypto space has reached a new level, with growing interest from individuals and institutions alike.

On Tuesday, Bitcoin experienced a 2.7% decline, trading at $61,400. Since achieving a record high of $73,700 on March 14, the largest cryptocurrency in the market has undergone a 16% decline. Despite this, Galaxy Digital reported notable first-quarter results, with net income more than tripling to $421.7 million. 

Bitcoin

Featured image from Shutterstock, chart from TradingView.com 

Shiba Inu Volume Flips Dogecoin, Will SHIB Price Flip DOGE If This Analyst’s Prediction Comes True?

Shiba Inu is up by 7% in the past 24 hours amidst an uptick in the meme coin market, coming ahead of Dogecoin at this time. The meme coin niche has witnessed a strong resurgence in the past day, with the entire niche up by 7.82%. Shiba Inu has particularly done well and witnessed a strong volume of interest amidst this uptick. Interestingly, this uptick in volume for SHIB has surpassed DOGE, with on-chain data suggesting SHIB could do better in the short term. At the same time, crypto analyst Ali Martinez has revealed a phenomenon that could lead to a 20% upswing for SHIB.

Shiba Inu Volume Flips Dogecoin

Data from Coinmarketcap shows that Shiba Inu has witnessed a trading volume increase of 320% in the past 24 hours. The metric, on Dogecoin’s side, was an increase of 160%. The crypto, which has been trading inside a descending channel for a while, is now appearing to make a push above. 

Related Reading: Analyst Who Predicted Solana’s 1,100% Move Reveals Where The Altcoin Is Headed Next

Although current data from analytics platform IntoTheBlock (ITB) suggests DOGE is still holding on for a longer-term overperformance over SHIB, SHIB is starting to position itself to outperform DOGE in the short term on a cost basis. According to ITB’s holding by time metric, DOGE has seen a 1.86% increase in the number of holders in the past 30 days, compared to a 0.43% increase for SHIB. ITB terms holders as passive investors that have held the asset for more than one year. 

However, the number of cruisers (investors holding between 1 to 12 months) flips the short-term interest in the favor of SHIB. As of this writing, SHIB’s cruisers have increased by +5.69% in a 30-day timeframe. The metric, on DOGE’s side, shows a 2.44% decrease.

Shiba inu

SHIB To Breakout Of Parallel Channel

The recent increase in volume and short-term activity suggests that SHIB is ready to break out of a descending parallel channel of lower highs. As pointed out on social media by crypto analyst Ali Martinez, SHIB has been trading in a descending parallel channel since the last week of April. Current price action shows SHIB is now at the upper end of the descending and is at a critical junction for a breakout or reversal. 

Related Reading: Analyst Points Out Level To Beat If Bitcoin Is To Reach $76,000

According to the analyst, a breakout from this channel at $0.00002444 could lead to another 20% upswing to $0.00002954. The price target serves as the highest point of the descending channel under consideration. A further surge could see SHIB returning back to the $0.00003 price territory. 

At the time of writing, SHIB is trading at $0.0000236. Failure to break above $0.00002444 could send the cryptocurrency back down as far as $0.0000211.

Shiba Inu price chart from Tradingview.com (Dogecoin)

This Crypto Expert Called The Bitcoin Top in 2021, Now He’s Calling The Bottom In 2024

As the Bitcoin price continues to fluctuate wildly, the question in every investor’s mouth right now is when the digital asset will find its bottom. For some, the bottom has already been met, while for others, there are still more price crashes to come. However, one analyst’s prediction in particular stands out and this is due to his track record of accurately calling the top of the market back in the 2021 bull market.

Crypto Expert Says Bitcoin Bottom Is In

Crypto expert Dave the Wave first came into prominence back in 2021 when he had accurately predicted the Bitcoin top. Given this, Dave’s analysis holds weight in the crypto market, so it is no surprise that his most recent prediction calling the Bitcoin bottom is making the rounds.

Related Reading: Gaming The System: Pundit Reveals Why XRP Price Will Reach $33

In the analysis which was posted on X (formerly Twitter), the crypto analyst points to a number of indicators that show that the Bitcoin bottom has already been reached. One of these is the MACD which the analyst reveals is still far off from the levels from the last bull market.

In addition to the MACD still trending below this level, the crypto expert points out that the crypto market is more mature than it was. Given this maturing market, Dave the Wave stated: “It wouldn’t at all surprise me to see something different develop, pattern-wise, over the longer time frame.”

The analyst suggests that the Bitcoin low is actually in, and given that the price had fallen to $57,000 a couple of weeks ago, Dave’s analysis suggests that that is as low as the price will go. If this holds, then it is possible that the Bitcoin price will not fall below $60,000 before it resumes its bull rally.

BTC Price Expectations Still Bullish

Despite the slow momentum that has plagued the Bitcoin price, investors continue to be bullish on the cryptocurrency. This is evidenced by the Bitcoin Fear & Greed Index maintaining a firm grip on the Greed territory, showing that investors are still willing to buy into the market.

Related Reading: Theta Network Breakout Imminent: Why A 100% Rise Is Possible From Here

Furthermore, predictions from crypto analysts such as Rekt Capital have shown expectations for further price increases. Rekt Capital predicts that the BTC price will still cross $100,000 as long as the price is able to break above $63,000 and hold this level.

However, elsewhere in social media, there is a change in tide for the BTC price as social sentiment begins to fall to bearish headwinds. Santiment, an on-chain data aggregation platform, revealed that the Bitcoin social sentiment has seen a 14% drop in the last week.

Bitcoin price chart from Tradingview.com

Gaming The System: Pundit Reveals Why XRP Price Will Reach $33

A crypto analyst has predicted a substantial bullish surge for the the XRP price in the future. According to the analyst, XRP is gearing up for a substantial increase to $33.5 from an initial price of $0.50. He expects the price of the cryptocurrency to explode by 6600% in this current market cycle.

Analyst Forecasts Exponential Rise In XRP Price

In a recent X (formerly Twitter) post, a crypto analyst identified as ‘Egrag Crypto,’ revealed a series of bullish price targets for XRP in the near future. The analyst focused his predictions on a technical analysis called “the Line of Hestia.” 

Related Reading: US Mega Banks JP Morgan And Wells Fargo Unveil Bitcoin Exposure As BTC Drops To $60,000

Egrag Crypto’s latest findings suggest that XRP could rise to $33.5 if it touches the Line of Hestia, a technical indicator featuring an ascending trend line which signals a potential upsurge for the price of a cryptocurrency. According to the analyst, “Historical data indicates that every time the XRP price touches the “Line of Hestia,” it experiences significant price pumps.” 

This implies that there may be a correlation between XRP’s bullish price movements and the ascending trend line. Egrag Crypto also revealed that following this historical pattern, XRP has witnessed pumps ranging from 6600%,1444%, 100%, 80%, and 171%. 

Given the established trend, Egrag Crypto predicts XRP’s ascent to new all-time highs. He calculated the average percentage increase of XRP’s price each time it touched the Line of Hestia, dividing the sum by the total number of occurrences, which is five. 

Using this data, the crypto analyst estimates that if XRP were to experience a 6600% increase, its future price would be $33.50. Similarly, he calculated new prices for XRP based on the previous percentages.

It’s important to note that the price of XRP, at the time of writing, is trading at $0.5. The cryptocurrency has been recording considerable declines over the past year, consolidating around the $0.5 price mark for months. According to CoinMarketCap, XRP has also recorded a 7.35% decrease over the past seven days and a 0.08% decline in the last 24 hours. 

Although Egrag Crypto has remained optimistic about XRP’s future price, other crypto community members have expressed skepticism over the analyst’s ambitious forecast. A few community members have denied the prediction, emphasizing that the cryptocurrency’s surge to $33.5 during this cycle was highly unlikely. 

Possible Price Correction Ahead Of Projected Surge

In one of his most recent X posts, Egrag Crypto disclosed that XRP could witness a major price correction before experiencing a significant rally. The analyst has urged crypto investors to remain cautious of the cryptocurrency unless the XRP/BTC ratio closes above the $0.00010 threshold. 

Related Reading: Is The Bitcoin Bottom In? Buy The Dip Sentiment Erodes Amid Drop Toward $60,000

Egrag Crypto anticipates a potential 45% decline for XRP/BTC, emphasizing that this substantial price drop could indicate a bottom between $0.0000055 and $0.0000077. However, he also disclosed that overcoming resistance at $0.00001 would be crucial for a rebound in XRP.  

XRP price chart from Tradingview.com

Aptos Posts Triple-Digit Gains In Key Metrics, Yet APT Price Struggles At $8.40

According to a report by Messari, Layer 1 (L1) blockchain Aptos experienced substantial gains in key metrics during the first quarter (Q1) of the year. The growth was driven by the surge in Bitcoin prices to new record highs and increased capital inflow in the market. 

However, Aptos’ native token, APT, has struggled with price performance, recording modest gains compared to other top cryptocurrencies.

Aptos Network Activity Surges

The report highlighted that Aptos’ circulating market cap increased 127% quarter-on-quarter (QoQ) to $6.6 billion.

This growth outpaced other projects with similar market caps, improving market cap rank from 33 to 22. Despite this growth, APT’s price experienced a more modest increase of 76% QoQ. 

Aptos

Aptos revenue, which encompasses all fees collected by the protocol, grew by 37% to $475,000. However, when denominated in APT, the revenue decreased by 10%. All revenue generated by Aptos is burned, but these burned tokens have not significantly reduced inflation. 

APT inflation started at a 7% annualized rate and is set to decrease by 1.5% each year until it reaches 3.5%. By mid-October, the inflation rate had reduced to just under 6.9%. Additionally, there was inflationary pressure from the genesis supply unlocks, with almost 31% of the genesis supply distributed by the end of Q1.

Looking at network activity, Aptos witnessed a significant increase in transactions and active addresses in Q1. Average daily transactions and addresses saw 66% and 97% QoQ growth rates, respectively. 

Despite the increased transaction activity, the average transaction fee decreased by 45% QoQ to 0.0006 APT ($0.007). Furthermore, average daily new addresses grew by 91% QoQ to 44,000, and the weighted average one-month retention rate increased by 82% QoQ to 14%.

APT Staked Tokens Decrease 5%

Regarding staking, APT staked decreased by 5% to 861 million tokens. However, when denominated in USD, the staked market cap grew by 68% QoQ, surpassing $14 billion. 

Aptos

As seen in the chart above, Aptos also experienced growth in its decentralized finance (DeFi) total value locked (TVL), which increased by 376% QoQ to $573 million.

According to Messari, this increase was not solely due to APT price appreciation; TVL also grew by 170% QoQ in APT terms. Additionally, Aptos’s stablecoin market cap nearly doubled QoQ, reaching $97 million.

APT Struggles To Break $8.80 Resistance

Despite these positive developments, APT’s price performance has faced challenges. The native token has declined over 16% in the past month, resulting in a modest 2.7% surge year-to-date. This contrasts with the double or triple-digit gains seen by other top cryptocurrencies.

Aptos

Currently trading at $8.46, APT has struggled to surpass its nearest resistance wall at $8.80, leading to a consolidation phase between $8.20 and $8.70 over the past month. 

Featured image from Shutterstock, chart from TradingView.com 

Analyst Who Predicted Solana’s 1,100% Move Reveals Where The Altcoin Is Headed Next

Crypto analyst Javon Marks has provided insights into the future trajectory of Solana (SOL) after it hit a 1,100% return. The analyst is known to have called the crypto token’s previous high correctly, which is one reason his latest prediction is worth keeping an eye on.  

Solana Could Rise To As High As $453

Marks mentioned in an X (formerly Twitter) post that despite its recent pullback, Solana’s price may be getting ready for another price rally. He noted that a move of over 54% may already be in the pipeline and that such a price move could open up room for another run of over 93%, which would send Solana to $453. 

Related Reading: Cardano Ready For 15x Move, Crypto Analyst Reveals The Major Drivers

Solana

Marks predicted last year that Solana would climb above $200, which it eventually did this year, peaking at a year-to-date (YTD) high of $202. Although the crypto token has dropped significantly from that price level, Marks’ recent prediction confirms that Solana’s run isn’t done yet and will still surpass its current all-time high (ATH) of $260.

Solana rising to $453 looks more feasible considering that crypto analysts like Altcoin Sherpa have predicted that the crypto token could rise above $500 by year-end. Crypto analyst Hansolar also predicted that Solana could climb to $600 in this market cycle. Meanwhile, Crypto YouTuber Jake Gagain predicted that Solana will rise to $750, although he mentioned that it will likely happen in 2025. 

SOL Could Become The Third-Largest Crypto Token

Solana’s rise to as high as $500 could lead to the crypto token becoming the third largest crypto asset by market cap, only behind Bitcoin and Ethereum. This is possible, as a rise to $500 is almost double Solana’s current ATH. Crypto analyst Chris O also previously predicted that this would likely happen as he predicted Solana and ADA would battle for the position. 

Meanwhile, asset manager Franklin Templeton also sounded confident in Solana’s potential to become the third-largest cryptocurrency. In a recent analysis, the asset manager highlighted the factors that could lead to this development. One is Solana’s technology, which they think will be perfect for the sectors that will drive the next wave of crypto adoption. 

Franklin Templeton also alluded to the upcoming airdrops on the Solana network, which could bring more liquidity into the ecosystem and possibly cause a surge in Solana’s price, just like when the Jito and Pyth airdrops occurred. The asset manager also noted that meme coin activity on the network isn’t slowing, which could contribute to Solana’s rise to becoming the third-largest cryptocurrency. 

Solana has become the foremost network for trading meme coins, which has led to an influx of new investors into the ecosystem. Therefore, a sustained network expansion will likely reflect positively on Solana’s price sooner or later. 

At the time of writing, Solana is trading at around $144, up in the last 24 hours, according to data from CoinMarketCap. 

Solana price chart from Tradingview.com

GameStop Stock And Wolverine Memecoins Explode As Roaring Kitty Returns To The Spotlight

GameStop, the video game retailer that took Wall Street by storm in 2021, has once again become the talk of the town as its share price surges 100%. 

Fueling this rally is the return of the influential social media figure Keith Gill’s “Roaring Kitty.” After a long hiatus, Roaring Kitty’s recent activity on social platforms, including an image and video, has ignited excitement among investors and triggered a renewed frenzy for GameStop’s meme stock and the emerging world of memecoins. 

GameStop Memestock Frenzy

The meme-stock phenomenon gained widespread attention in 2021 when cash-rich investors pumped up the stock market and bet against short-selling hedge funds. 

Keith Gill’s “TheRoaringKitty” account and the subreddit “WallStreetBets” played a pivotal role in the meme stock frenzy, driving stocks like GameStop and AMC Entertainment to surge over 1,000% by the end of the same year. 

While some early investors reaped rich returns, hedge funds such as Gabe Plotkin’s Melvin Capital Management suffered significant losses, leading to closures.

According to Bloomberg, short sellers betting against GameStop initially enjoyed gains in the year’s first four months. Still, the volatile nature of meme stocks quickly erased those paper gains. Per the report, “skeptics” were up an estimated $400 million from January to April before slipping into the red by Monday morning.

The percentage of GameStop shares sold short relative to those available for trading has remained at approximately 24%, a relatively high level for a typical company but significantly lower than the 140% levels witnessed during the 2021 mania

As GameStop’s shares gained momentum, the cost to bet against the company increased. Recent data from S3 indicates borrowing costs exceeding a 10% annual financing fee range.

Roaring Kitty’s Ripple Effect

Roaring Kitty’s influence extended beyond GameStop, as Wolverine-themed memecoins flooded various blockchains. In response to a social media post featuring a video of Marvel superhero Wolverine, more than 30 new tokens were launched on platforms like Ethereum and Solana, as data by Dextools shows. 

Notably, the newly minted “Roaring Wolverine” token on the Ethereum blockchain experienced an astonishing 80% surge within hours of its release.

Furthermore, the memecoin market has witnessed a notable resurgence, with tokens such as Dogecoin (DOGE), Shiba Inu (SHIB), Pepe (PEPE), Dogwifhat (WIF), Floki Inu (FLOKI), and Bonk Inu (BONK) recording significant gains, according to CoinGecko data

For instance, PEPE, the market leader, surged by 15% in the past 24 hours, complementing its 20% uptrend over the previous week. It reached a new high of $0.00001077 during early Monday trading.

GameStop

Ultimately, GameStop’s meme stock resurgence, fueled by the return of Roaring Kitty, inflicted substantial losses on short sellers of the meme stock on Monday. 

The impact of Roaring Kitty’s social media presence has extended to the memecoin market, with several Wolverine-themed tokens experiencing significant surges. 

Featured image from Shutterstock, chart from TradingView.com

Theta Network Breakout Imminent: Why A 100% Rise Is Possible From Here

While the focus has mainly been on Bitcoin and Ethereum through the downtrend, other smaller altcoins such as Theta Network with much more potential have been flying under the radar. However, crypto investors are no longer ignoring these altcoins and have begun to call out the opportunities in these cryptocurrencies.

Theta Network Is Looking At A Breakout

Crypto analyst CobraVanguard has called out an interesting formation in the THETA chart that suggests that a massive breakout might be on the horizon. In the analysis which was posted on the TradingView website, the analyst points out that a bull flag is currently being formed.

This bull flag pattern started with the most recent decline below the $2 price level after a period of brief dips and recoveries. Interestingly, since this bull flag pattern is still only forming, it does not mean that the breakout will happen immediately.

CobraVanguard’s chart shows that there will be more uncertain movements in the THETA price, coupled with the possibility of the price actually falling below $1.9. At the same time, the crypto analyst points out that the price is currently bouncing from the middle line around $1.99.

Theta Network price chart from Tradingview.com

However, once the formation is complete, then the breakout can happen. The upper end of the target presented by CobraVanguard shows that the THETA price can rise as high as $3.7. This would mean an almost 100% increase in price from its current level.

Holding Up Well Amid Uncertainty

2024 has been a rather eventful year for Theta Network. The network’s native token, THETA, had begun the year trending below $1. However, within the month of March alone, it saw an over 250% increase, going from $1.1 to over $3.7 before correcting back downward.

Since then, the THETA price has lost around 40% of its value. But this is only due to the negative headwinds that can be attributed to the decline in the Bitcoin price. The altcoin has moved upward in the market since then, rising over a $2 billion market cap to become the 51st-largest cryptocurrency in the space.

Amid the broader market downturn, THETA is still seeing positive metrics, especially when it comes to its volume. According to data from CoinMarketCap, the daily trading volume of the altcoin has jumped 13% in the last day alone, suggesting that interest is returning to the cryptocurrency.

At the time of writing, the THETA price is seeing small daily gains of 1.47% to trade at $2.02. However, on the weekly and monthly timeframes, the altcoin has performed poorly, dropping 13.73% and 12.97%, respectively.

Theta Network price chart from Tradingview.com

Analyst Points Out Level To Beat If Bitcoin Is To Reach $76,000

Crypto analyst Ali Martinez has highlighted what needs to happen for Bitcoin to climb to $76,000. If that doesn’t happen, he noted that the flagship crypto risks dropping significantly to levels not seen since the start of the year. 

How Bitcoin Could Rise To $76,000

Martinez mentioned in an X (formerly Twitter) post that Bitcoin will likely rise to $76,610 if it can reclaim $64,290 as support. However, if it fails to climb above $64,290, the crypto analyst added that Bitcoin might retest support at $51,970. Martinez drew this conclusion based on MVRV (Market Value To Realized Value) extreme deviation pricing bands, which showed $51,970 as the all-time mean. 

Bitcoin has recently maintained a tepid price movement and isn’t showing any sign that it can reclaim $64,290 as support for now. Instead, the flagship crypto looks likelier to retest the $51,970 price level, seeing as it is looking to break down below $60,000. However, despite Bitcoin looking to have a bearish outlook, crypto analyst Mikybull Crypto maintains that Bitcoin’s price action is bearish. 

In an X (formerly Twitter) post, he mentioned that BTC is having a “simple retest to weary the impatient trader.” “Nothing bearish as bears seem to amplify it,” he added. The analyst had previously predicted that Bitcoin could climb to $73,000 once it clears the $67,000 price level. 

BTC May Soon Resume Its Upward Trajectory

Meanwhile, crypto analyst Rekt Capital suggested that Bitcoin may soon be out of the clear, revealing that the Post-halving “Danger Zone” officially ends on May 13. The analyst had previously explained that this Danger Zone is the downside wick that Bitcoin experienced approximately 21 days after the Halving in 2016. 

In another X post, the analyst revealed that Bitcoin had repeated the “2016 history perfectly, offering a downside wick below the bottom of its current Re-Accumulation range within a three-week window after the halving.” Therefore, with this retracement out of the way, the flagship crypto looks primed for an upward trend. 

However, this move might not happen so soon since Rekt Capital mentioned the Reaccumulation period, which usually occurs after the Bitcoin halving. The crypto analyst noted that this period usually lasts up to five months. He added that this time could be different since this re-accumulation would develop around a new all-time high (ATH) area. 

While it is uncertain when this price rally might come, Rekt Capital suggested that Bitcoin might not drop below the $60,000 price level again. He claimed that a weekly close above $60,600 for Bitcoin “would continue to solidify this price level as a base of the Re-Accumulation Range. 

At the time of writing, BTC is trading at around $61,100, up in the last 24 hours, according to data from CoinMarketCap. 

Bitcoin price chart from Tradingview.com

Cardano Ready For 15x Move, Crypto Analyst Reveals The Major Drivers

Cardano (ADA) looks primed to make that move to the upside, with crypto analyst Javon Marks revealing what could make the crypto token see a 15x increase in its price. Marks’ analysis comes amidst recent price predictions, which paint a bullish outlook for Cardano. 

How Cardano Could See A 15x Increase In Its Price

Marks mentioned in an X (formerly Twitter) post that ADA has shown “major progress since breaking the resisting trend.” The crypto analyst also noted that the crypto token attempted to move over 200% toward the first target at $2.77709 and claimed that the recent pullback Cardano faced could strengthen it to achieve an even more parabolic rise.  

Cardano

This development is why Marks believes Cardano could rise to as high as $7.80 from its current price, representing a 1,500% increase for the crypto token. A rise to that level looks more feasible, considering that crypto analyst Altcoin Daily also recently predicted that Cardano will rise to $9 in this bull run.

Meanwhile, crypto analyst Ali Martinez made an ultra-bullish case for Cardano, noting that the crypto token was currently mirroring its price action from 2019, when it made a price gain of over 4,000%. While Martinez acknowledged that history might not repeat itself, he suggested that Cardano could still make an impressive move similar to 2019. 

For Cardano to experience such parabolic moves, the crypto token needs to see a reversal in its current downtrend. Crypto analyst Trend Rider hinted that could happen soon, noting that ADA was still holding its support level. According to him, if Cardano can hold on to this support for 1 to 2 weeks, the bears will tire, and the crypto token will bounce from its current price level. 

Analyzing Cardano’s Bull Run

Dan Gambardello, the founder of Crypto Capital Venture, again suggested that Cardano’s price action in this bull run will likely mirror Ethereum’s in the last bull run. He noted that the former is currently around the level that Ethereum was at around the 2020 Bitcoin halving. As such, he expects Cardano to enjoy a similar success to the one Ethereum enjoyed in the last bull run. 

The crypto analyst also assured that Cardano was still on track for its bull run, stating that it was also down over 90% from its all-time high (ATH) months after Bitcoin halved in the last bull run. As such, he still expects Cardano to make a run soon enough, just like it did in 2021. 

The crypto analyst hinted that Cardano’s bull run would likely begin during the Altcoin Season. However, he wasn’t sure when this Altcoin season would likely start since Bitcoin hit a new ATH before the halving (which has never happened before). He added that this Altcoin season might not come until December. For now, the analyst noted that patience is the name of the game. 

Cardano price chart from Tradingview.com (Crypto analyst)

The Akash Network Phenomenon: Breaking Down Its 2400% Uptrend And Market Outperformance

Decentralized and open-source computing platform Akash Network has captured significant attention in the cryptocurrency market as its native token, AKT, has outperformed the top 100 cryptocurrencies with a 2400% price increase year-to-date. 

While Bitcoin (BTC) and other major cryptocurrencies experience price corrections, the Akash Network and its native token are surging at a remarkable pace. To comprehend the driving factors behind this uptrend, it is crucial to delve deeper into what the Akash Network represents and its underlying technology.

What Is The Akash Network?

The Akash Network, founded in March 2018 by Overclock Labs, emerged as a distributed cloud computing marketplace with the objective of decentralizing cloud computing. Originally focused on building a traditional multi-cloud deployment platform, Overclock Labs decided to launch Akash.

According to Messari, the network facilitates the connection between server owners in need of computing power to host applications and users offering cloud computing resources through the Akash Marketplace, where computing resources are bought and sold.

At the core of the Akash Network lies its blockchain infrastructure known as Akash, built using the Cosmos SDK and based on the Tendermint consensus mechanism. 

Since the launch of Akash Mainnet in September 2020, the network has undergone notable upgrades to increase its functionality. These upgrades include the introduction of the Akash Marketplace, flexible bid pricing, Inter-Blockchain Communication (IBC) compatibility, deployment tools for improved user experience, audited attributes, and Tendermint’s State Sync. 

Subsequent upgrades introduced features such as persistent storage, authorized spending, an inflation decay curve, fractional uAKT to eliminate minimum cost deployment, IP leases, provider service splits, Cosmos IBC3 update, and Interchain Accounts (ICA).

Messari points out that the most recent upgrades have positioned Akash as a prominent player in the cloud computing and artificial intelligence (AI) development space. Mainnet 6 introduced support for GPUs and stable payments, establishing Akash as an open-source marketplace for high-density GPUs and a distributed cloud for large language models (LLM). 

In conjunction with this upgrade, Overclock Labs launched Akash ML, a cloud infrastructure that offers AI developers GPU spot instances, with plans to provide on-demand access in the future. 

Subsequent upgrades focused on enforcing minimum validator commissions, improving GPU visibility, and ensuring validated bids on multi-service deployments.

AKT Token Breaks Key Trendline

In terms of price action, the Akash Network’s native token, AKT, has recently demonstrated a notable breakthrough. Over the past 24 hours, AKT has experienced a significant surge of 15.63%, propelling its trading value to $5.64.

One key indicator of this positive development is the token’s ability to surpass a diagonal trendline in the 4-hour timeframe. Breaking this trendline suggests a potential reversal of the previous downward trajectory and opens up the possibility of further bullish market sentiment for AKT.

Akash Network

Moving forward, the focus for AKT is to sustain the previous week’s high of $5.095 as a crucial level of support. By maintaining this level, the token aims to consolidate its recent gains and solidify its position in the market.

In summary, the price increase of AKT can be attributed to several factors. The success of the Akash Network’s underlying technology and its value proposition in the decentralized cloud computing space contribute to the positive sentiment surrounding the token. As the network gains recognition and attracts users, demand for AKT may increase, resulting in upward pressure on the price.

In addition, the successful break of the diagonal trend line represents a potential shift in market dynamics as investors may take this as a bullish signal, leading to increased buying activity and further price appreciation.

Featured image from Shutterstock, chart from TradingView.com

EigenLayer Launches Airdrop Season, Allowing Users To Claim 113M EIGEN Tokens

Restaking protocol EigenLayer has unveiled its highly anticipated airdrop season, during which eligible users can claim a portion of the initial EIGEN token supply. 

EigenLayer Sets September 2024 Deadline

The protocol’s announcement on Friday revealed that “Season 1” commences with 6.05% of the total supply, which users can claim starting on May 10. 

Moreover, “Season 1 phase 2,” set to begin mid-June, will increase the claimable percentage to 6.75%. Season 1 will distribute approximately 113 million EIGEN tokens to participants. EigenLayer has reserved 15% of the initial token supply for the community across all seasons, signaling its commitment to inclusive participation.

EigenLayer has also announced that EIGEN tokens are currently non-transferable. However, the protocol plans to unlock token transfers once new features are launched and “further decentralization” is achieved. 

These developments are expected to take place by September 30th, 2024. Until transfer restrictions are removed, core contributors and investors will not receive EIGEN staking rewards, and no inflation will occur.

Record-Breaking $14 Billion In Assets

Since its soft launch in 2023, EigenLayer has reportedly attracted $14 billion in assets, making it a prominent player in the decentralized finance (DeFi) space. 

According to Bloomberg, the protocol’s restaking service offers amplified returns by leveraging the process of depositing ETH coins to support the Ethereum blockchain. Eigen Labs, the Seattle-based firm behind EigenLayer, raised approximately $165 million from notable backers, including a16z Crypto.

Investors gain access to EigenDA by staking EIGEN, a performance data availability system supporting Ethereum rollups. The protocol claims this presents an opportunity for users to secure amplified returns. 

Additionally, EigenLayer will shortly introduce compatibility with various AVSs (Application-Specific Verification Systems), offering stakers more options. 

Nonetheless, virtual private network users and residents of countries such as the US, Canada, and China have been excluded from the airdrop, highlighting the challenges of operating within regulatory frameworks and ensuring compliance. Eigen Foundation’s executive director, Robert Drost, acknowledged the complexities of navigating regulatory guidelines:

It’s not possible to operate in the space without following regulatory guidelines and being responsible, and the challenging part is that there is not a lot of clarity. 

Despite these setbacks, EigenLayer’s popularity has positioned it as the second most popular DeFi application, surpassing liquid staking platforms like Lido and Rocket Pool. 

While liquid staking provides easier access to staking rewards and leads the DeFi category, it has experienced significant outflows in recent months. DefiLlama data indicates a 27% decline in total value locked in liquid staking protocols since their peak of $63 billion in March. EigenLayer’s restaking service has contributed to the restaking of nearly 4% of all ETH. 

EigenLayer

The second largest cryptocurrency on the market, Ethereum, is trading at $2,890, following Bitcoin’s lead with a 3.8% drop in the past 24 hours. 

Featured image from Shutterstock, chart from TradingView.com

Crypto Analyst Says XRP Price Can Break Out From Falling Pennant, But Can It Reach $1?

The XRP price, like the rest of the crypto industry, continues to struggle against the bearish winds that have taken over. This has seen its price consistently decline in spite of bulls’ best efforts to prop it up. However, it seems all hope is not lost for the altcoin as expectations are that it will recover soon enough. More specifically, crypto analyst WalterMoon is particularly bullish on the XRP price, noting that it is possible that it will break out of its current pennant.

Analyzing The XRP Price Movement

To try and pinpoint where the XRP price is headed, the crypto analyst first analyzed the movement of the altcoin over the last few weeks. This analysis showed a consistent breakout trend, albeit short-lived, that suggests that the altcoin could be getting ready to mount another one soon.

One of these breakout trends took place last month in May when the price had entered a failing channel. Eventually, the XRP price was able to muster enough momentum, even after breaking below its support line below $0.5 and then made a run for $0.52.

Again, this is seen later in the month when the price once again fell into a falling channel. This decline saw it fall below support. But like the previous time, it was able to move upward inside this falling channel and eventually broke out of the channel.

XRP price chart from Tradingview.com

This trend was recorded a number of times in the month of May, showing XRP’s strength in the market right now. However, the altcoin has fallen inside another falling channel once again, but can it maintain its breakout trend from last month?

Gathering Support Inside A Pennant

Crypto analyst WalterMoon has identified the XRP price inside a falling channel and as it continues to decline inside this pennant, the price has taken hit after hit. But given the performance from the last month, Moon believes there is still upside to come for XRP.

According to the analyst, there is a possibility that the altcoin can exit its current pennant by bouncing off the support at $0.533. In this case, it could send the price as high as $0.54, like it did the previous times. “Now, I think that Ripple can bounce up from support line to $0.5330, thereby exiting from pennant,” the analyst said.

Despite the bullish outlook, WalterMoon’s target is still conservative for all intents and purposes. The target still remains above the $0.54 level, which, unfortunately, doesn’t show much expectation for the XRP price to cross $1.

XRP price chart from Tradingview.com

Bitcoin Short Term NUPL Value Turns Negative, What This Means For Price

Crypto analyst Onchained recently provided valuable insights into an important metric that can be used to gauge the future trajectory of Bitcoin. The analyst suggested there was no cause to worry at the moment but highlighted what to watch out for to know the right time to exit the market. 

Bitcoin Short-Term Holders NUPL Turns Negative

In a blog post, the analyst noted that the NUPL (Net Unrealized Profit/Loss) for Bitcoin’s short-term holders recently turned negative. The analyst added that this signals fear among this category of investors, which is very much likely given Bitcoin’s current price action. The last time this trend occurred was shortly after the Spot Bitcoin ETFs were approved, with Bitcoin dropping from $49,000 to $38,000 following that occurrence. 

Related Reading: What Triggered The 6,350% Spike In XRP Long Liquidations Compared To Shorts?

Bitcoin

While the short-term holders’ NUPL turning red again suggests that a significant price decline may be on the horizon, the analyst remarked that this price level may simply represent a significant support line. The real cause for concern might be when the NUPL for mid-term holders also turns negative. “It could indicate widespread market fear and serve as a crucial risk management indicator for exiting the market,” the analyst claimed. 

It is worth noting that the short-term holder’s NUPL being negative means they are currently seeing an unrealized loss in their investments. This could trigger a wave of sell-offs among these investors, mainly because of fear that Bitcoin’s price could further dip. However, based on the analyst’s analysis, this might not significantly lower Bitcoin’s price. 

Instead, market speculators should be more worried about the PUNL of mid-term holders (those who have been holding Bitcoin for 3 to 6 months). The PUNL also turning negative will “suggest widespread pessimism or negative sentiment.” This could lead to massive selling pressure on Bitcoin’s price as this category of investors might also offload their holdings out of fear.  

The Worst May Already Be Over

Crypto analyst Ali Martinez had previously shared a similar analysis to Onchained’s, noting that Bitcoin short-term holder’s (STH) realized price was at $59,800. The analyst warned back then that Bitcoin dropping below this level could trigger “notable Bitcoin price corrections.” Following his prediction, Bitcoin fell below $59,800, dropping to as low as $57,000. 

Related Reading: Crypto Analyst Says Ethereum Price Will Drop To $2,500, Here’s Why

However, the flagship crypto has since then recovered nicely above $60,000. Although Bitcoin is still showing signs of a bearish outlook, its quick recovery above $60,000 suggests that the worst might be over, and all the crypto token needs right now is a catalyst to spark a continuation of its bull run. 

Arthur Hayes, BitMEX’s co-founder and former CEO, also confirmed this belief, noting that Bitcoin has already found its local bottom. However, he predicted that Bitcoin will likely have a “range-bound price action between $60,000 and $70,000 until August.”

Bitcoin price chart from Tradingview.com

Grayscale Battling Outflows And Lower-Cost ETFs, Q1 Revenue Stays Flat At $156M

Grayscale Investments, the issuer of one of the recently approved spot Bitcoin exchange-traded funds (ETFs) in the US, saw flat revenues in the first quarter of the year due to its decision to maintain fees on its flagship Grayscale Bitcoin Trust ETF (GBTC). 

Grayscale Exceeds Expectations Despite Outflows

According to a shareholder letter from its parent company, Digital Currency Group (DCG), the operator of the Grayscale Bitcoin Trust recorded $156 million in revenue, showing little change from the previous quarter.

Since the GBTC trust’s conversion to an ETF in January, Grayscale has seen outflows of about $17.4 billion as investors appear to have shifted their assets to new, lower-cost funds offered by BlackRock and Fidelity, the leaders in the US ETF race in terms of inflows recorded since January. 

While GBTC charges a 1.5% management fee, many of its competitors charge less than 0.3%, leading to outflows. In response, Grayscale announced plans in March to seek approval from the Securities and Exchange Commission (SEC) to spin off some of Grayscale’s assets into a new, lower-fee “Bitcoin Mini Trust.” 

Despite the outflows, the Q1 revenue attributable to GBTC exceeded Grayscale’s expectations. The firm had previously anticipated outflows due to increased competition under the ETF wrapper. Grayscale previously charged a 2% sponsorship fee before the trust was converted. 

The flat revenue was also attributed to higher average Bitcoin and Ethereum prices and a decrease in assets under management (AUM).

In contrast to Grayscale’s performance, all US spot Bitcoin ETFs have witnessed a total net inflow of over $11 billion thus far. However, demand for these ETFs has recently declined amidst tightening financial conditions in the US, where the Federal Reserve (Fed) faces the challenge of addressing persistent inflation.

DCG Reports 11% Q1 Revenue Increase

Digital Currency Group, founded by Barry Silbert and the parent company of Grayscale, reported an 11% quarter-over-quarter increase in Q1 revenue to $229 million, primarily due to higher asset prices. 

However, revenue growth lagged behind Bitcoin’s price appreciation, which rose more than 60% during the same period. In its letter, DCG attributed this disparity to lower GBTC sponsor fees, redemptions, and steady mining revenues at its Foundry subsidiary.

Foundry, DCG’s mining subsidiary, experienced a sequential revenue increase of 35%, propelled by staking and equipment sales revenue. Meanwhile, Luno, the company’s crypto exchange subsidiary, witnessed a 46% quarter-over-quarter sales boost, driven by a significant surge in trading volume.

Grayscale

At press time, Bitcoin is trading at $62,100 and has recently encountered significant price volatility. These price swings have failed to establish a stable position above crucial price thresholds.

Featured image from Shutterstock, chart from TradingView.com 

Pantera Capital Predicts Bitcoin Price Surge To $117,000: Insight Into The Timing And Factors

The Bitcoin price has experienced heightened volatility over the past week. After recovering from a low of $56,500, the largest cryptocurrency in the market surged to $65,500 within four days. However, it has since retraced some of its gains and is currently testing the $61,000 support level. 

Despite this volatility and the absence of strong bullish momentum, venture capital firm Pantera Capital remains optimistic about the future of BTC’s price, citing the recent Halving event as a significant factor.

Pantera Capital Projects $117,000 Price Target By 2025

In a recent investor letter, Pantera Capital revealed its Bitcoin Halving rallies model, which predicts a bottoming out of the BTC price followed by a rise through the Halving rally. 

Based on the average duration of previous rallies, the firm forecasts that BTC’s price will peak at $117,000 in August 2025. The average total duration of this cycle, encompassing pre- and post-Halving rallies, has historically been around 2.6 years, with symmetry observed across cycles.

Pantera Capital highlights the relationship between Halving events and BTC’s price. The firm asserts that if the demand for new Bitcoin remains constant while the supply of new Bitcoin is reduced by half, it will create upward pressure on the price. 

The anticipation of a price increase has also historically driven increased demand for Bitcoin leading up to Halving events. However, Pantera Capital acknowledges that the impact of each subsequent Halving on price may diminish as the reduction in the supply of new Bitcoin from previous Halvings becomes less significant.

Moreover, the firm notes that, on average, the Pantera Bitcoin Fund has nearly doubled in value for eleven years. Based on this historical performance, Pantera Capital envisions a scenario in which the price of Bitcoin reaches $117,000 by 2025.

Bullish Bitcoin Price Predictions

Renowned crypto analyst Titan of Crypto has recently taken to social media platform X (formerly Twitter) to share bullish predictions for the Bitcoin price. With forecasts ranging from $75,000 to $110,000, Titan of Crypto highlights various factors and patterns that could potentially drive BTC’s growth.

According to Titan of Crypto, a price rise to $110,000 for Bitcoin is “programmed.” While the analyst did not elaborate on the specifics of this programming, it suggests a strong conviction in BTC’s potential to reach that level.

Titan of Crypto also identifies a current head-and-shoulders pattern in the Bitcoin price chart. If this pattern holds, the analyst suggests that BTC could rise to the $75,000 mark. If confirmed, this pattern could signify a bullish trend reversal and further support the projection of Bitcoin reaching higher price levels.

The analyst also highlighted $61,500 as a critical point to monitor due to the possibility of “panic selling.” The analyst suggests many market participants might react to this level, potentially increasing selling pressure

Lastly, based on his analysis, the analyst suggests a conservative price prediction of $108,000. However, Titan of Crypto believes that BTC’s price may exceed this projection, indicating a more optimistic outlook.

Bitcoin price

Featured image from Shutterstock, chart from TradingView.com