Bitcoin Trader Selling Pressure Declining, CryptoQuant Head Explains Why

The head of research at the on-chain analytics firm CryptoQuant has explained why selling pressure from Bitcoin traders may be declining.

Bitcoin Short-Term Holder Realized Price Has Risen To $60,000

In a new post on X, CryptoQuant head of research Julio Moreno has discussed why the short-term holder selling pressure may be declining for BTC. The “short-term holders” (STHs) refer to the Bitcoin investors who have been holding onto their coins since less than 155 days ago.

The STHs include the “traders” of the market who make many moves within short periods and don’t tend to HODL their coins. This group can be quite reactive to market movements, easily panic selling whenever a crash or rally takes place.

Generally, investors in profits are more likely to sell their coins, so one way to gauge whether the STHs would be likely to take part in a selloff is through their profit/loss margin.

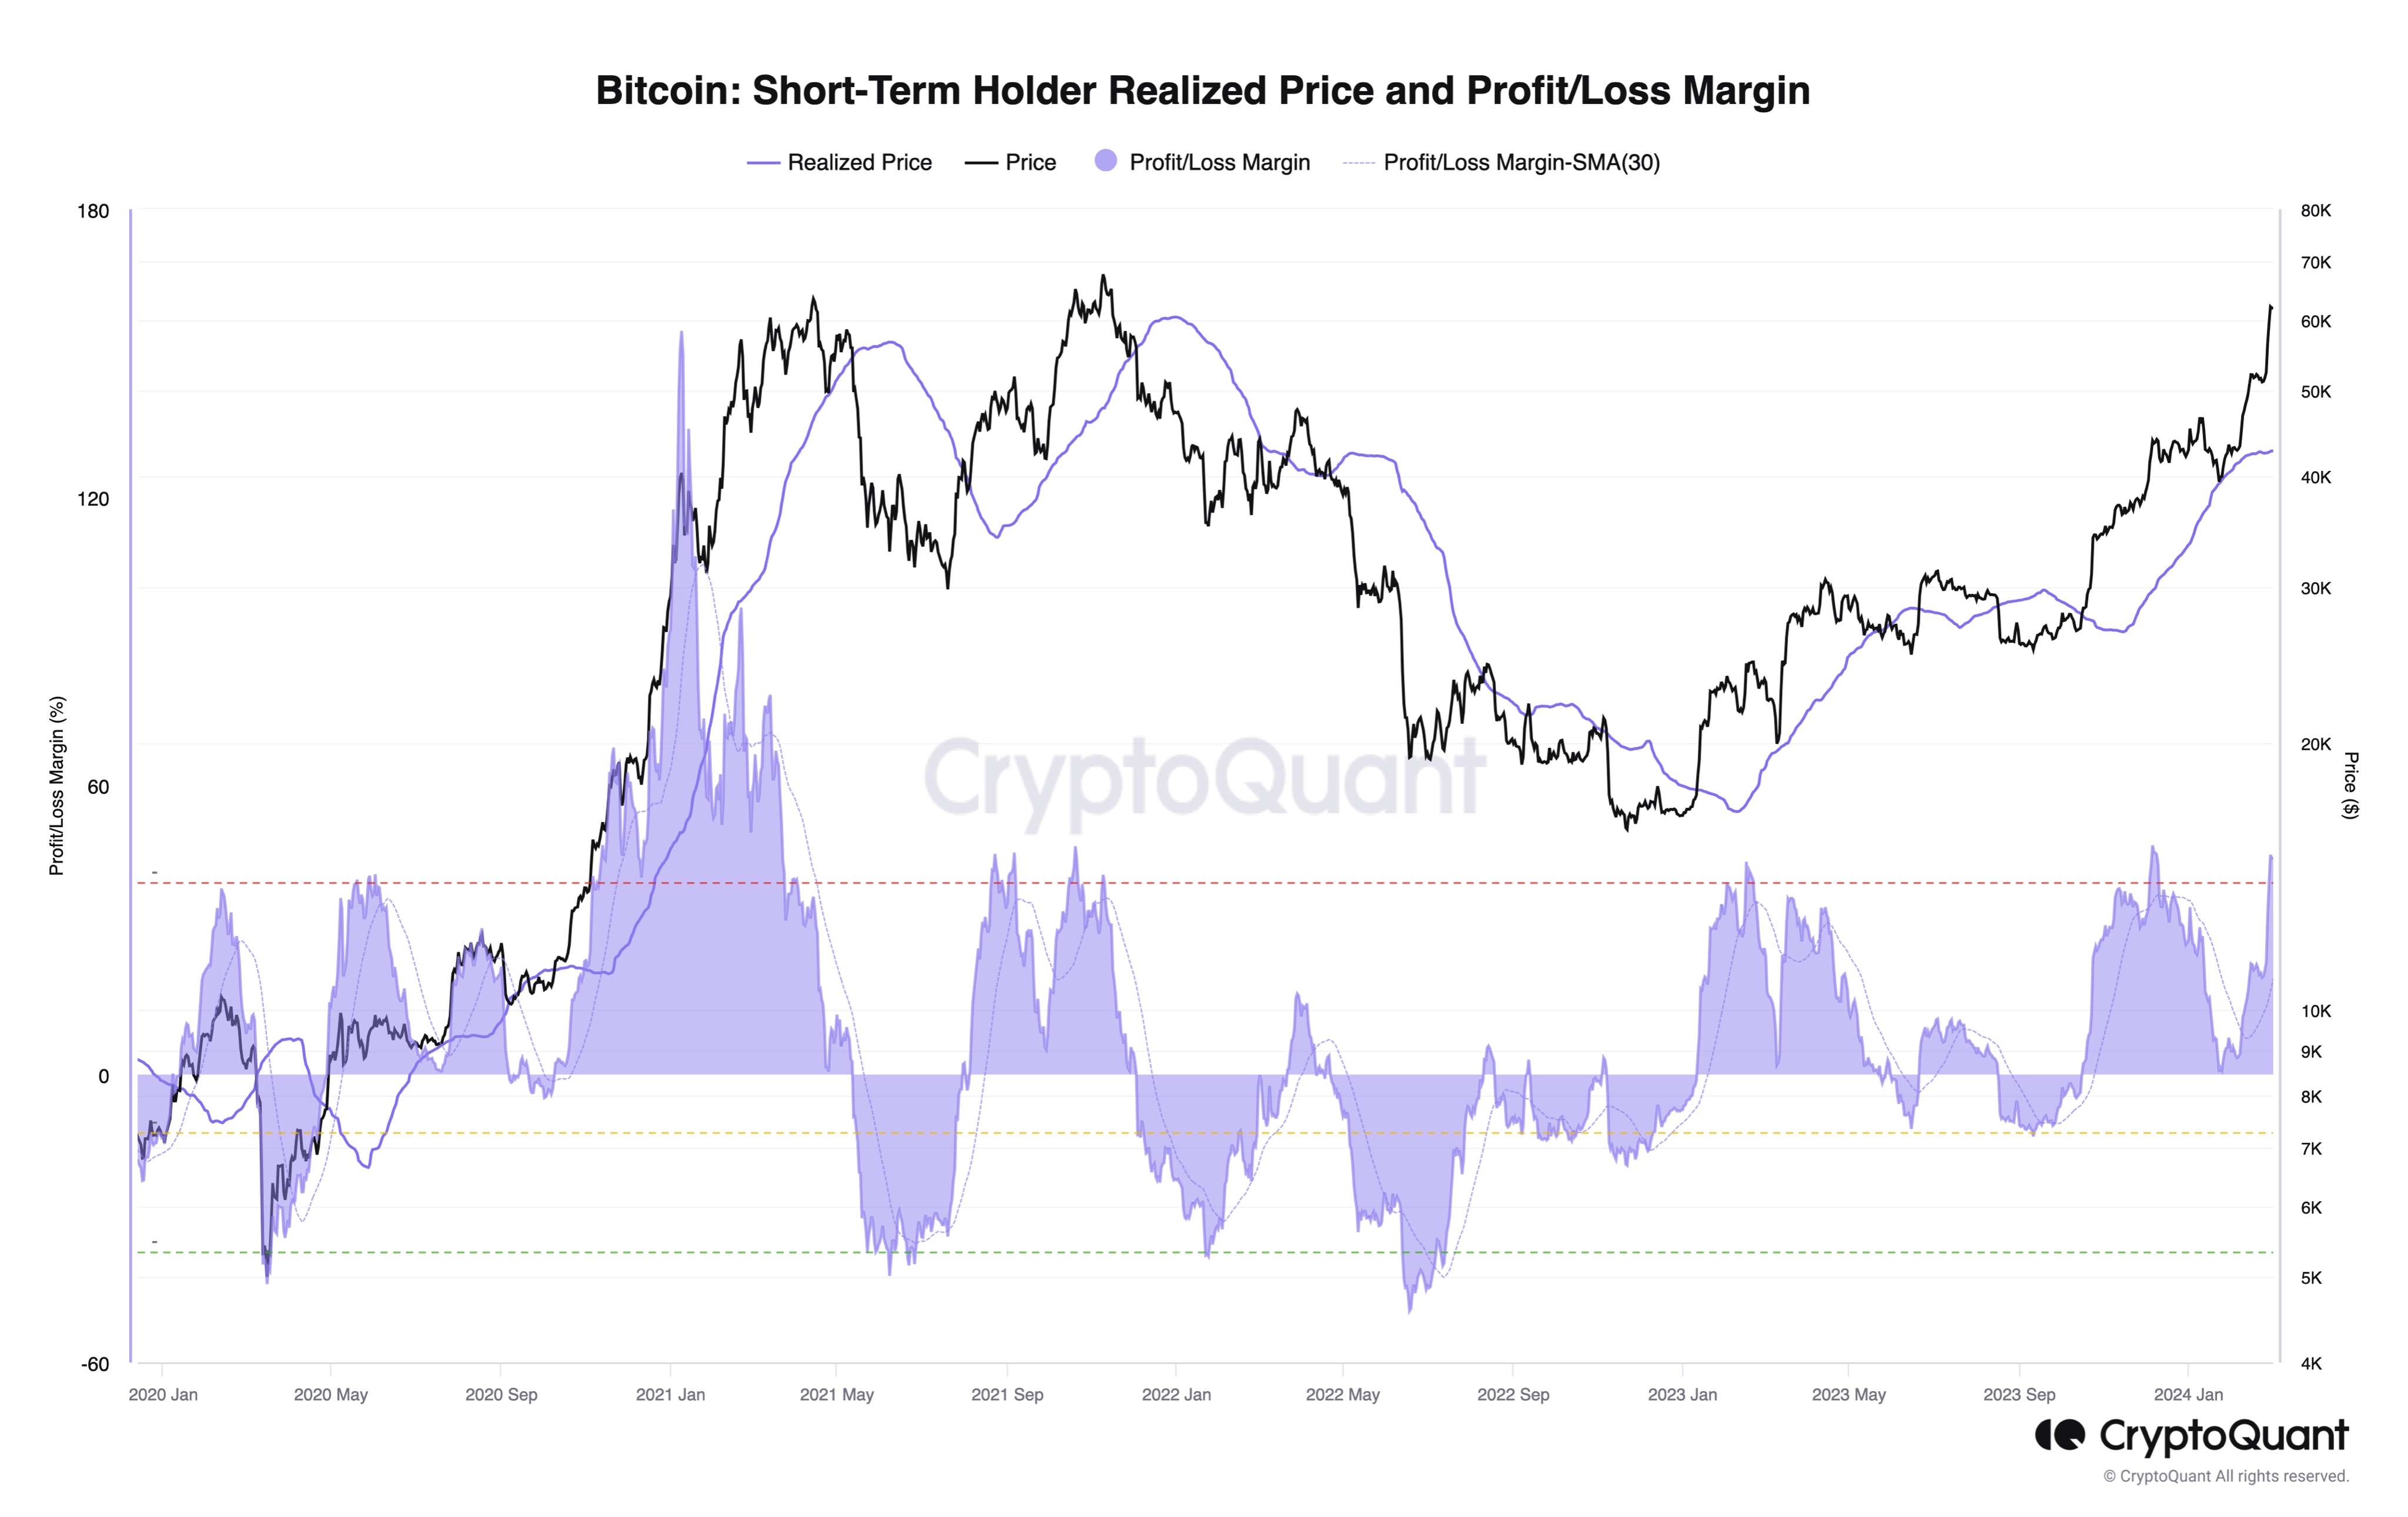
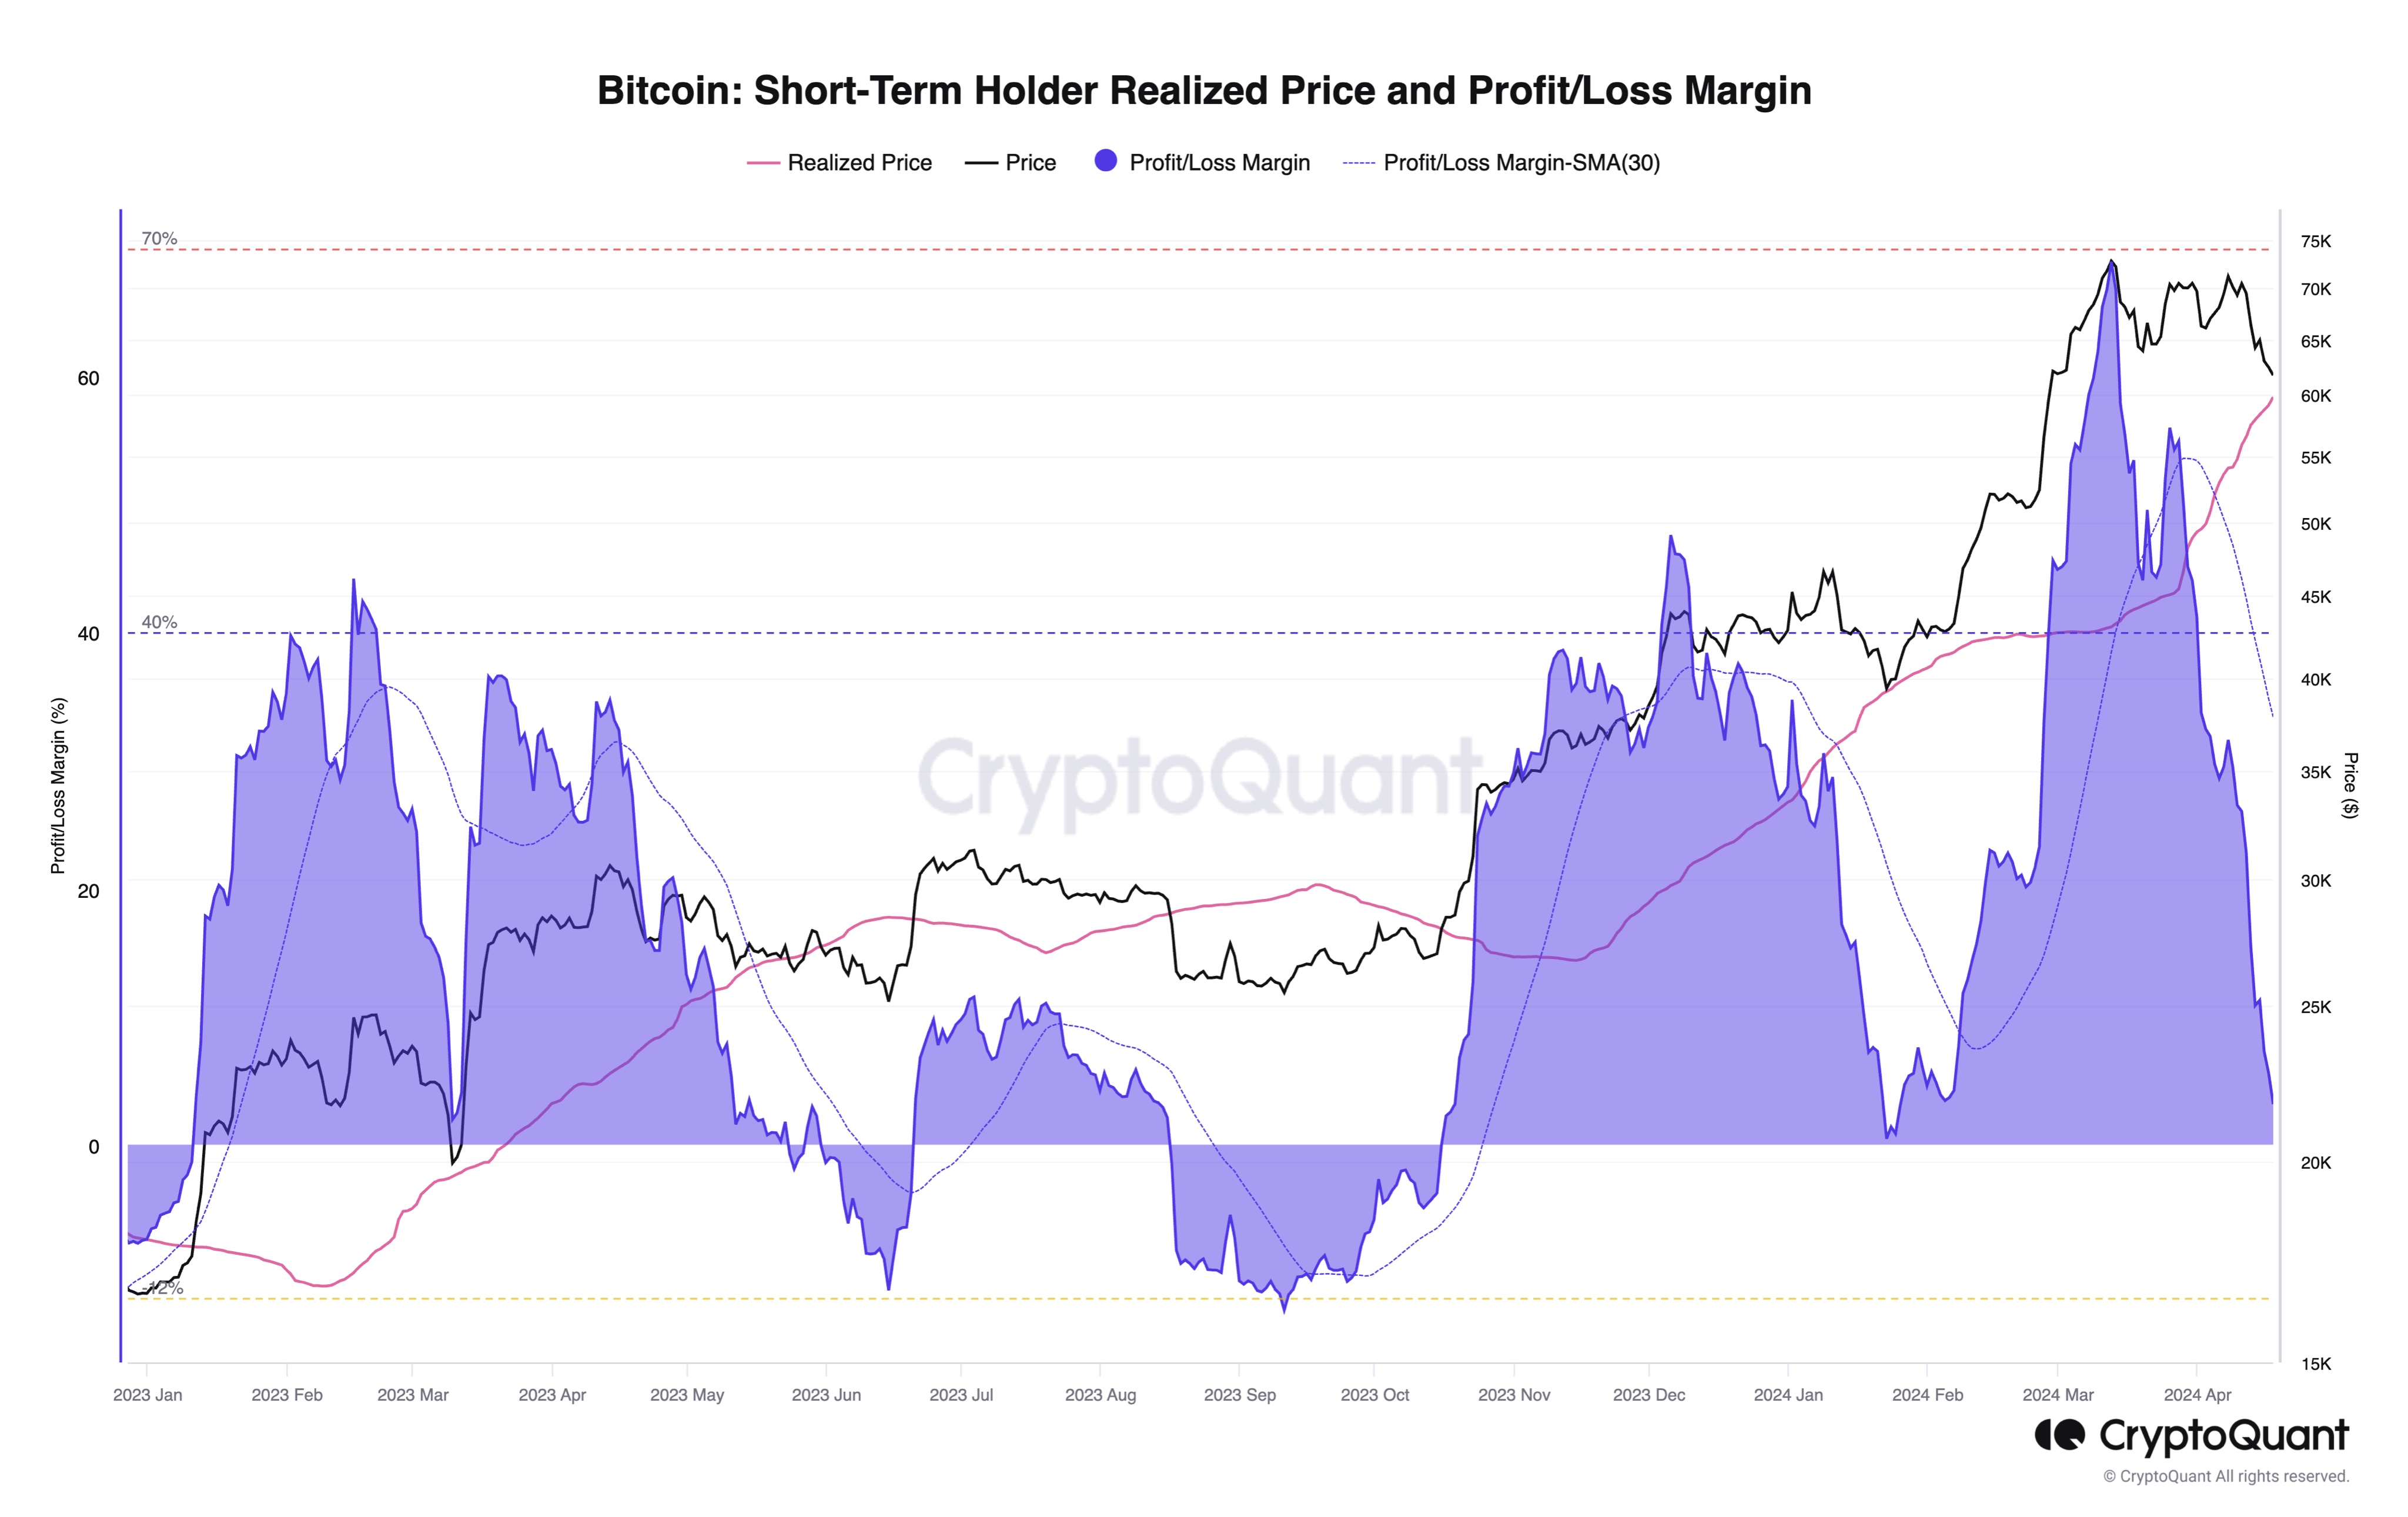
Here, Moreno has cited the profit/loss margin of this cohort based on its realized price.

Bitcoin STH Realized Price

The STH realized price (highlighted in pink) here refers to the average cost basis or acquisition price of the investors part of this cohort calculated using blockchain transaction history.

When the spot value of the cryptocurrency is above this level, it means that these holders as a whole are sitting on some net profits right now. On the other hand, the price being below the metric implies the dominance of losses.

From the above chart, it’s visible that Bitcoin has been above the STH realized price for the last few months, meaning that these traders have been enjoying profits.

This is typical during bull markets as the price keeps pushing up, letting these investors make profits. While STHs tend to stay in the green in these periods, tops do become probable to take place if these profits get extreme.

As is apparent in the graph, the profit/loss margin spiked to significant levels just as BTC set its latest all-time high, which continues to be the top thus far.

Recently, as Bitcoin has consolidated between the $60,000 to $70,000 range, the STH realized price has rapidly risen, now attaining a value of around $60,000. This occurs because as STHs have traded in this range, their acquisition prices have been repriced at these higher levels, thus pushing up the average.

BTC has been quite close to this level recently so that the STHs wouldn’t be holding that much profit now. “Bitcoin selling pressure from traders may be declining as unrealized profit margins are basically zero now,” notes the CryptoQuant head.

BTC Price

Bitcoin has continued to show action contained within its recent range as its price is still trading around $65,200.
Bitcoin Price Chart

Bitcoin Could Drop To $52,000 If Price Breaks Below This Mark – CryptoQuant

Amidst the ongoing fluctuations in the cryptocurrency market, the price of Bitcoin has surged by 1.7% in the past 24 hours, hovering above the $62,000 mark.

However, recent warnings from CryptoQuant, a leading crypto analytics platform, suggest that Bitcoin could face a significant downturn to $52,000 if specific key levels are violated.

This cautionary note comes amidst growing uncertainty in the Bitcoin derivatives market, with derivative traders showing unprecedented caution compared to previous halving cycles.

Bitcoin Risky Level

CryptoQuant’s analysis highlights declining open interest and funding rates in the Bitcoin derivatives market, indicating a “cautious” stance among traders, particularly with the arrival of several institutional participants. CryptoQuant analyst Shiven Moodley noted:

At this halving, derivative traders exhibit far more caution than in previous instances. This season witnesses the entry of numerous new institutional players into the market.

According to the analyst, If Bitcoin’s price falls below the critical $60,000 support level, the top cryptocurrency could experience a notable correction to $52,000, signaling a potential short-term bearish trend.

However, the presence of institutional Bitcoin Spot ETFs may mitigate the severity of the decline by absorbing “excess supply from liquidations” around the $60,000 support zone.

Moodley stated:

If the price breaks below $60,000, we might witness a decline to $52,000 before a subsequent rise. However, given the significant dominance of institutional ETFs, I wouldn’t be surprised if they accumulate excess supply from liquidations near the short-term support level of $60,000.

Analysts Sound Alarm On BTC’s Fragile Position

Meanwhile, crypto trader and analyst Ali has further fuelled concerns by identifying a pivotal price level for Bitcoin. Ali’s analysis indicates that if Bitcoin drops to $50,500, over $15 billion in liquidations could occur on the Binance alone.

Such a significant liquidation event could exert immense pressure on the market, potentially leading to further price declines and heightened volatility.

This outlook echoes recent warnings from prominent analyst Crypto Rover, who has also cautioned about a potential liquidation event affecting short holders if Bitcoin climbs back to the crucial price mark of $71,600.

Despite these concerns, some analysts remain optimistic about Bitcoin’s long-term prospects. Crypto analyst Plan B, known for his Stock-to-Flow (S2F) model, has made bullish predictions for Bitcoin’s future price movements.

According to Plan B, Bitcoin’s upcoming Halving event will serve as a central driver for price increases, with the cryptocurrency expected to surpass $100,000 this year and exceed $300,000 by 2025.

Bitcoin (BTC) price chart on TradingView

Featured image from Unsplash, Chart from TradingView

Bitcoin Addresses Add $1.6 Billion In BTC In A Single Day – Price Recovery Soon?

The price performance of Bitcoin over the past week has been a source of concern for the majority of the crypto community. This has pretty much been the case for other cryptocurrencies in the market, with several large-cap tokens reversing their recently-accrued profits.

However, some investors are treating the recent price decline as a rare opportunity in the bull market as they continue to load their bags with assets of their choice. Specifically, the latest on-chain data shows significant buying activity amongst a certain class of investors. 

25,000 BTC Flow Into Accumulation Addresses In One Day

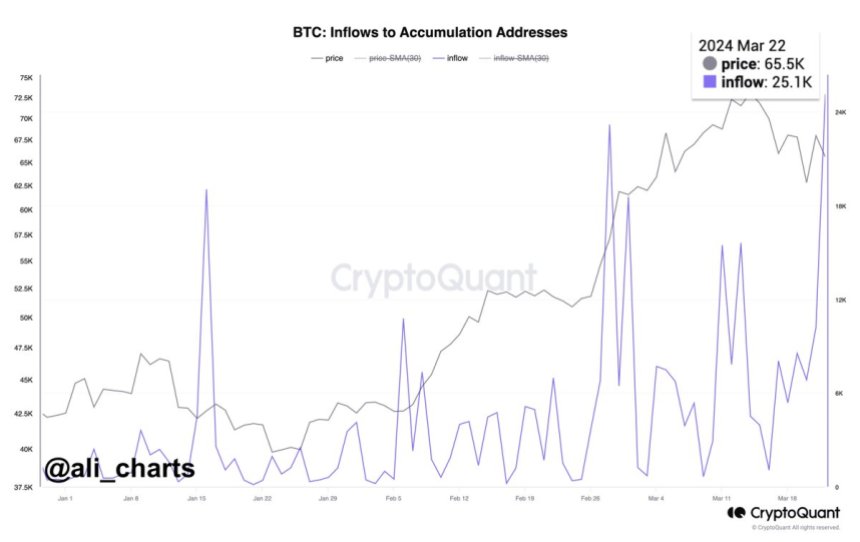
Prominent crypto pundit Ali Martinez revealed, via a post on X, that more than 25,000 BTC (valued at approximately $1.6 billion) was moved to accumulation addresses on Friday, March 22. This figure represents the highest amount transferred to these wallets in a single day so far in 2023.

The metric of interest here is the Inflow to Accumulation Addresses on the Bitcoin blockchain. For context, a Bitcoin accumulation address refers to an address that has zero outgoing transactions and maintains a balance of at least 10 BTC.

Bitcoin

This classification, however, excludes digital wallets linked to centralized exchanges and miners and has less than 2 non-dust incoming transfers. Also, it doesn’t include addresses that have not seen any activity in more than seven years.

The increased flow of coins into this class of wallet addresses is evidence of substantial BTC accumulation by entities who view the crypto as a long-term investment. It signals that certain big-money players are amassing Bitcoin in anticipation of potential value appreciation.

What’s more, this significant acquisition by long-term investors emphasizes the increasing adoption of Bitcoin as a store of value. Meanwhile, it might be an indicator of bullish price movement in the short term. 

Bitcoin Price Overview

As of this writing, Bitcoin is valued at $64,636, reflecting a mere 1% price increase in the past 24 hours. This price change is somewhat negligible, considering the deep retracement of the premier cryptocurrency earlier in the week.

According to data from CoinGecko, the price of BTC is down by 2.4% over the past week. Meanwhile, the market leader is currently about 13% from its record high of $73,798.

However, it has been an overall positive performance for the Bitcoin price in March, having surpassed this previous all-time high of $69,000 a little over a week ago. And, with a market cap of $1.26 trillion, BTC retains its position as the largest cryptocurrency in the sector.

Bitcoin

March Sees Nearly $1 Billion In Ethereum Netflow To Centralized Exchanges – What’s Happening?

The price of Ethereum has not exactly lived up to its promise as the month has gone on, despite a stellar start to the month. While this bearish pressure has been widespread in the general cryptocurrency market, regulation uncertainty has been an additional concern for ETH, igniting a negative sentiment around the “king of altcoins.”

Interestingly, the latest on-chain revelation shows a substantial amount of Ethereum has made its way to exchanges so far in March, suggesting that investors might be losing confidence in the long-term promise of the cryptocurrency.

Are Investors Losing Confidence In Ethereum?

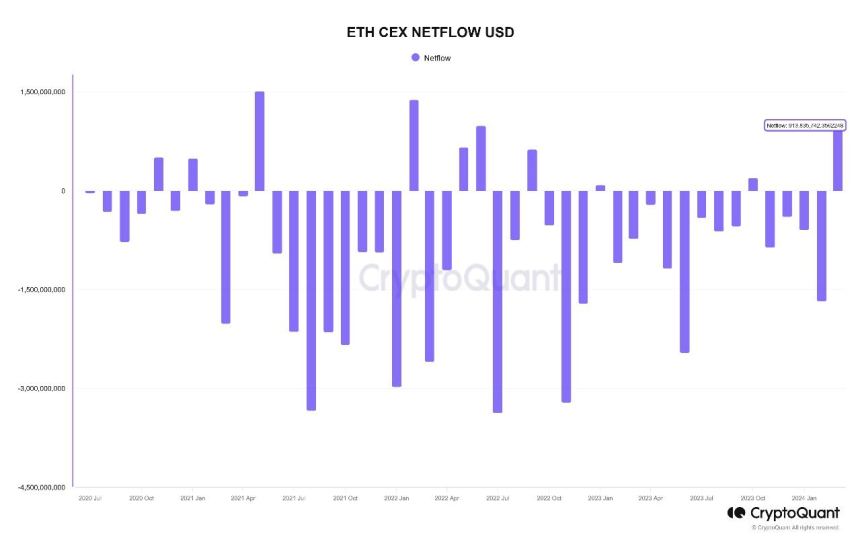
According to data from CryptoQuant, more than $913 million has been recorded in net ETH transfers to centralized exchanges so far in March. This on-chain information was revealed via a quicktake post on the data analytics platform.

This net fund movement represents the largest volume of Ethereum transferred to centralized exchanges in a single month since June 2022. Even though March is still a week from being over, this exchange inflow appears to be a complete deviation from the pattern observed over the past few months.

Ethereum

As shown in the chart above, October 2023 was the last time cryptocurrency exchanges witnessed a positive net flow. It is worth noting that there was significant movement of Ethereum tokens out of the centralized platforms in subsequent months up until this month.

Meanwhile, a separate data point that supports the massive exodus of ETH to centralized exchanges has come to light. Popular crypto analyst Ali Martinez revealed on X nearly 420,000 Ethereum tokens (equivalent to $1.47 billion) have been transferred to cryptocurrency exchanges in the past three weeks.

The flow of large amounts of cryptocurrency to centralized exchanges is often considered a bearish sign, as it can be an indication that investors may be willing to sell their assets. Ultimately, this can put downward pressure on the cryptocurrency’s price.

Substantial fund movements to trading platforms could also represent a shift in investor sentiment. It could be a sign that investors are losing faith in a particular asset (ETH, in this case).

Moreover, the recent regulatory headwind surrounding Ethereum specifically accentuates this hypothesis.  According to the latest report, the United States Securities and Exchange Commission is considering a probe to classify the ETH token as a security.

ETH Price

As of this writing, the Ethereum token is valued at $3,343, reflecting a 4% price decline over the past /4 hours. According to data from CoinGecko, ETH is down by 11% in the past week.

Ethereum

Bitcoin ETF Netflows May Experience Rebound If This Price Is Attained, Analyst Explains

In line with the decline in Bitcoin’s price, the spot Bitcoin ETF market has appeared rather gloomy in recent days. According to data from analytics firm BitMEX Research, these BTC ETFs have recorded a negative netflow for the last four trading sessions. 

This situation has been marked by large levels of Grayscale’s GBTC outflows and the record low inflows for the other ETFs, mainly the market leaders BlackRock’s IBIT and Fidelity’s FBTC. However, amidst these persistent declining netflows, Ki Young Ju, a prominent analyst and Chief Executive Officer at Cryptoquant, has predicted a possible resurgence in the spot Bitcoin ETF market.

Analyst Pinpoints $56,000 Level As Critical To Bitcoin ETF Recovery

In a post on X on March 22, Ki Young Ju shared that a rise in spot Bitcoin ETFs netflows could occur even as the BTC price decline continues. Using data from the historical netflow trends, the analyst noted that demand for Bitcoin ETFs usually kicks in when the cryptocurrency traces to certain support levels. 

Young Ju stated that, in particular, new BTC whales, especially ETF buyers, have shown to have a $56,000 on-chain cost basis. This suggests that the new significant holders of Bitcoin, particularly those invested in ETFs, usually purchased Bitcoin at an average price of $56,000.  Following this trend, the crypto quant boss believes the spot Bitcoin ETF market could experience massive inflows if BTC reached the specified price level.

For now, Bitcoin’s price has oscillated between $62,000 and $68,000, as seen in the last week. However, Young Ju believes that such a descent is quite feasible as price corrections usually see a maximum decline of 30%. Using BTC’s most recent high of $73,750, the analyst predicts the asset price could still trade as low as $51,000. 

BTC Price Overview

At press time, Bitcoin continues to trade at $64,065.74, representing a decline of 3.73% and 7.17% in the last one and seven days. Meanwhile, the asset’s daily trading volume is down 3.53% and valued at $39.62 billion. 

Following historical trends of the bull cycle, it is possible that BTC may have reached its price peak leading up to the halving event in April. If that is the case, Bitcoin may likely not return to previous high price levels soon and could experience further price drops in the coming weeks.  

Bitcoin

CryptoQuant’s Bitcoin “Bull-Bear” Indicator Flags Price As Overheated

The Bitcoin “bull-bear” indicator from the on-chain analytics firm CryptoQuant has recently flagged the cryptocurrency’s price to be “overheated.”

Bitcoin May Be Overheated According To This Indicator

As pointed out by CryptoQuant Head of Research Julio Moreno in a post on X, the BTC price has increased so fast that some on-chain indicators have started to signal a potential phase of overheating.

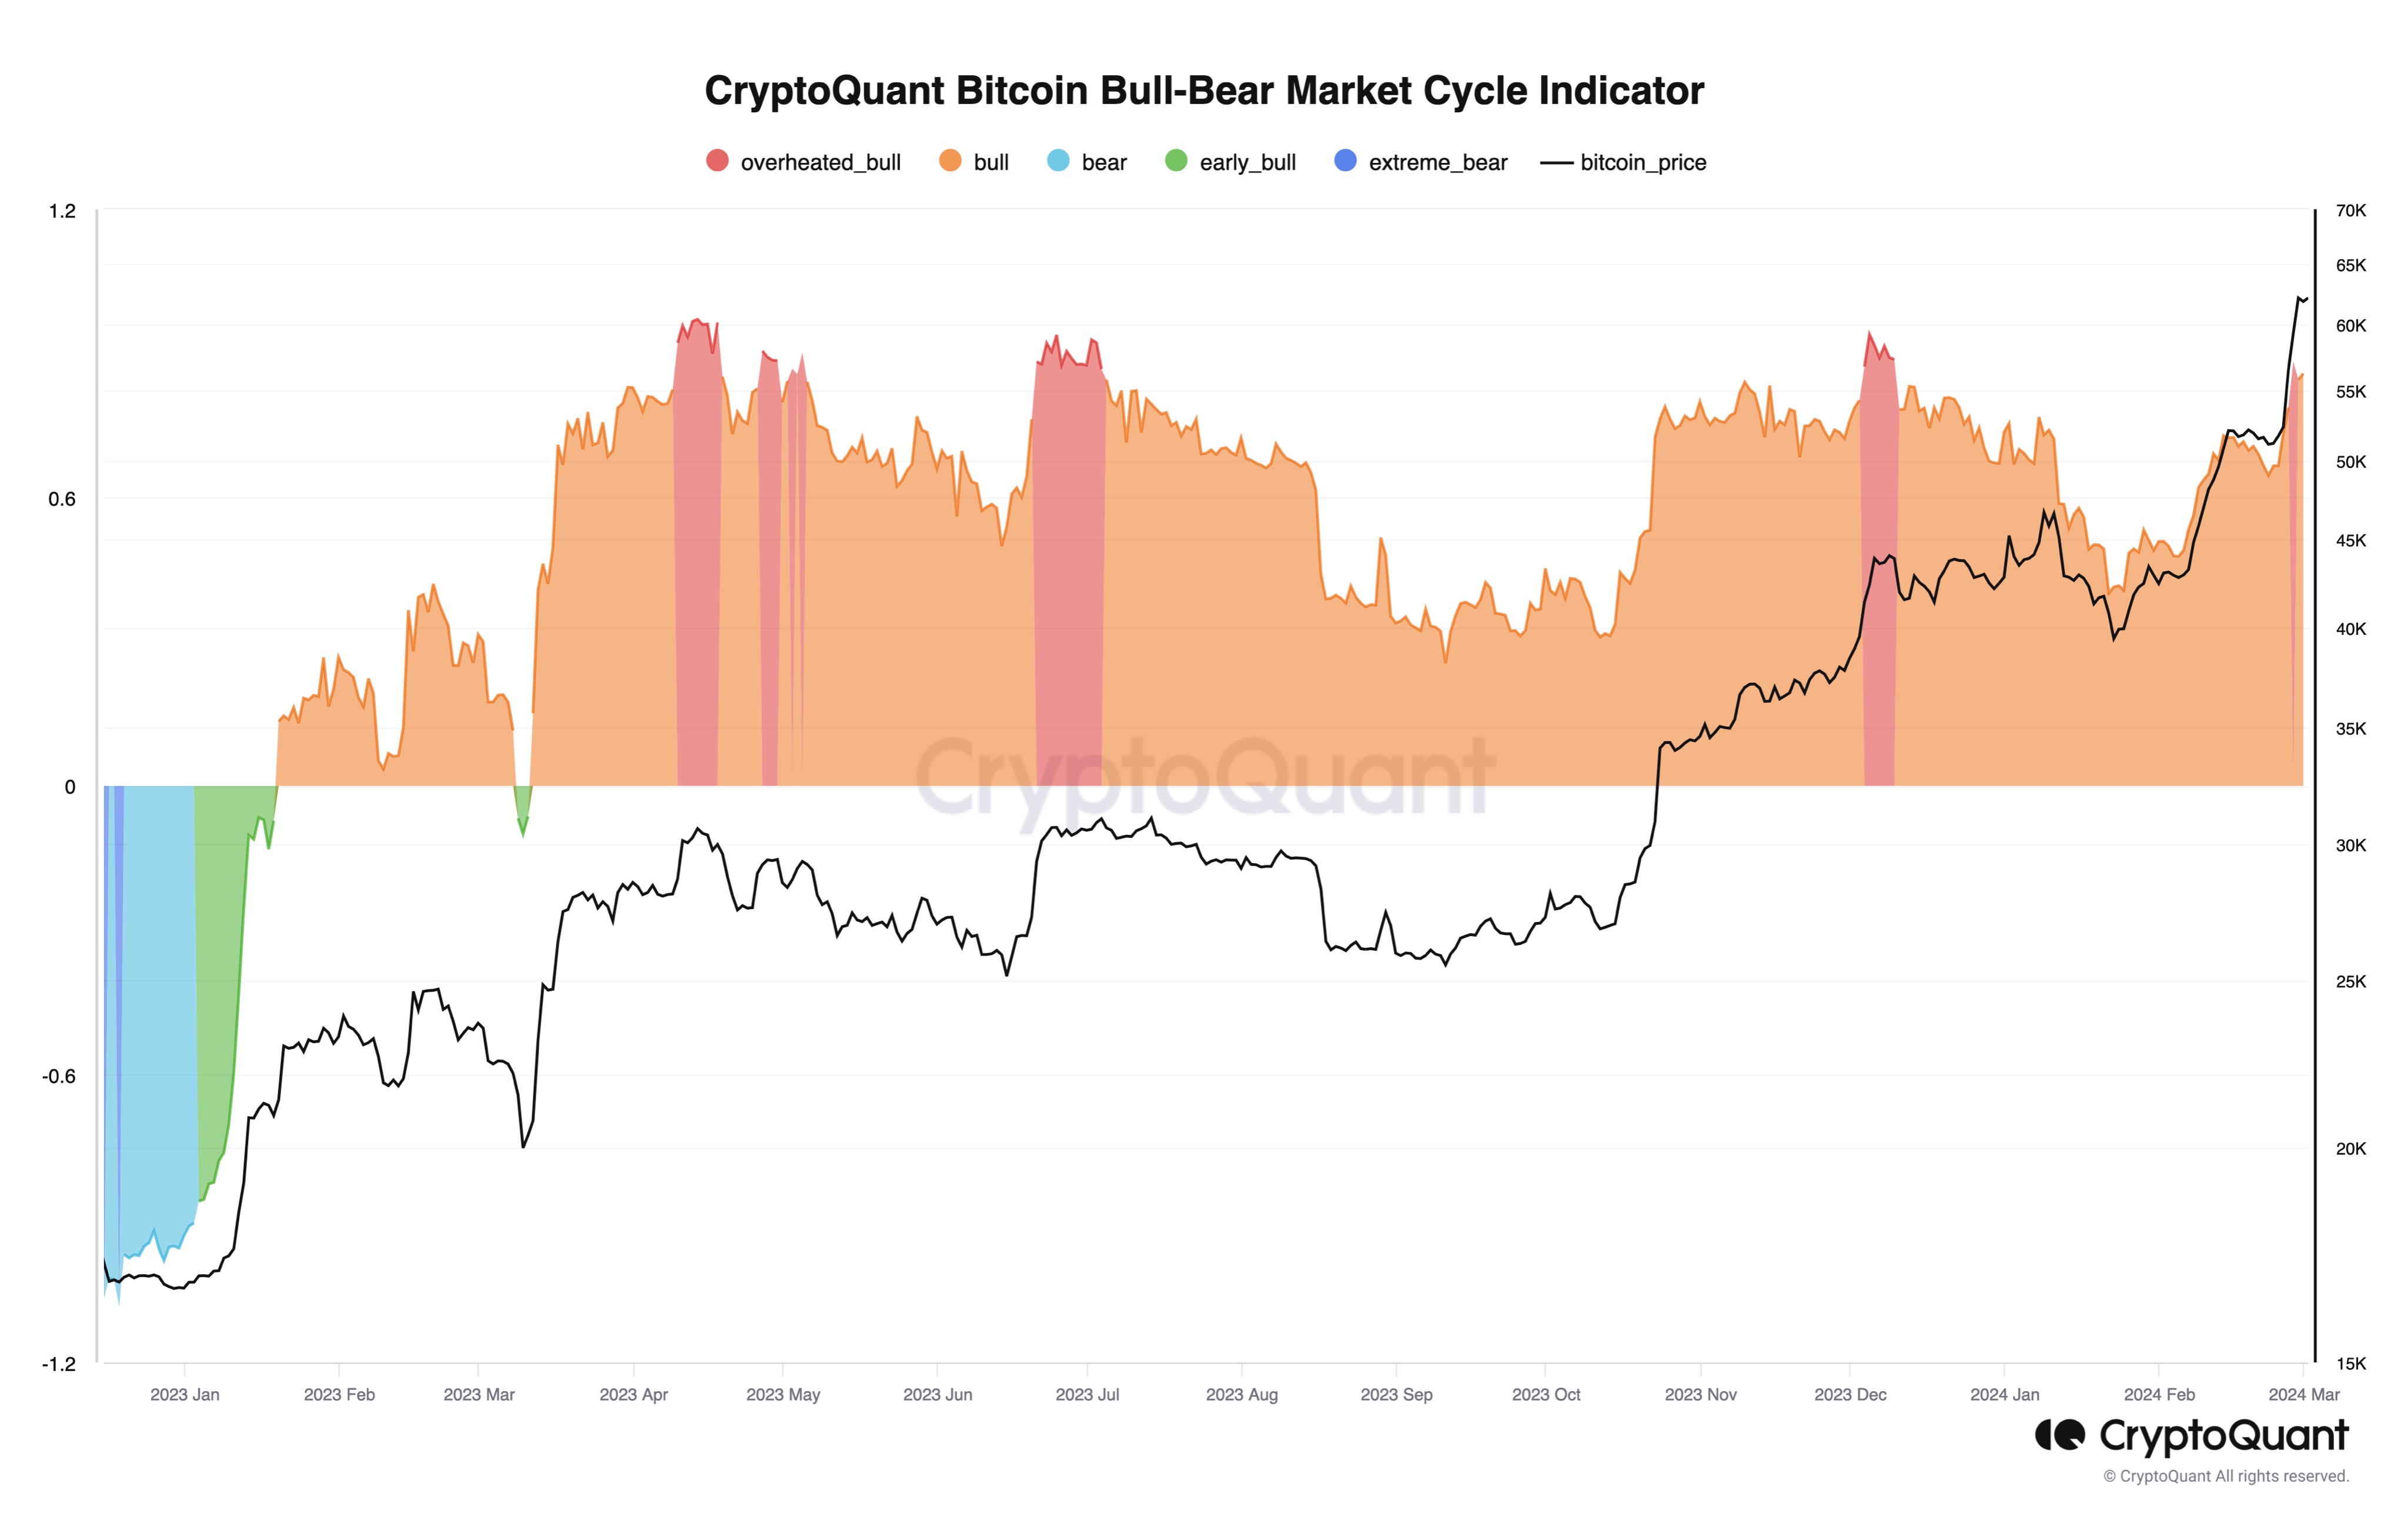
The first metric of interest here is the Bitcoin Bull-Bear Market Cycle Indicator made by the analytics firm that tracks the various phases of bull and bear markets.

Here is how the indicator has looked like over the past year:

Bitcoin Bull-Bear Indicator

As displayed in the above graph, Bitcoin has been inside the “bull” territory since the early part of 2023 and over the course of this run, the metric has hit “overheated bull” levels during a few different instances.

From the chart, it’s visible that such values of the indicator have previously coincided with some kind of top in the cryptocurrency’s price. With the latest rally in the asset, it would appear that the market has once again entered into this territory of overheating.

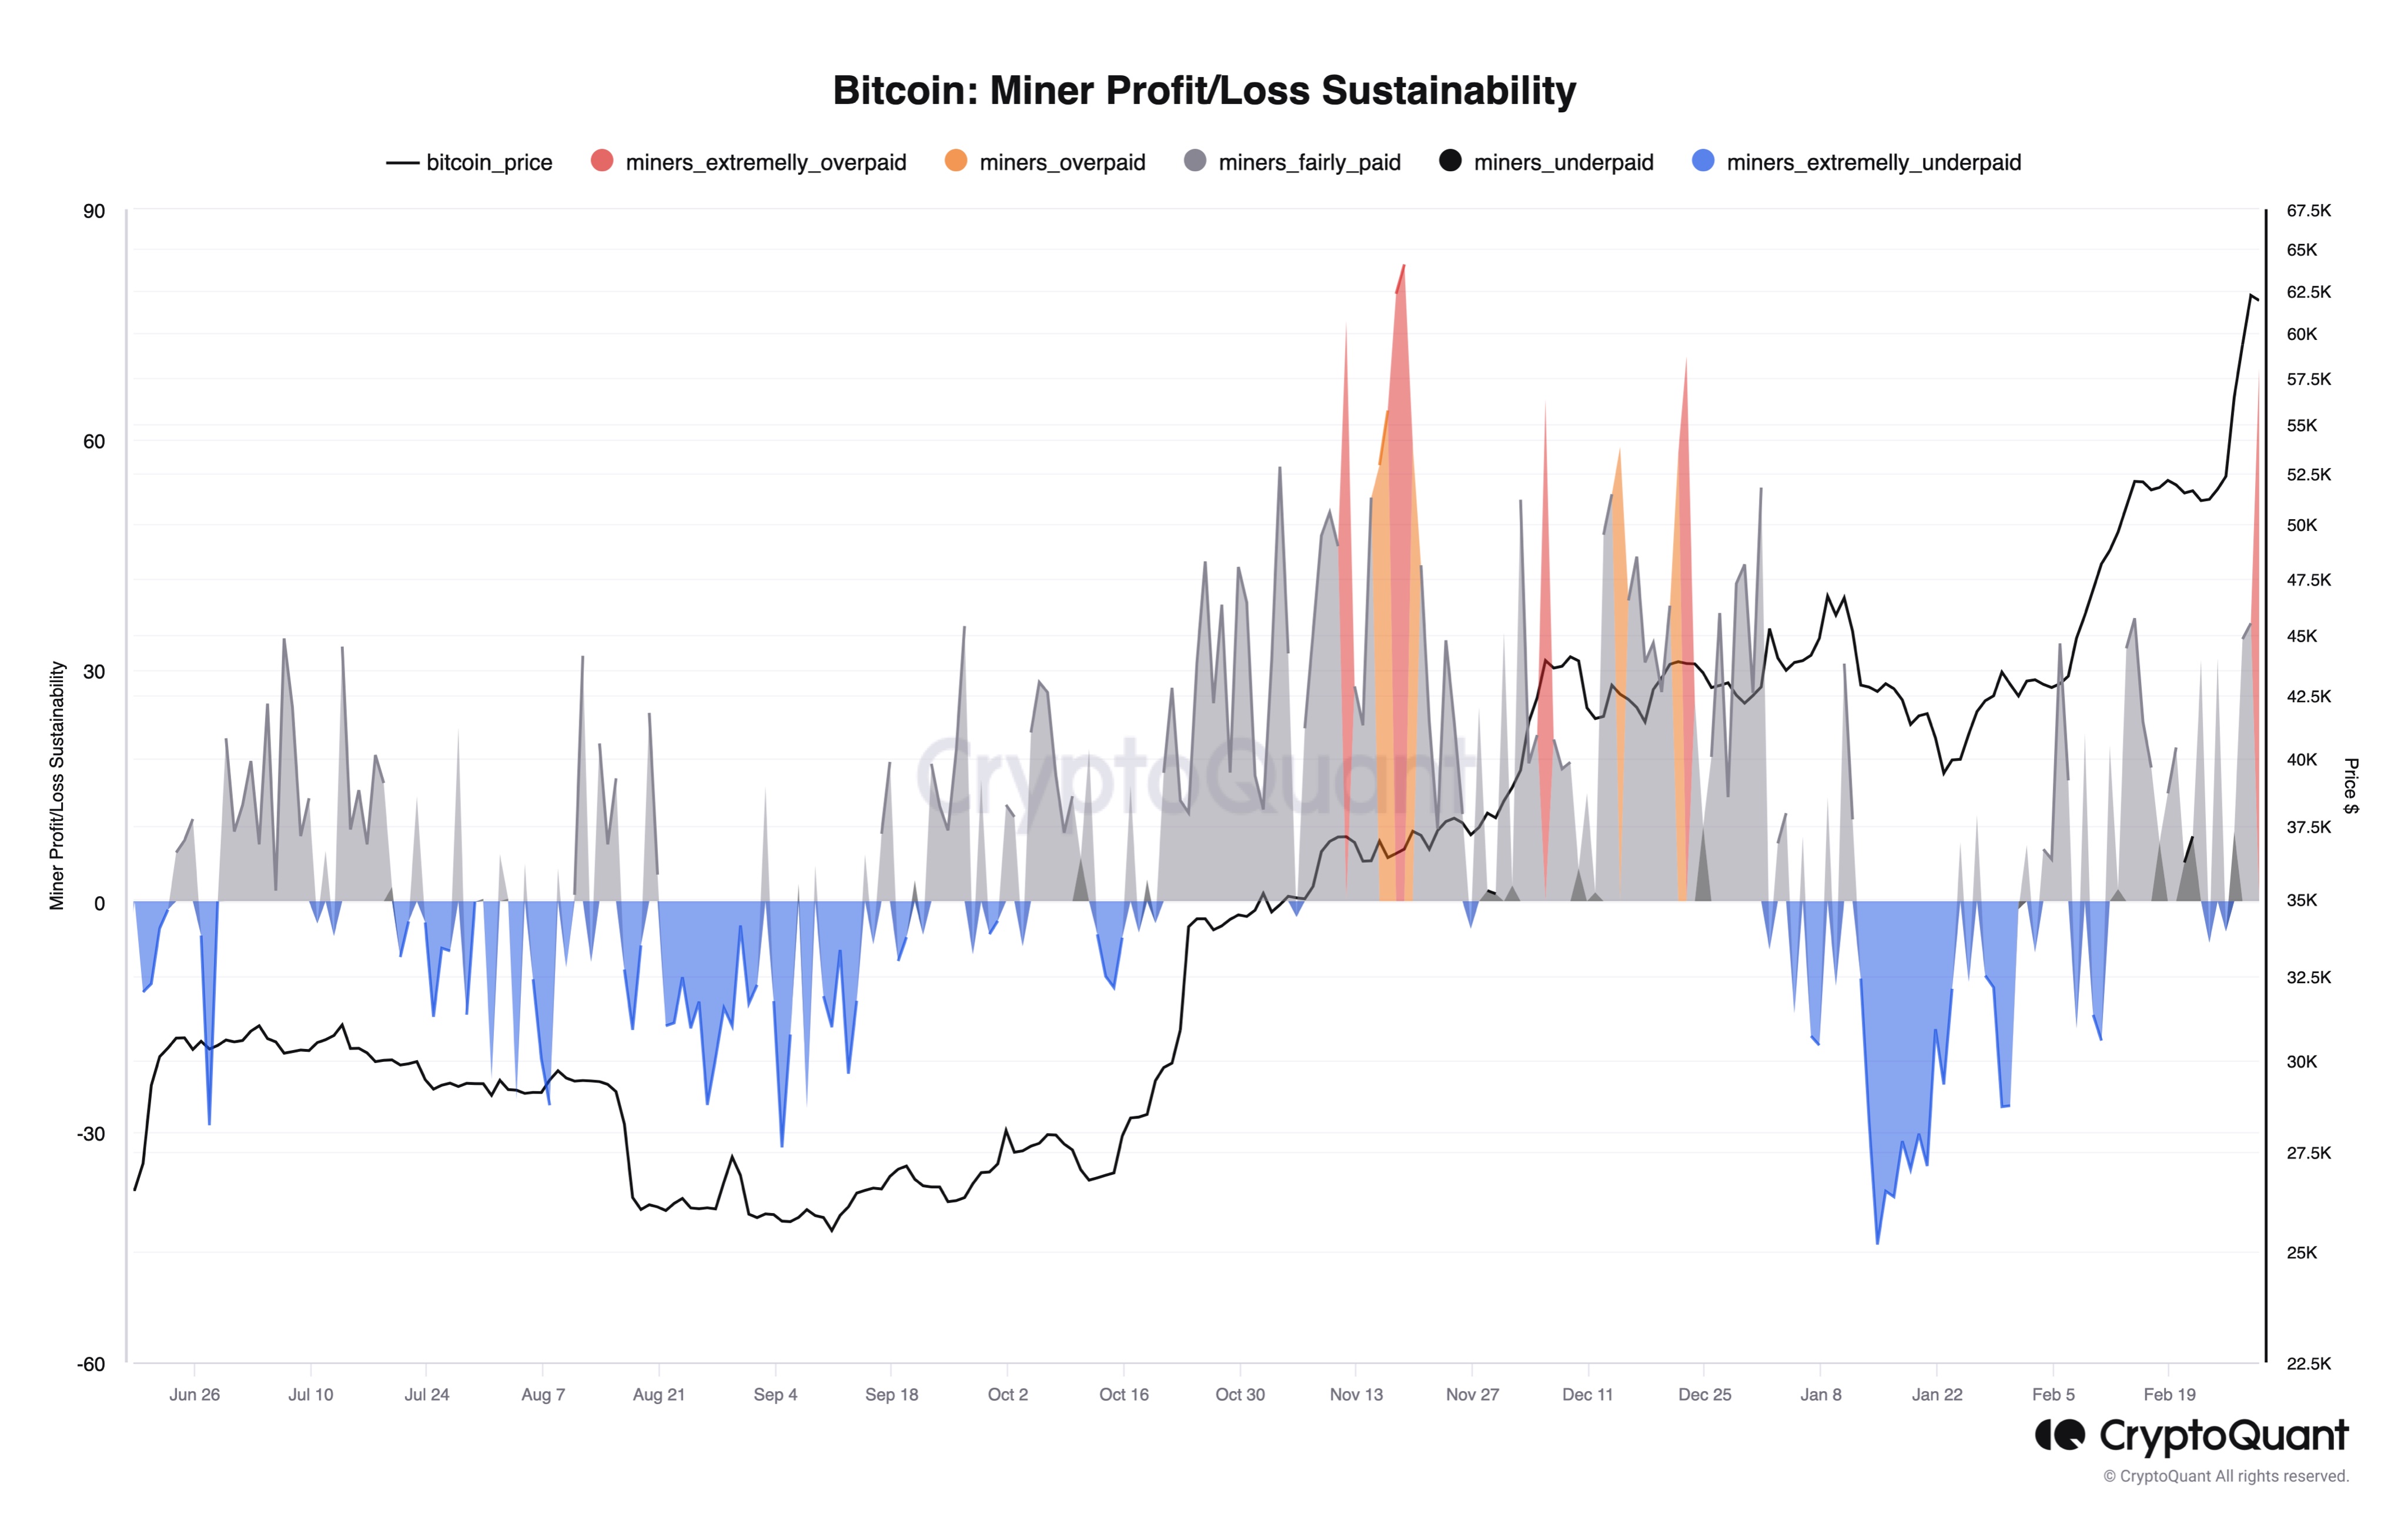
Another metric, the BTC “Miner Profit/Loss Sustainability,” is also suggesting an overheated market, according to Moreno. This indicator basically keeps track of whether the miners are being overpaid or underpaid compared to the fair value baseline.

Bitcoin Miners

As displayed in the chart, the Bitcoin Miner Profit/Loss Sustainability has entered into the “extremely overpaid” zone after the price surge, implying that a cool off might perhaps be due.

Finally, the Bitcoin short-term holders (STHs) are also sitting on large profits at the moment, which can be another sign that things have started to heat up.

Bitcoin Short-Term Holders

The STHs refer to the Bitcoin investors who bought their coins within the past 155 days. These holders are considered the weak hands of the sector, who may easily sell at the sight of FUD or FOMO.

As the above chart shows, this cohort’s unrealized profits have swelled up as the Bitcoin price has enjoyed its rally. Recently, they have achieved profit margins upward of 45%.

At any point, holders in profits are more likely to sell their coins. As these profits rise, the probability of the investor buckling into the allure of profit-taking also increases.

As such, a large amount of these fickle-minded Bitcoin investors holding significant profits means that there is a high risk of a potential selloff taking place in the market.

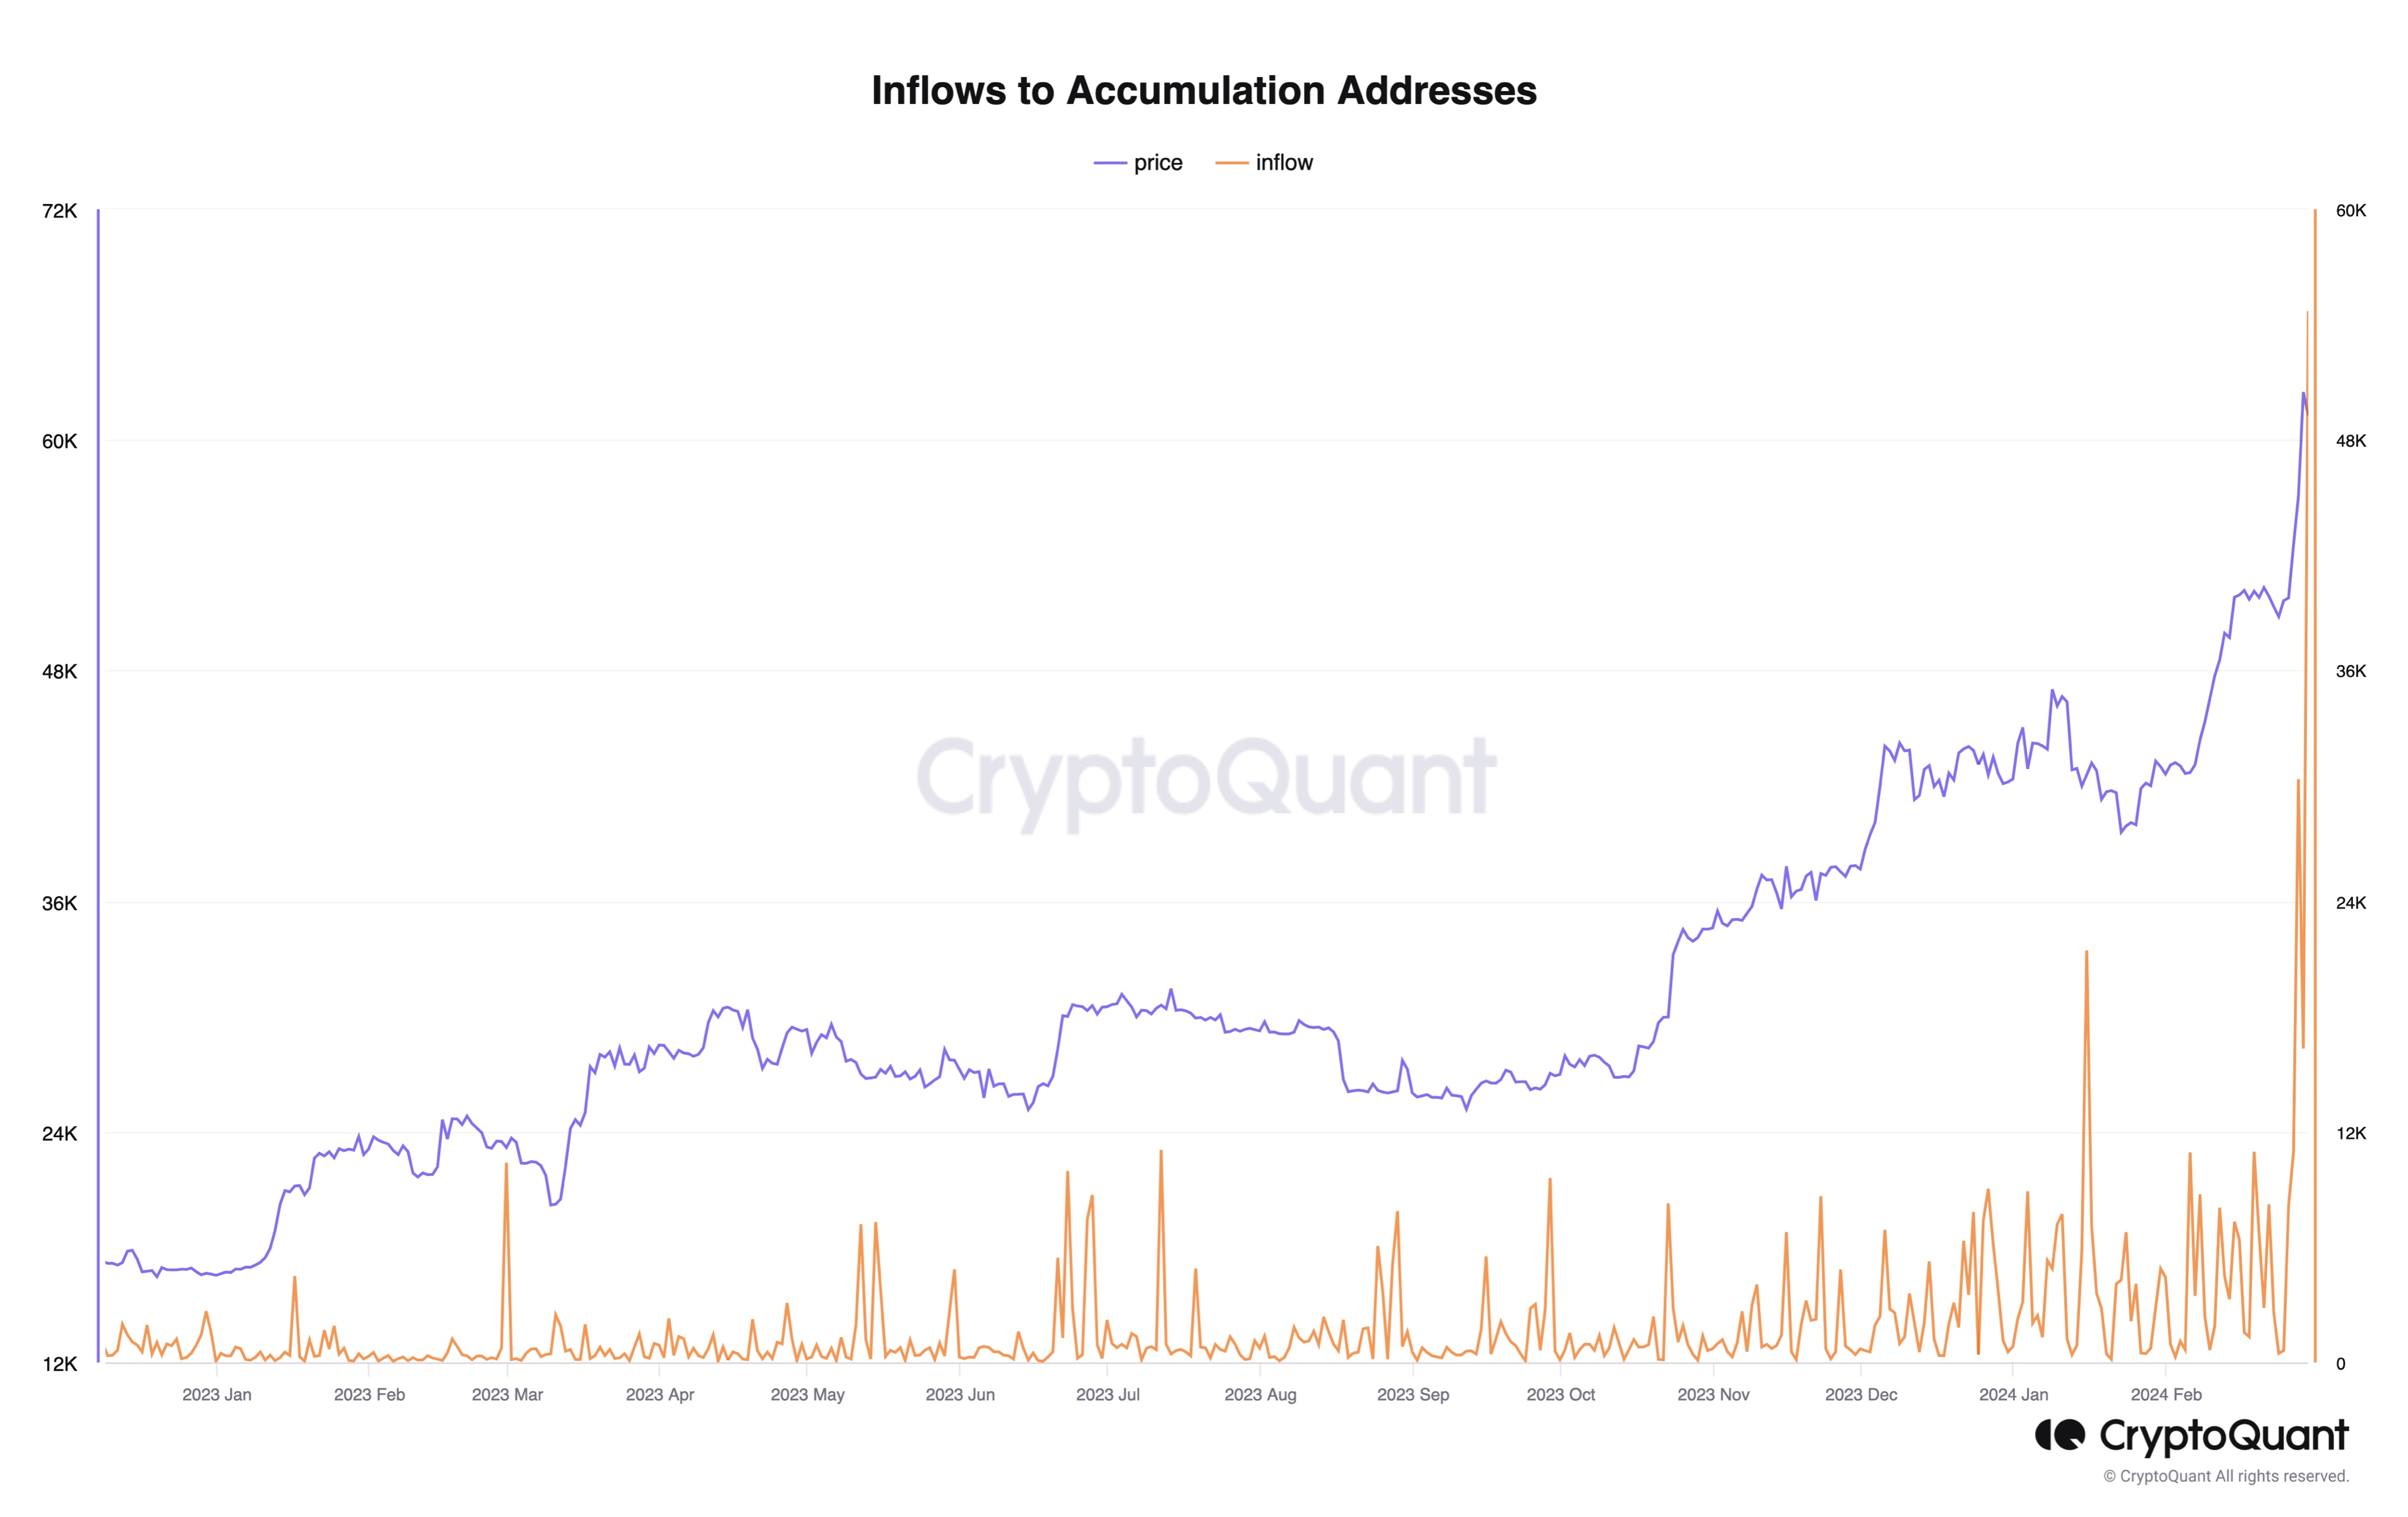
While all these indicators are pointing to the cryptocurrency perhaps being overvalued, there has still been a positive development in an indicator. This metric is the “Inflows to Accumulation Addresses.”

Bitcoin Accumulation

Accumulation addresses are defined as those that have a history of only buying Bitcoin and never of selling. At present, these HODLers are observing an all-time high amount of inflows, which can definitely be a bullish sign.

BTC Price

Bitcoin has seen the latest continuation to its run in the past 24 hours as its price has now broken past the $65,100 barrier.

Bitcoin Price Chart

800,000 ETH Flow Out Of Centralized Exchanges In 2024 – Bullish Sign For Ethereum Price?

The price of Ethereum has been a joy to watch since the start of 2024, climbing by more than 30% in less than two months. The latest on-chain revelation suggests that ETH investors are approaching the market with more confidence, as the cryptocurrency’s price rally seems to be far from over.

$2.4 Billion Worth Of ETH Leaves Exchanges: CryptoQuant

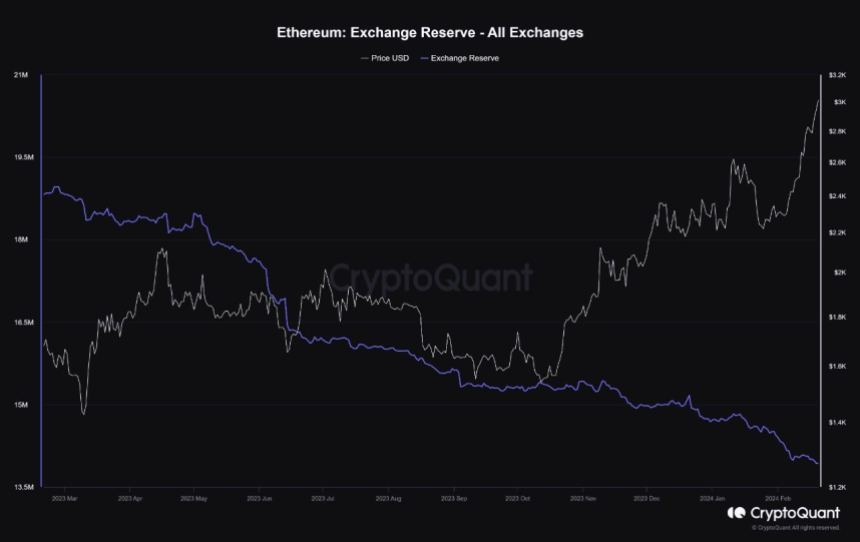
A pseudonymous analyst on CryptoQuant’s Quicktake revealed that significant amounts of the Ethereum token have been making their way out of exchanges in the last few weeks. This observation is based on the “Exchange Reserve” metric, which tracks the amount of ETH tokens in the wallets of all centralized exchanges.

When the value of this metric increases, it implies that investors are making more deposits than withdrawals of an asset (Ether, in this case) into centralized exchanges. Meanwhile, the metric’s decline means that more assets are flowing out than entering these platforms.

According to data from CryptoQuant, more than 800,000 ETH (equivalent to approximately $2.4 billion) has flowed out of cryptocurrency exchanges since the turn of the year. Typically, the movement of significant amounts of cryptocurrencies out of these platforms suggests a rise in investor confidence.

Ethereum

As the CryptoQuant Quicktake author noted, this reduction in Ether’s exchange reserve balance could be a bullish catalyst for the altcoin’s price. A sustained decline in the ETH’s supply on exchanges could trigger a supply crunch, potentially driving the Ethereum price higher.

As of this writing, the Ethereum price stands at around $2,920, reflecting a 1.8% decline in the past day. Nevertheless, the “king of altcoins” is still in the green on the weekly timeframe, with an almost 5% price jump over the last week.

Ethereum Price Rise Due To Anticipation Of Dencun Upgrade: Grayscale

In a recent report, Grayscale has offered commentary on Ethereum’s positive price performance so far in 2024. The asset management firm tied ETH’s bullish trajectory to the upcoming Dencun upgrade of the Ethereum network.

William Ogden Moore, Grayscale’s research analyst, wrote in the report:

We believe that recent price performance reflects the market’s anticipation of this upgrade, as Ethereum (up 26% YTD) has outperformed the broader Smart Contract Platforms Sector (up 3% YTD) since January 1st, 2024.

The Dencun upgrade, which is less than a month away, will aim to enhance Ethereum in terms of scalability and cost-effectiveness. It is also expected to help the network compete with “faster chains in the Smart Contract Platforms Crypto Sector, such as Solana.”

Another narrative that may be propelling the price of ETH is the approval of Ethereum spot exchange-traded funds (ETFs) in the United States. Interestingly, Grayscale is amongst the asset managers looking to debut an Ether spot ETF.

Ethereum

Crypto CEO Drops Bombshell Discovery Why Bitcoin Price Is Muted Post-ETFs

Despite the landmark launch of spot Bitcoin Exchange-Traded Funds (ETFs) spearheaded by industry behemoths BlackRock and Fidelity—ranking among the top five ETF launches in their initial month of all time—BTC’s price response has been notably subdued. Prior to the launch of these EFTs, BTC soared to a peak of $49,040 on January 11.

Fast forward to today and BTC is currently settling at $51,000, marking a modest appreciation of 4.3%. This tepid performance has puzzled market observers, particularly in light of massive net inflows of $5.278 billion into all Bitcoin ETFs within a mere six-week span. These could have been even significantly higher if there would have been $7.398 billion in outflows from Grayscale’s GBTC.

The Bombshell Discovery

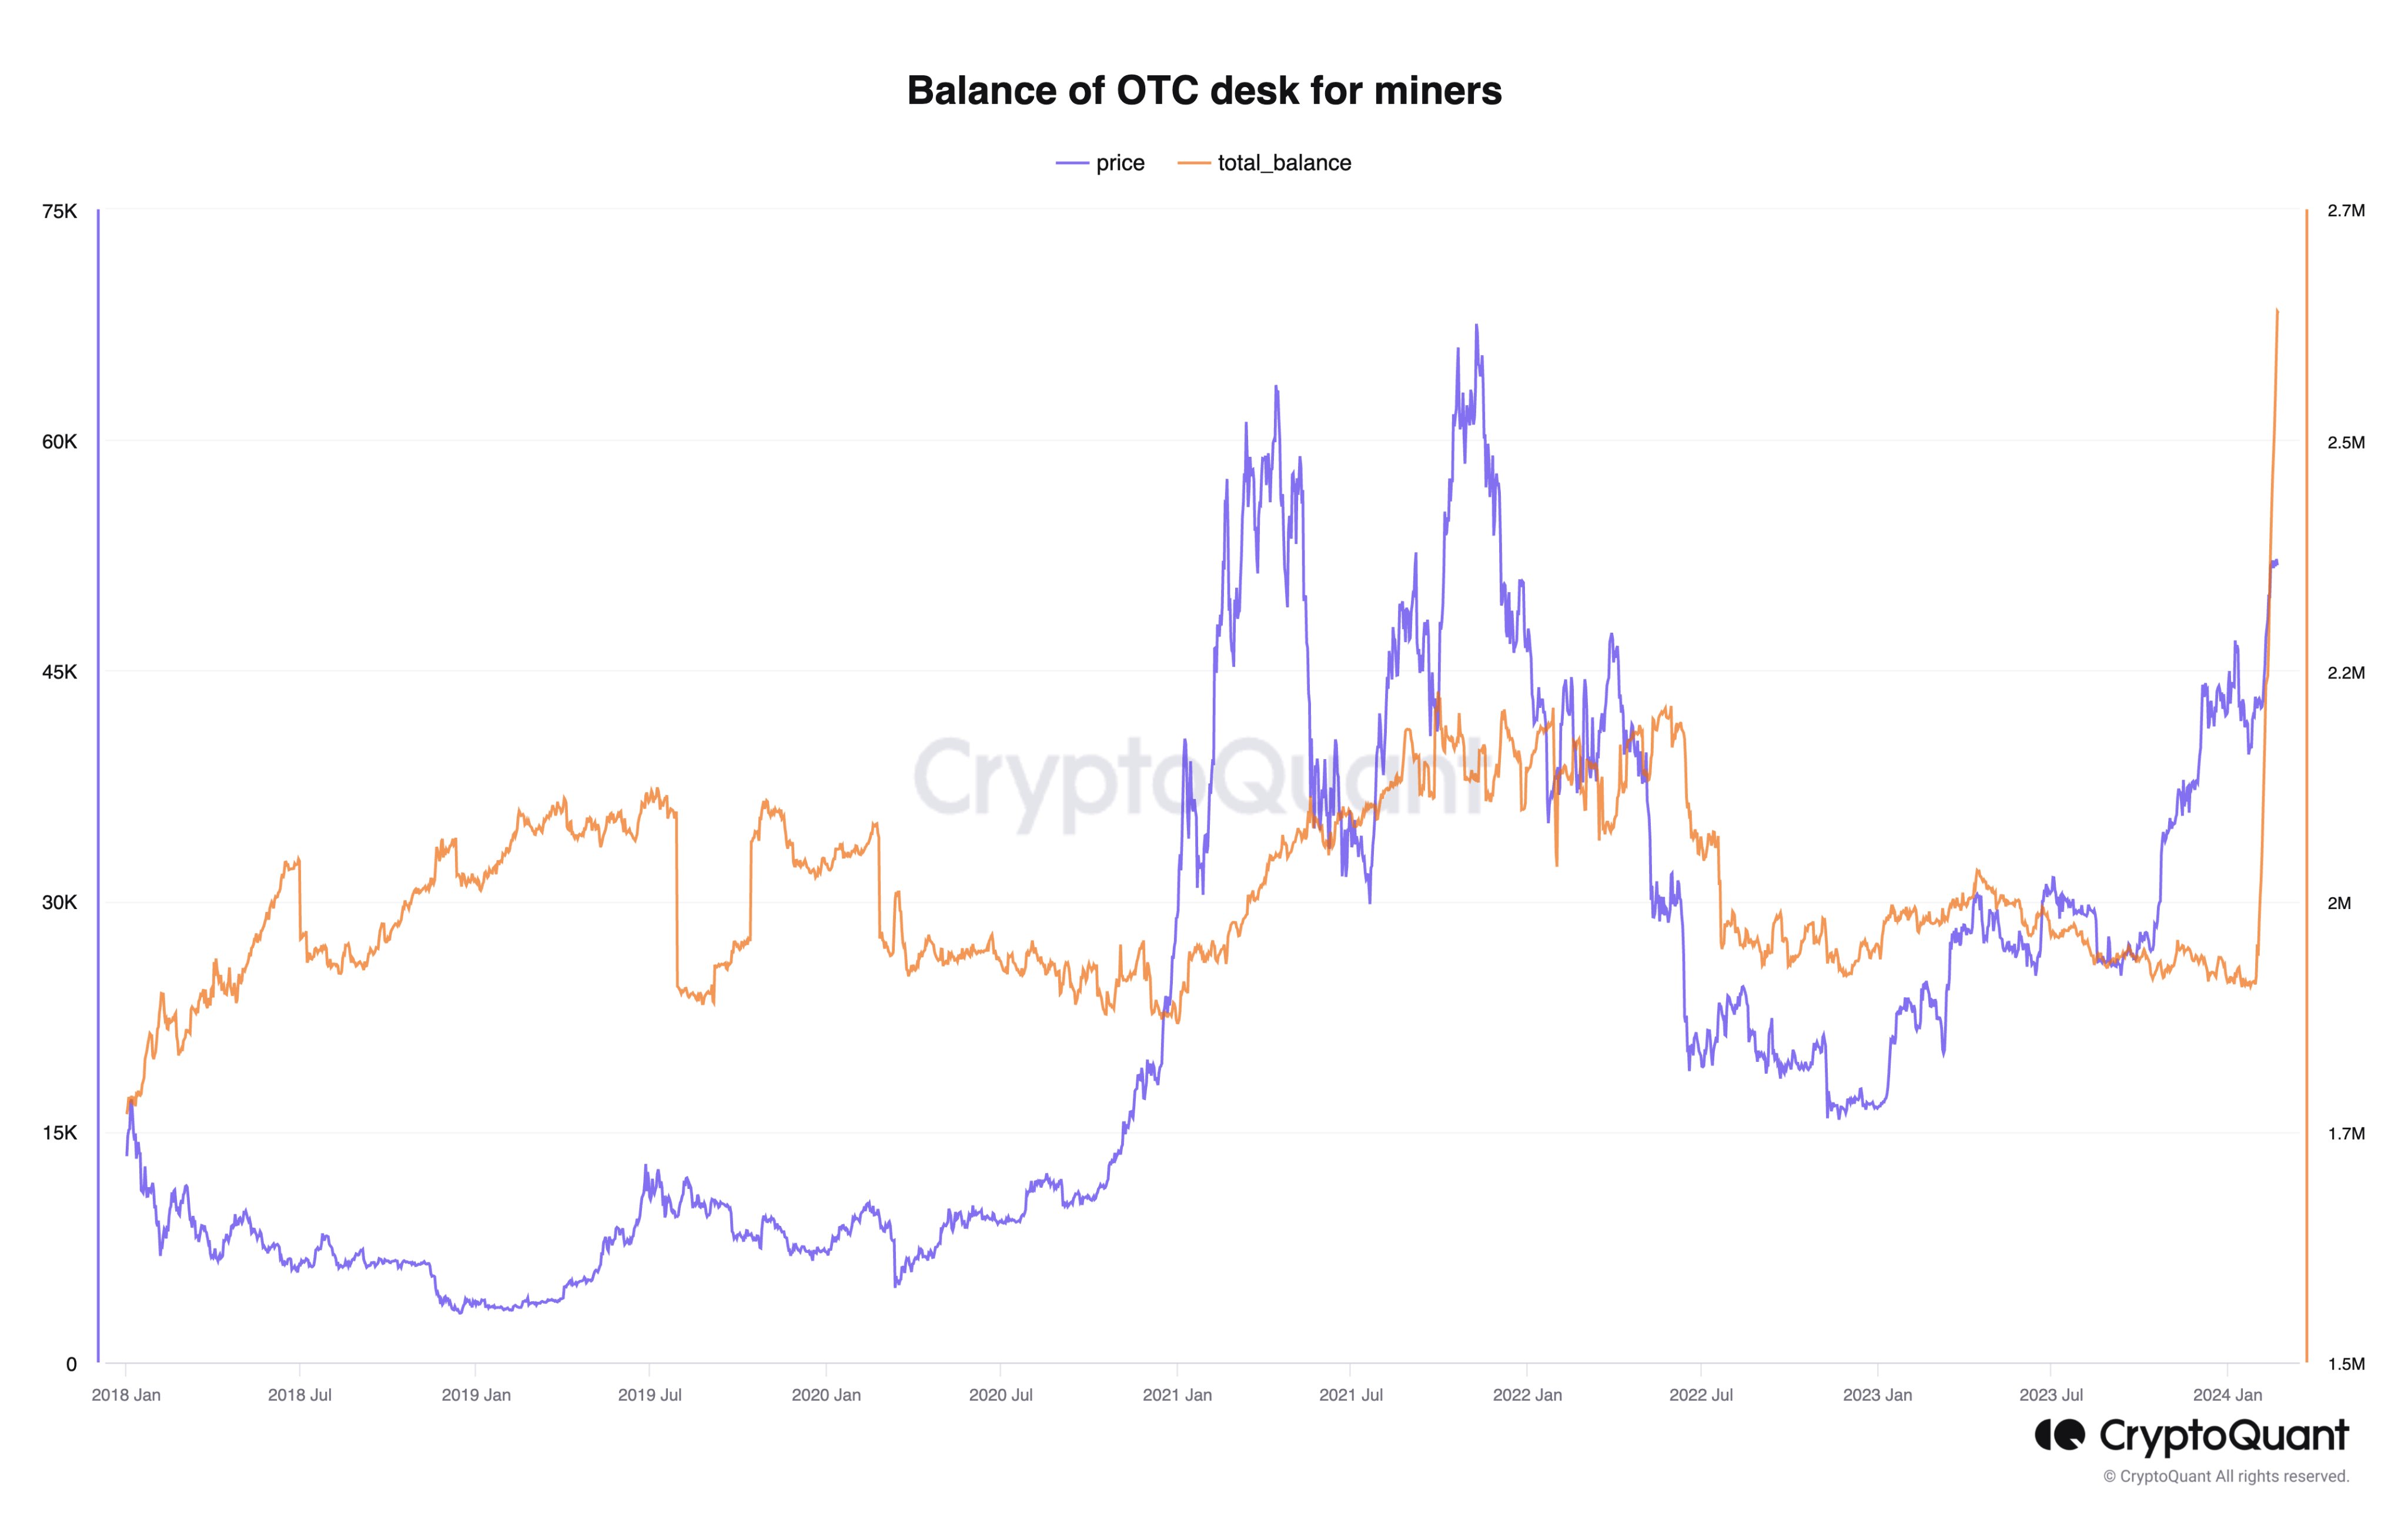
Yet, CryptoQuant CEO Ki Young Ju may now have found the “real” reason that has had an even bigger impact on Bitcoin’s price action in recent weeks. Ju’s analysis highlights the transfer of over 700,000 BTC to Over-The-Counter (OTC) desks predominantly utilized by miners in the weeks succeeding the spot Bitcoin ETF approvals—an equivalent of approximately $35.6 billion at current prices.

He shared the below chart and stated: “700K BTC has moved to OTC desks used by miners over the past three weeks following spot Bitcoin ETF approval.” This revelation has sparked a reevaluation of the impact of such substantial transfers on the market dynamics of Bitcoin.

BTC OTC transactions

Ju later corrected his statement slightly and explained, “Got some questions about the data accuracy. These OTC addresses are not only used by miners. It could be used by other whales. We’ll let you know what addresses caused this spike,”acknowledging the complexity and multifaceted nature of these transactions.

The Bitcoin OTC Mechanism Explained

OTC desks facilitate direct transactions between two parties, unlike open exchanges where orders are matched among various participants. This method of trading can handle large volumes of Bitcoin without immediately affecting the market price.

When substantial amounts of BTC are bought or sold on public exchanges, the sudden increase in supply or demand can lead to significant price volatility. By opting for OTC transactions, large buyers, such as ETF issuers, can accumulate Bitcoin in vast quantities without triggering a steep price increase that would inevitably follow if these purchases were made on spot markets.

Thus, Ju theorizes that the issuers behind the newly launched Bitcoin ETFs are strategically purchasing Bitcoin via OTC desks. This approach serves a dual purpose: it allows these entities to fulfill the demand from ETF investors by securing enough Bitcoin to back the ETF shares while simultaneously mitigating the immediate price impact that such large-scale purchases would have if conducted on open exchanges.

The essence of Ju’s claim is that if the 700,000 BTC had been bought on the spot market instead of through OTC channels, the influx of demand would have likely propelled Bitcoin’s price significantly higher than the observed 4.3% increase. This subdued price action, therefore, could be attributed to the strategic use of OTC transactions by ETF issuers and other large-scale buyers.

However, there is also a silver lining. What will happen if the miners can only sell half of the current supply following the upcoming BTC halving in April, but the demand remains? Moreover, this constraint isn’t limited to miners alone.

Given that the OTC supply is finite and likely depleting rapidly, it appears inevitable that a supply shock could impact the market once the OTC reserves are fully tapped. When entities like BlackRock and others are compelled to purchase Bitcoin on the open market to back up their ETFs, the BTC price could react swiftly.

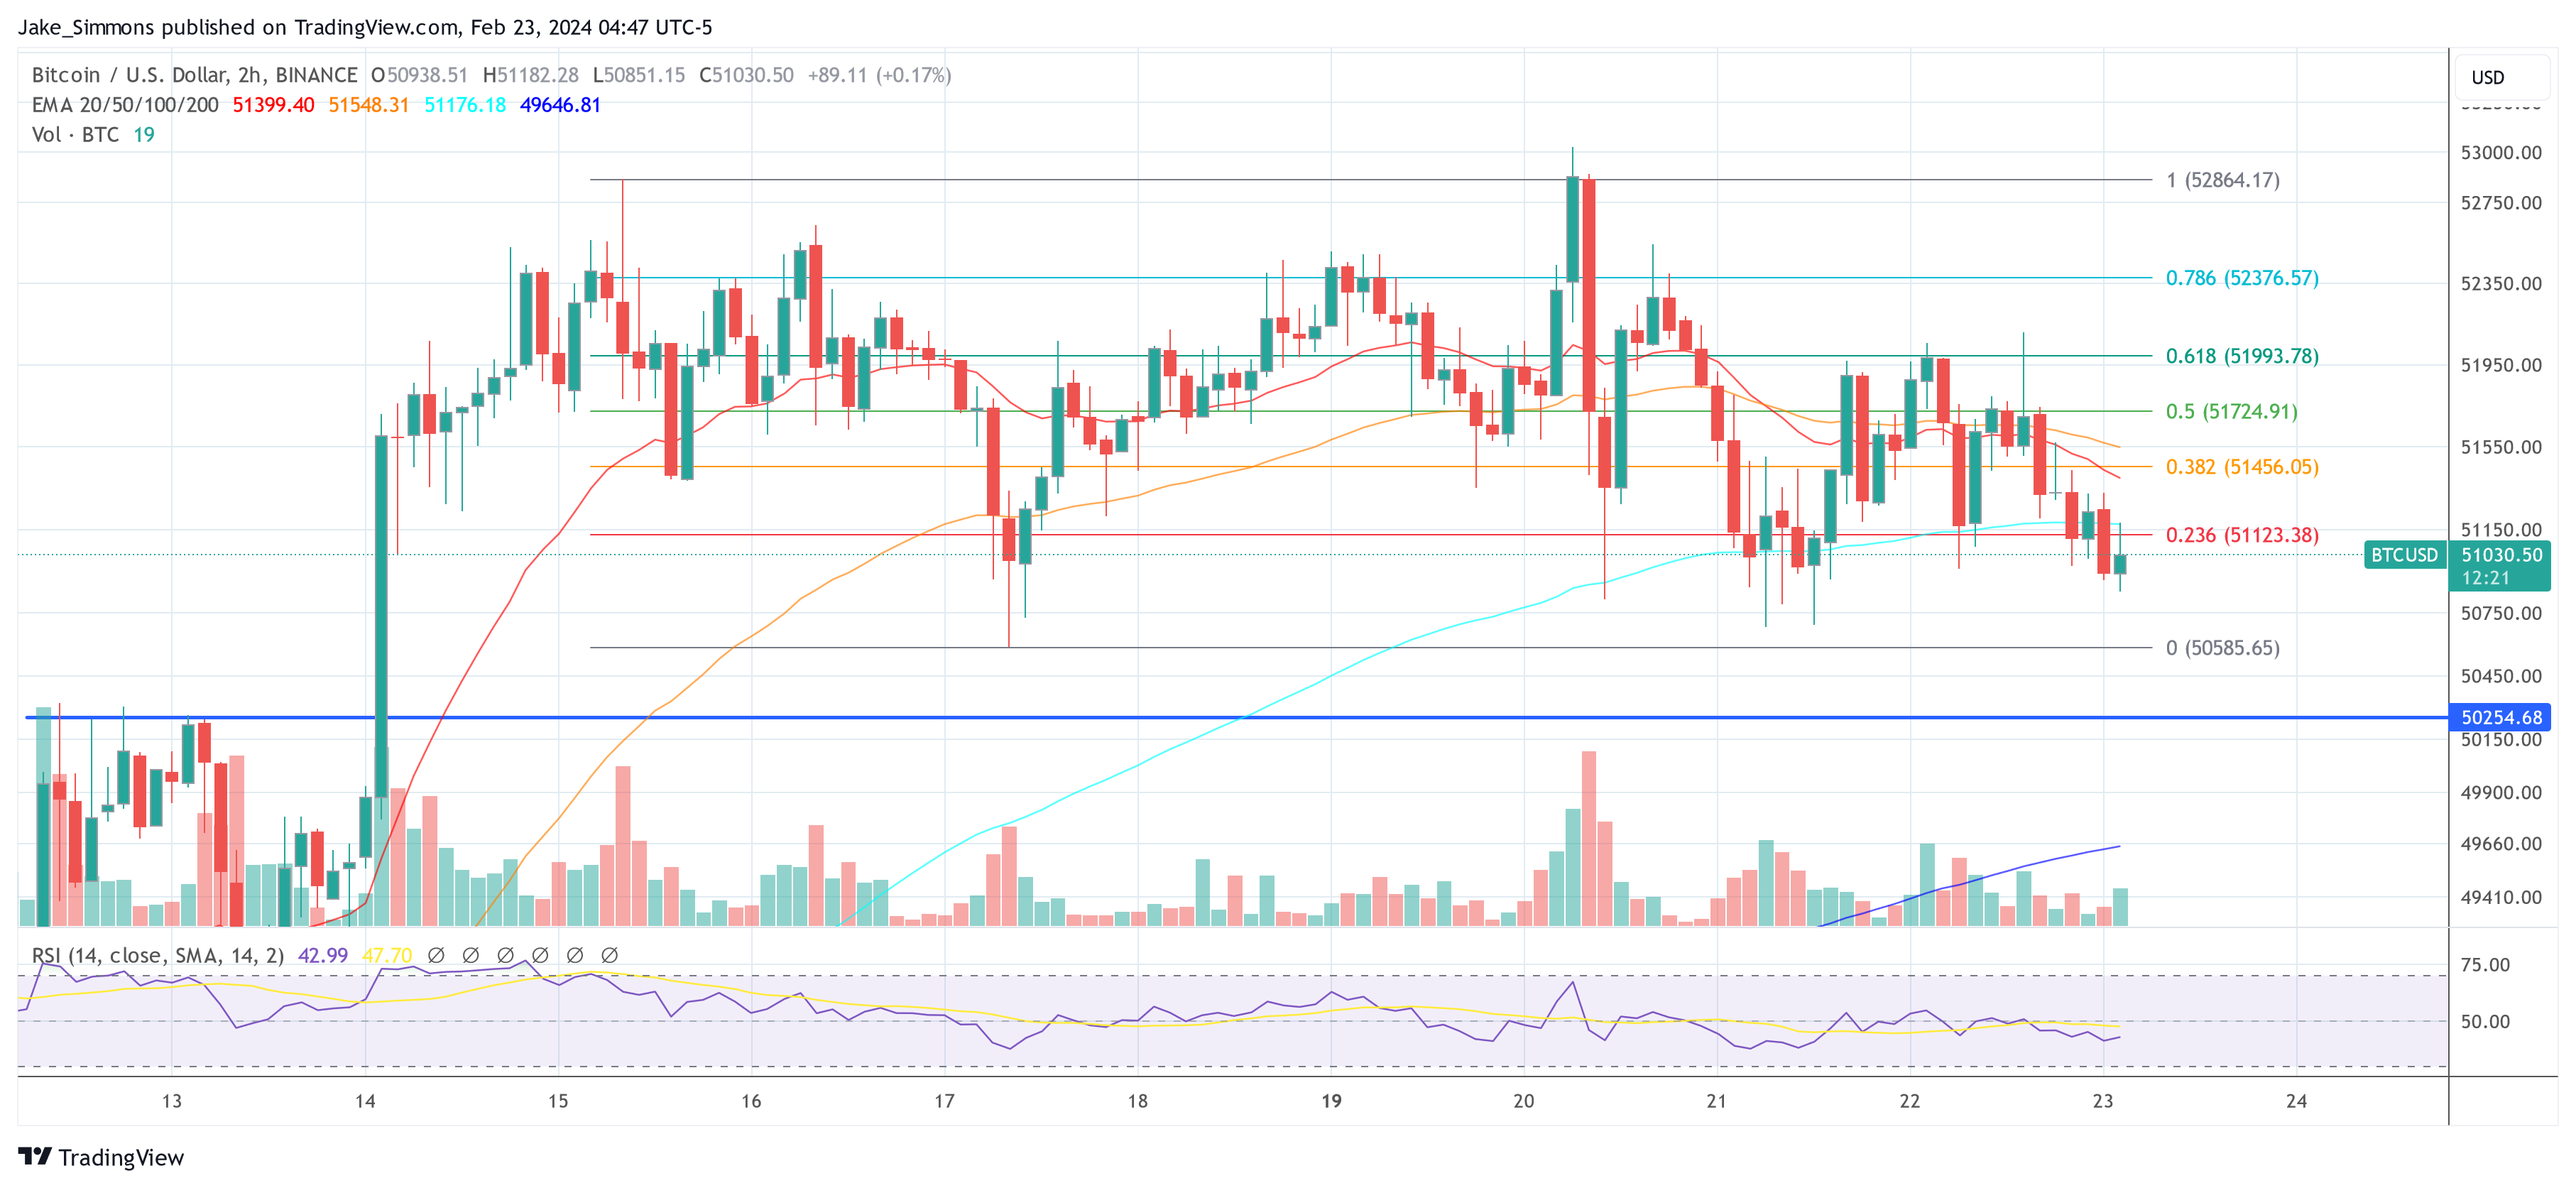
At press time, BTC traded at $51,030.

Bitcoin price

CryptoQuant Founder Puts $112,000 Target For Bitcoin This Year

The founder of on-chain analytics firm CryptoQuant has said Bitcoin could reach a target of $112,000 this year driven by the ETF inflows.

Bitcoin May Hit $112,000 Based On Inflows Into The ETFs

In a new post on X, CryptoQuant CEO and founder Ki Young Ju talked about the outlook of the cryptocurrency based on the inflows going towards the spot exchange-traded funds (ETFs).

The analyst has used the “Realized Cap” indicator to find price targets for the coin. The Realized Cap refers to a capitalization model for Bitcoin that calculates the total valuation of the asset by assuming that the real value of any coin in circulation is the price at which it was last transacted on the blockchain.

If the previous transaction of any token is assumed to have involved a change of hands for it (that is, buying and selling took place), then the last transfer price would correspond to the cost basis of the coin.

As the Realized Cap essentially adds up the cost basis of all the investors, one way to look at the metric is as a measure of the total amount of investment the holders have put into the coin.

Naturally, the Realized Cap pushes up as trades occur at a higher spot price. Something that could be particularly influential for the Realized Cap this cycle may be the spot ETF inflows.

The spot ETFs, which finally got approval from the US Securities and Exchange Commission (SEC) last month, have been buying up Bitcoin at relatively high prices to add to their holdings, thus elevating the Realized Cap.

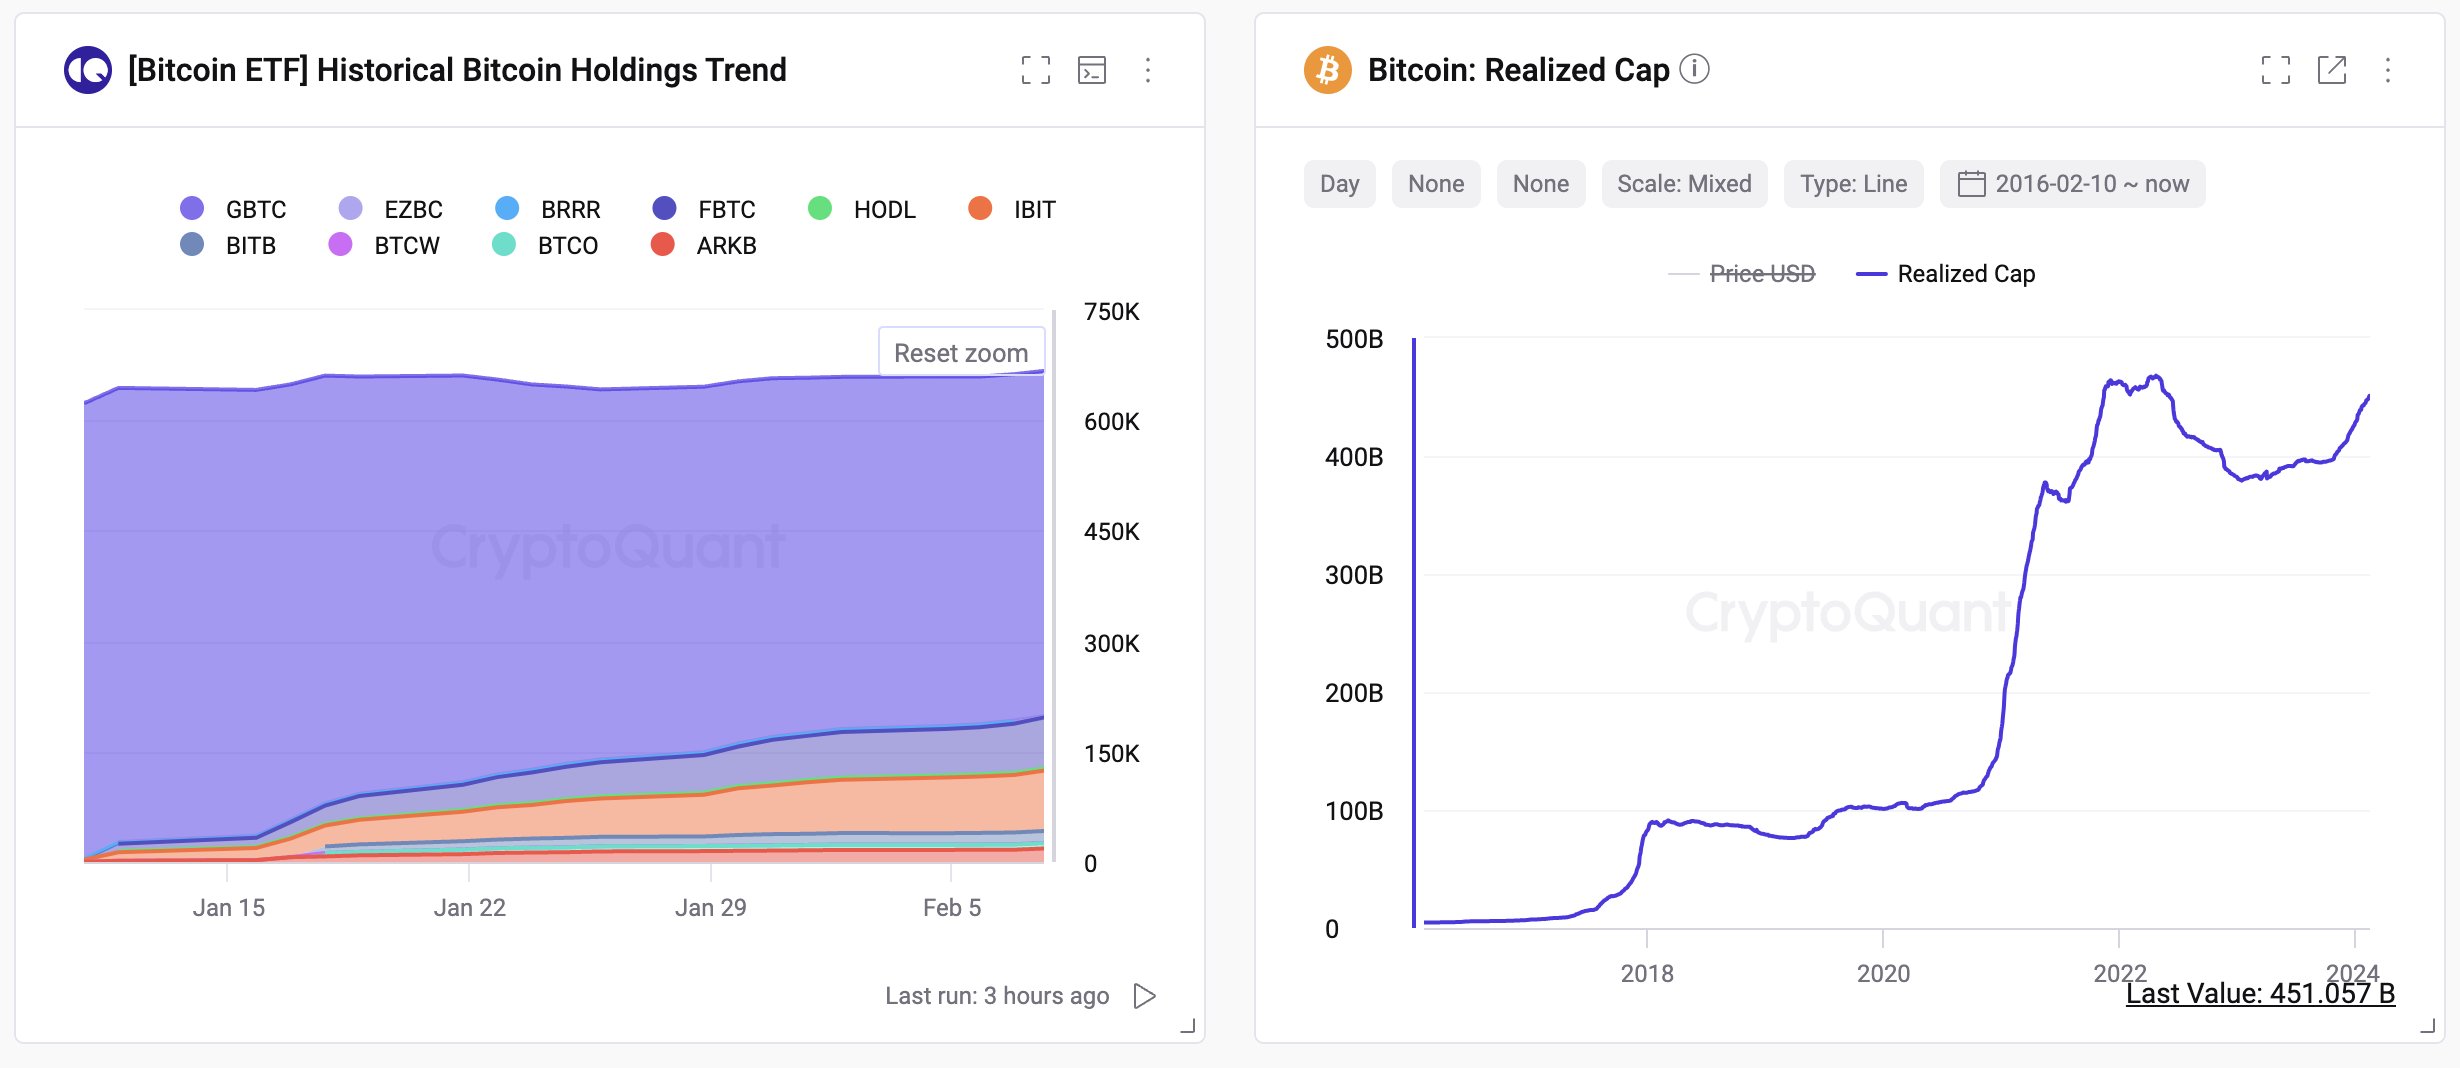
The chart below shows the data for the holdings of the spot ETFs and the Bitcoin Realized Cap.

Bitcoin ETF Holdings

“Bitcoin market has seen $9.5B in spot ETF inflows per month, potentially boosting the realized cap by $114B yearly,” explains Ju. “Even with $GBTC outflows, a $76B rise could elevate the realized cap from $451B to $527-565B.”

The Market Value to Realized Value (MVRV) ratio may provide some hints regarding how the Realized Cap could be relevant for the spot price. This indicator tracks the BTC Market Cap and the Realized Cap ratio.

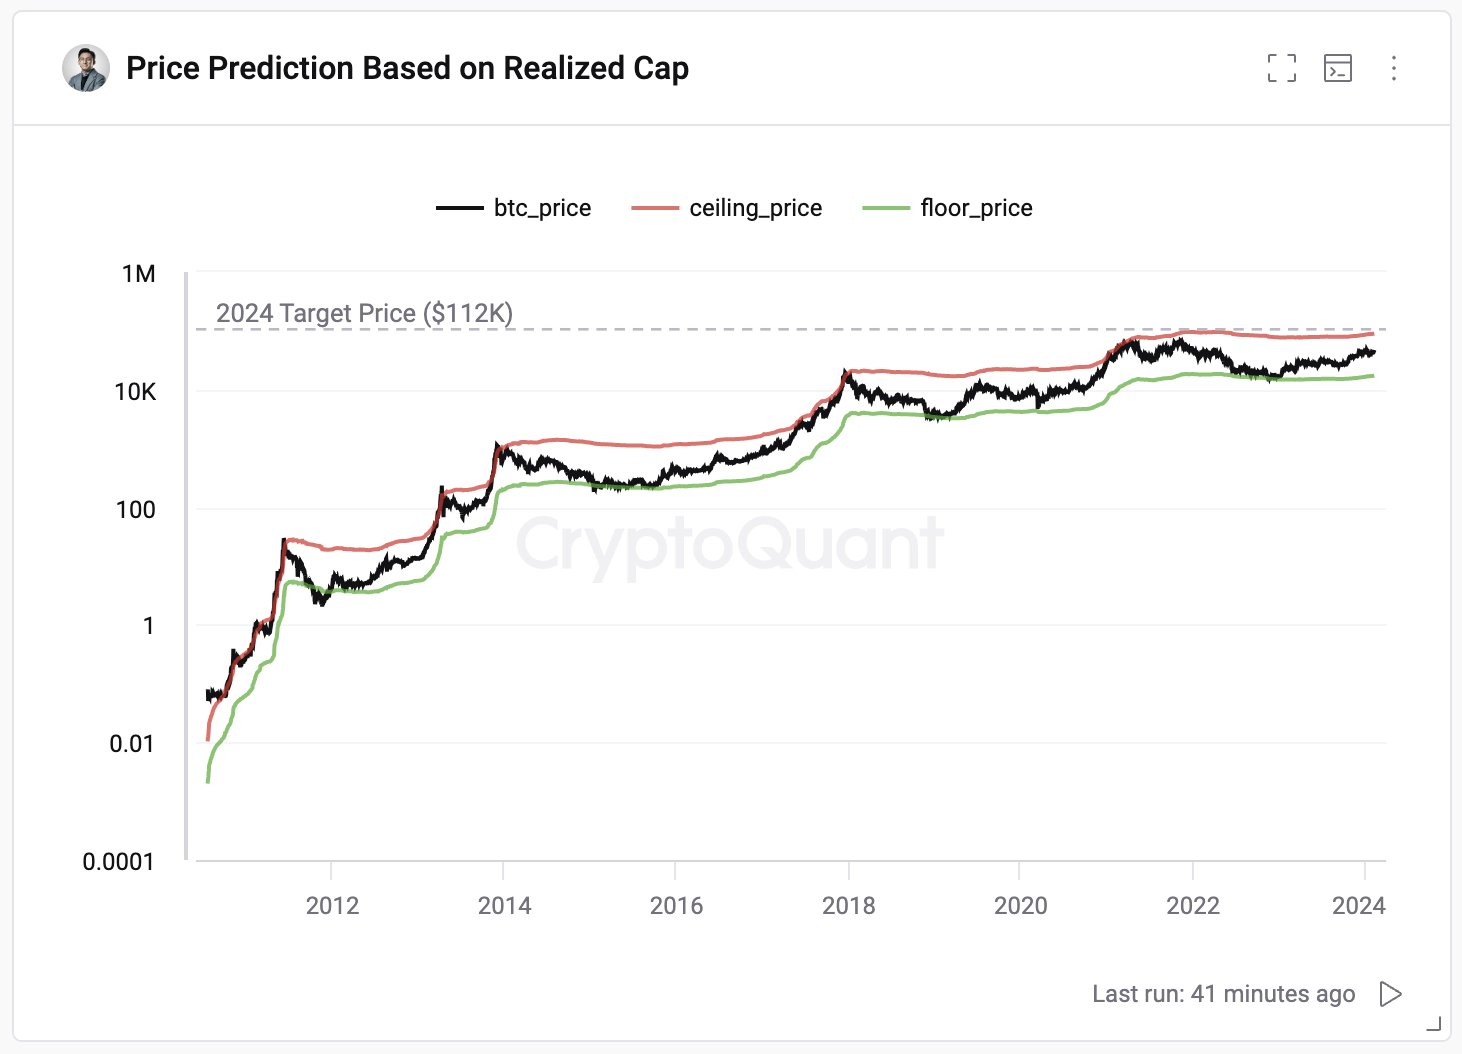
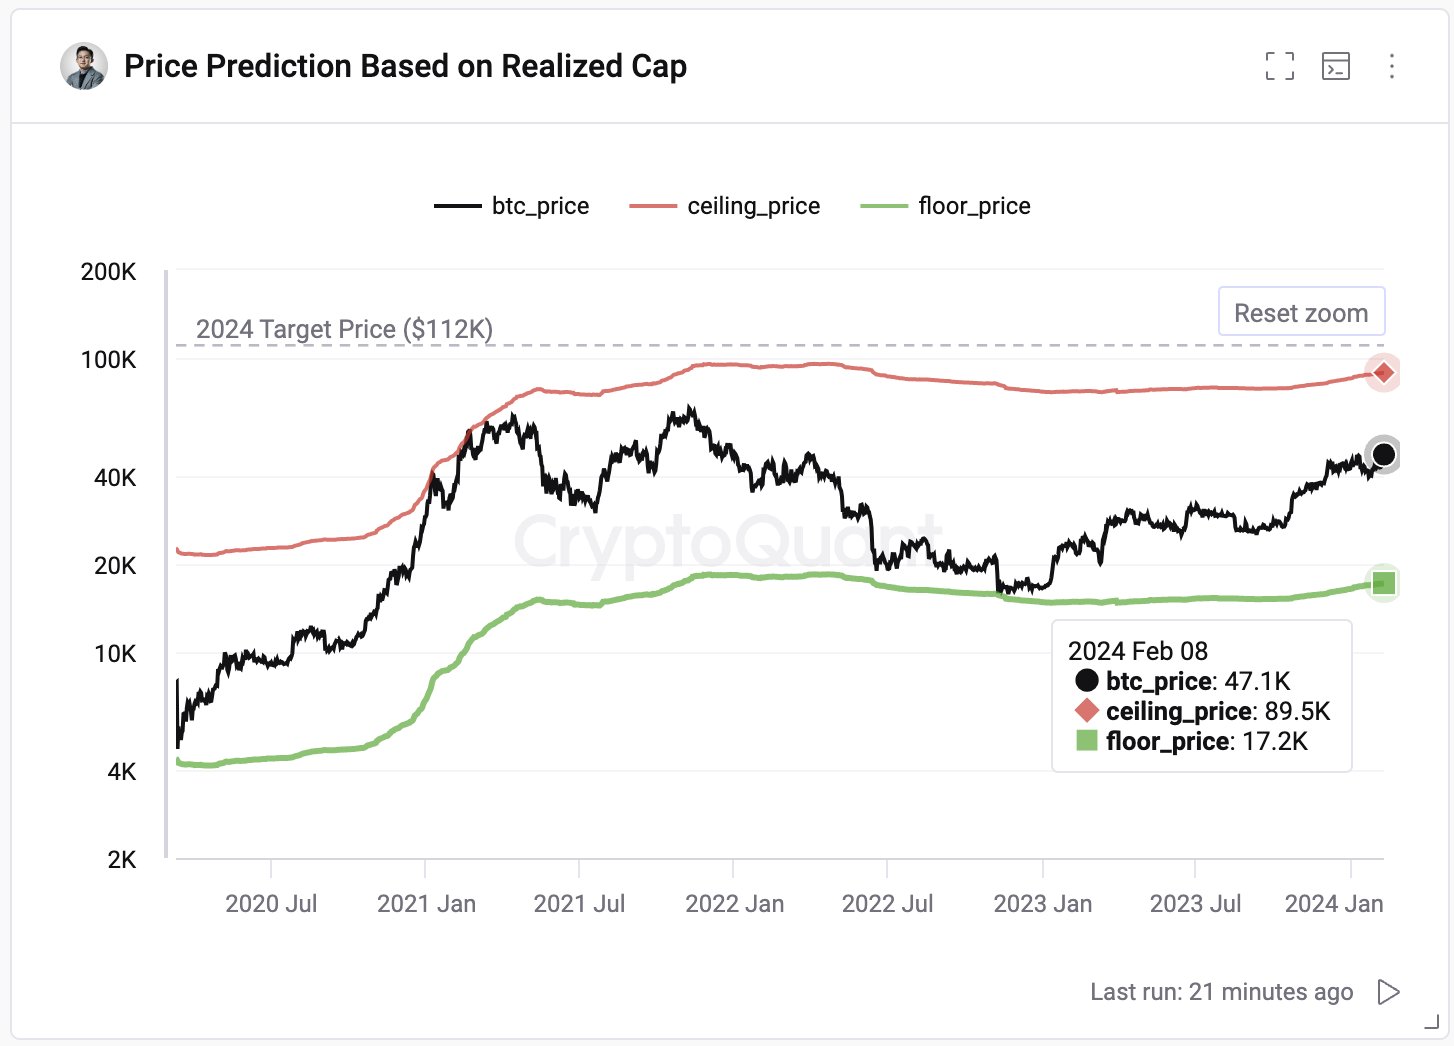
“Historically, BTC market bottoms occur at an MVRV of 0.75 and tops at 3.9,” notes the CryptoQuant founder. Based on this fact, the table below shows that ceiling and floor prices can be defined for the asset.

Bitcoin Target

As the spot ETF inflows continue to come in, the Realized Cap will only push further up, and the potential ceiling of the cryptocurrency will also thus increase.

Bitcoin Realized Cap

“With current spot ETF inflow trends, the top price could reach $104k-$112k,” says the CryptoQuant CEO. “Without hype, maintaining the current level of 2.07, the price would be $55-59k.”

In the best-case scenario, if Bitcoin had reached the $112,000 target, the cryptocurrency would have jumped more than 126% from the current spot price.

BTC Price

At the time of writing, Bitcoin is trading at around $49,400, up over 15% in the past week.

Bitcoin Price Chart

How Low Can Bitcoin Go? CryptoQuant Head Reveals Target

In the midst of Bitcoin’s recent price struggle, CryptoQuant head of research has revealed the level Bitcoin can potentially sink down to.

Bitcoin Might Go Down To As Low As Realized Price Of 1 To 3 Months Old Hands

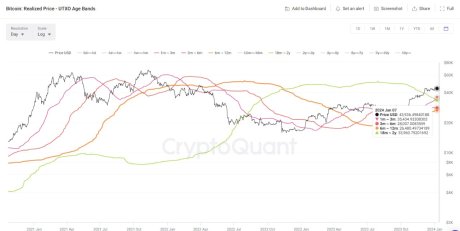
In a new post on X, CryptoQuant Head of Research Julio Moreno has discussed how low the BTC price can go following the latest correction. “To evaluate this I like to look at the realized price of 1 to 3 month-old holders,” explains Moreno.

The “realized price” refers to an indicator that basically tells us about the average price at which investors in the Bitcoin market acquired their coins. This metric uses on-chain data to find the cost basis of holders, by assuming that the last transfer of any coin in circulation was when the coin changed hands.

When the spot price of the cryptocurrency is above the realized price, it means that the investors as a whole are carrying some unrealized gains currently. On the other hand, the price being lower than the metric suggests the overall market is underwater.

Naturally, when the realized price and spot price are exactly equal, the average investor in the sector could be assumed to be just breaking even on their investment.

In the context of the current topic, Moreno hasn’t applied the realized price to the entire user base but rather to just a segment of the investors: the 1-to 3-month-old holders.

The below chart shows the trend in the Bitcoin realized price for this particular holder group over the last year:

Bitcoin Short-Term Holder Realized Price

The 1 to 3 months old investors make up a part of the wider “short-term holder” (STH) cohort. The STHs are defined as investors who bought their coins within the last 155 days.

Thus, the holders who bought between 1 and 3 months ago would be on the younger side of this group. Generally, the STHs behave in a fickle manner, reacting to any significant changes in the market, like a rally or crash.

The more mature a holder’s coins become, the less likely the investor turns to show any such reaction. Since the 1 to 3-month-old hands, although not the youngest, are still young STHs, they are likely to react to price changes.

According to Moreno, the realized price of these STHs has “represented a support level historically and during 2023.” The reason behind the level being supported is likely the fact that these investors would closely watch their average cost basis and move to buy more when the price dips around there if the general mood around the market is bullish.

In times when the prevailing Bitcoin trend is bearish, the level can act as resistance instead, as these STHs would be willing to exit the market at their break-even point.

At present, the realized price of the 1 to 3-month-old STHs is $36,700. Given the historical pattern, it’s possible Bitcoin might dip to around there before finding support, if the current correction continues for long.

BTC Price

Since the asset’s price plunged under the $45,000 level a few days back, the Bitcoin price has been trading sideways around the $42,500 level.

Bitcoin Price Chart

Bitcoin Spot ETF: Analyst Predicts 2 Scenarios For Price Beforehand

Amid the anticipation circling the Bitcoin Spot Exchange-Traded Fund (ETF) approval, crypto analyst CryptoQuant has made a bold prediction for the digital asset beforehand.

2 Major Scenarios For Bitcoin Price

CryptoQuant, a well-known cryptocurrency expert, has revealed two major scenarios for Bitcoin in advance to BTC Spot Exchange-Traded Fund (ETF). According to the analyst, BTC will undergo a bullish and bearish scenario before approval from the United States Securities and Exchange Commission (SEC).

The analyst’s prediction delves into Bitcoin price support and resistance analysis. CryptoQuant’s forecast was based on on-chain data of the average unit price of BTC holders.

The post read:

2 Scenarios Before Bitcoin Spot ETF Approval and How to Respond. This post explains how to analyze the Bitcoin price support and resistance using on-chain data of the average unit price of #Bitcoin holders.

For the bullish scenario, CryptoQuant noted that the percentage of daily to weekly holders is expected to increase by 8% if BTC reaches $48,500. This suggests “an overheated market and reinforces a correction.”

The analyst asserted that the $48,500 price mark is the “average unit price” for holders between 2-3 years. In addition, a primary resistance can also be formed at this level.

Bitcoin

Meanwhile, for the bearish scenario, CryptoQuant noted a drop in Bitcoin price around 2-30% in the past during its upswing. The crypto expert also added that BTC could form a support level between $30,000 to $34,000 if the price plummets.

Furthermore, CryptoQuant highlighted an average unit price of $34,000 for both the 18-month to two-year and one-week to one-month holding periods. Meanwhile, the average unit price for the holding period of three to twelve months is $30,000.

So far, the expert has highlighted rising dangers and uncertainty as the approval outcome of the Bitcoin Spot ETF approaches. CryptoQuant has issued a warning to the crypto community not to take on the risk as this is “unnecessary.”

BTC Price Dip After Approval Outcome

Institutional trading analyst MacroScope has forecasted a price dip for Bitcoin following the ETF approval outcome. “We know there will be a dip at some point after approval,” MacroScope stated.

The analyst further added that the dip could take place a day or week after the outcome. However, he asserted that the exact timeframe is “hard to predict, but it should surprise no one.”

MacroScope also highlighted a few factors to watch out for during the dip. The expert noted that “once the dip stabilizes, the next upward move could be a ripper.”

In addition, billions of funds will be waiting for the turn, trying to time it just right. However, MacroScope has suggested allocating a starting position in order not to miss this turn.

As of the time of writing, Bitcoin was trading at $46,860, indicating an increase of over 6% in the past day. Its trading volume is significantly up by over 70% in the past 24 hours, according to CoinMarketCap

Bitcoin

Bitcoin Bull Signal Returns: Exchange Supply Hits Lowest Level Since 2017

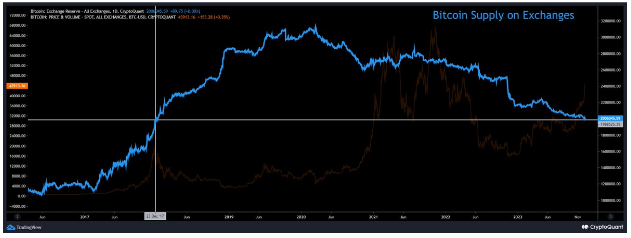
On-chain data has revealed an increasing sentiment of holding Bitcoin among investors. Bitcoin has been on a roll since the start of the month, pushing its price to new yearly highs. At the same time, exchange data from CryptoQuant reveals that the crypto might be gearing up for a sustained bull run. According to the on-chain analytics platform, Bitcoin’s exchange supply, the amount available for purchase on exchanges, has dropped to its lowest levels since 2017 

Exchange Supply Drops To Lowest Level In Six Years

The Bitcoin market is flashing a bull signal that correlates with anticipation of spot Bitcoin ETF applications. CryptoQuant’s exchange reserve chart demonstrates that the supply of Bitcoin has been steadily decreasing from centralized exchanges since 2020 when it reached a high of over 3.2 million BTC. The outflow was particularly aggravated in the last quarter of 2022, when the collapse of crypto exchange FTX led to panic and investors started to opt for self-custody in cold wallets. During this period, exchange reserves dropped from 2.512 million BTC to 2.158 million BTC in a month.

https://x.com/cryptoquant_com/status/1733005131216744749?s=20 

Reserve on exchanges started to increase slowly in the early months of 2023, climbing back up to 2.240 million in May. However, things started to change in June, as filings by BlackRock and other investment companies for spot Bitcoin ETF trading in the US led to the start of a bullish sentiment. 

The reserve on centralized exchanges has been on a steady drop since then. At the time of writing, the exchange reserve has now crossed below 2 million BTC, a level it has yet to reach since December 2017. This metric’s six-year low is particularly interesting, considering Bitcoin’s total circulating supply has increased since 2017. Bitcoin’s total supply now stands at 19,564,812 BTC, a 16% increase from December 2017’s supply of 16.78 million BTC.

Outlook For Bitcoin Price: Bull Signal?

Although there are technically more bitcoins now available to go around, the increase in adoption is making it increasingly harder for traders to get a hold of the asset. Dropping exchange supply is a bullish signal for crypto assets and periods of low exchange supply have historically been associated with the beginning of significant Bitcoin bull runs. The last time Bitcoin had a drastic drop in exchange reserve was in 2020, and the crypto would later go on to reach its all-time high the year after.

Bitcoin is currently spearheading new inflows into the crypto industry, with Coinmarketcap’s Fear and Greed Index now pointing to an extreme greed of 82. The industry’s leading asset recently broke over $44,000 for the second time this week and is now up by 14% in a 7-day timeframe. Bitcoin is poised for extreme gains in 2024, and many analysts have predicted a price target above $100,000.

(This site’s content should not be construed as investment advice. Investing involves risk. When you invest, your capital is subject to risk).

Featured image from Freepik