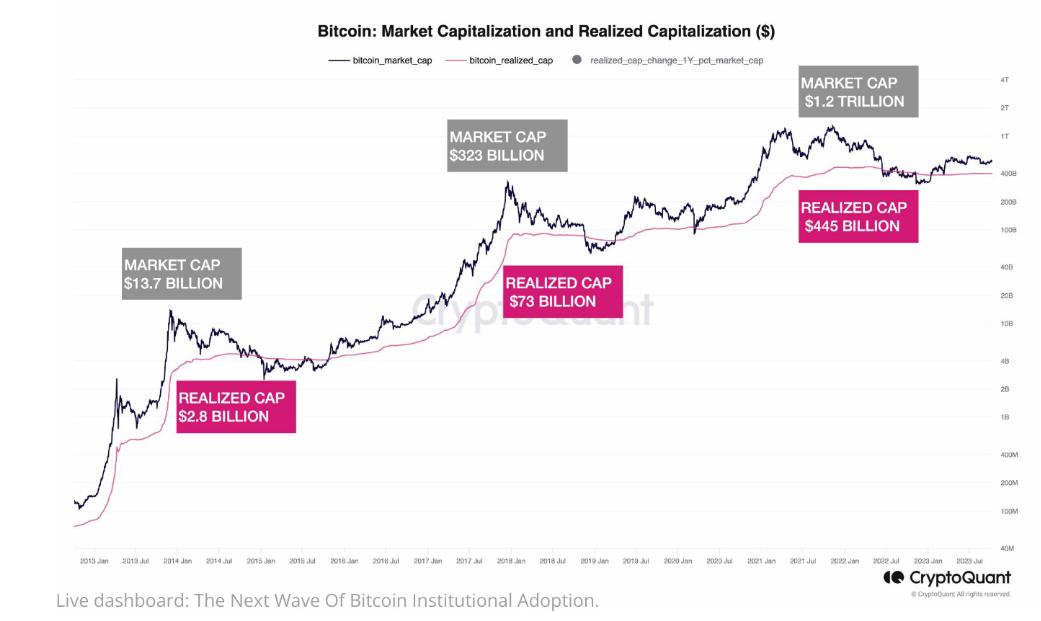
On-chain data has revealed an increasing sentiment of holding Bitcoin among investors. Bitcoin has been on a roll since the start of the month, pushing its price to new yearly highs. At the same time, exchange data from CryptoQuant reveals that the crypto might be gearing up for a sustained bull run. According to the on-chain analytics platform, Bitcoin’s exchange supply, the amount available for purchase on exchanges, has dropped to its lowest levels since 2017
Exchange Supply Drops To Lowest Level In Six Years
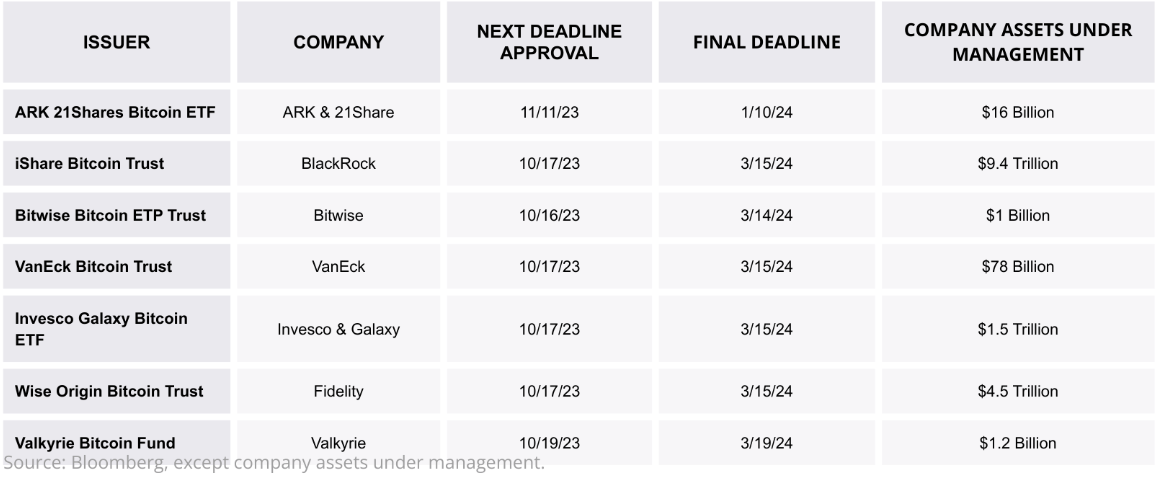
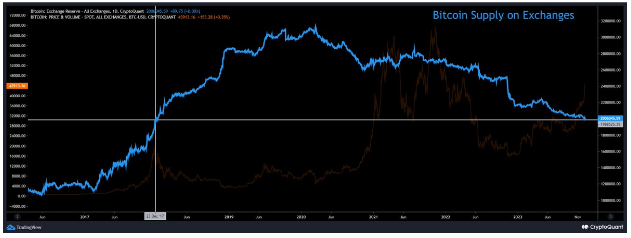
The Bitcoin market is flashing a bull signal that correlates with anticipation of spot Bitcoin ETF applications. CryptoQuant’s exchange reserve chart demonstrates that the supply of Bitcoin has been steadily decreasing from centralized exchanges since 2020 when it reached a high of over 3.2 million BTC. The outflow was particularly aggravated in the last quarter of 2022, when the collapse of crypto exchange FTX led to panic and investors started to opt for self-custody in cold wallets. During this period, exchange reserves dropped from 2.512 million BTC to 2.158 million BTC in a month.
https://x.com/cryptoquant_com/status/1733005131216744749?s=20
Lowest Supply of #Bitcoin in Six Years
“We are in the 45th month of diminishing supply. For the first time, supply returned to 2017 levels. ”
by @1MrPapi— CryptoQuant.com (@cryptoquant_com) December 8, 2023

Reserve on exchanges started to increase slowly in the early months of 2023, climbing back up to 2.240 million in May. However, things started to change in June, as filings by BlackRock and other investment companies for spot Bitcoin ETF trading in the US led to the start of a bullish sentiment.
The reserve on centralized exchanges has been on a steady drop since then. At the time of writing, the exchange reserve has now crossed below 2 million BTC, a level it has yet to reach since December 2017. This metric’s six-year low is particularly interesting, considering Bitcoin’s total circulating supply has increased since 2017. Bitcoin’s total supply now stands at 19,564,812 BTC, a 16% increase from December 2017’s supply of 16.78 million BTC.
Outlook For Bitcoin Price: Bull Signal?
Although there are technically more bitcoins now available to go around, the increase in adoption is making it increasingly harder for traders to get a hold of the asset. Dropping exchange supply is a bullish signal for crypto assets and periods of low exchange supply have historically been associated with the beginning of significant Bitcoin bull runs. The last time Bitcoin had a drastic drop in exchange reserve was in 2020, and the crypto would later go on to reach its all-time high the year after.
Bitcoin is currently spearheading new inflows into the crypto industry, with Coinmarketcap’s Fear and Greed Index now pointing to an extreme greed of 82. The industry’s leading asset recently broke over $44,000 for the second time this week and is now up by 14% in a 7-day timeframe. Bitcoin is poised for extreme gains in 2024, and many analysts have predicted a price target above $100,000.
(This site’s content should not be construed as investment advice. Investing involves risk. When you invest, your capital is subject to risk).
Featured image from Freepik