A death cross indicates a potential long-term bearish shift in momentum while a golden cross suggests the opposite.
Ethereum price prints ‘death cross’ after losing 13% versus Bitcoin from 2023 peak
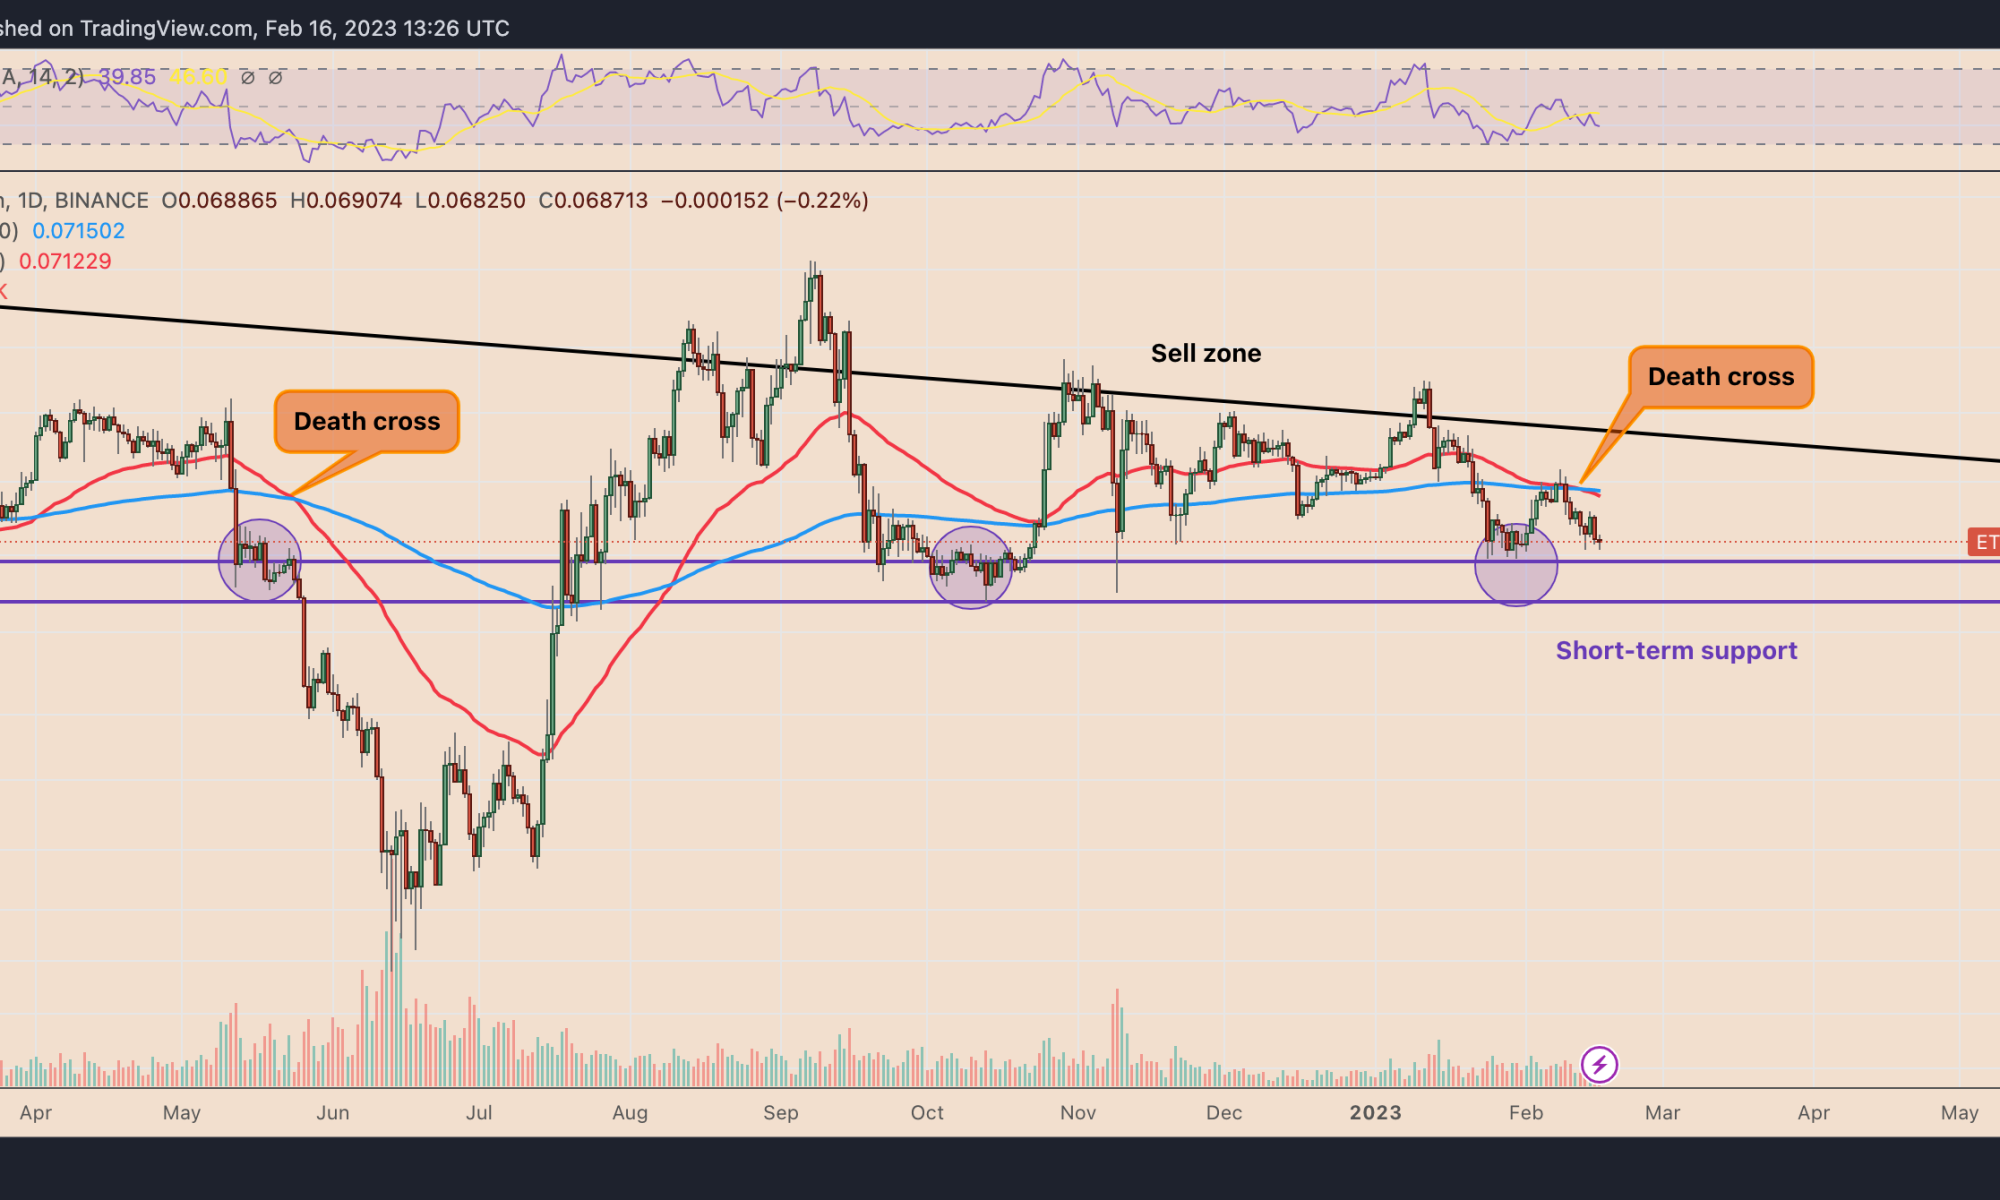

ETH price is in danger of losing another 20% versus Bitcoin by March, based on a mix of technical and fundamental indicators.
WAVES risks ‘death cross’ plunge after price rallies 88% in six days

WAVES price has rallied to a historically significant level of resistance, raising death cross fears.
Solana’s weekend bounce risks turning into a bull trap — Can SOL price fall to $60 next?

More bearish cues for SOL comes from a bull flag setup that’s now breaking to the downside.
Bottom ahead? Solana paints its first ‘death cross’ as SOL losses 50% in January

Recently, death crosses between the 50-day and 200-day exponential moving averages have acted as a reliable predictors of bottoms.
Bitcoin Death Cross 2022: What You Need To Know About The Deadly Signal
All across crypto, fear is in the air. Not only is the market shaken from the recent downtrend, but there’s an extra layer of doom and gloom due to an impending “death cross” in Bitcoin.
Learn all about the ominous sounding crossover of two commonly watched moving averages, what the signal could mean, and how Bitcoin price has reacted in the past.
The “death cross” is nigh | Source: BTCUSD on TradingView.com
Does The Bitcoin Death Cross Mean Doom And Gloom For Crypto?
Bitcoin price on daily BTCUSD charts is only days away from completing a “death cross.” According to Investopedia, “a death cross is a technical chart pattern indicating the potential for a major sell-off.” It occurs when a short-term moving average (in this case the 50-day MA) crosses below a long-term moving average (the 200-day MA).
The signal tells investors that the asset’s growth has slowed and is showing potential of a bear trend. Long-term price depreciation is possible. However, in Bitcoin, things don’t always behave the way they should.
Related Reading | 2022: The Year The Secular Bitcoin Bull Run Could End
Across eight total death crosses in the first ever cryptocurrency, the average drop within a month from the cross is a mere 25% (h/t Dan via TonyTradesBTC) – puny by crypto standards.
The opposite signal, golden crosses, also don’t always have a positive impact, either. In fact, Bitcoin price is lower now today than it was when the last golden cross triggered.
The history of death and golden crosses in emoji | Source: BTCUSD on TradingView.com
Data Shows Whether Or Not You Should Fear The Reaper
Such crossovers, are often used to confuse the market during consolidation phases. Ahead of the 2020 bull breakout, there were two death crosses and two golden crosses. One notable death cross in October 2019 resulted in a 42% pump the day prior signal.
Despite the strength, price action was rejected back down to new lows, only to golden cross, death cross, then golden cross again. Ahead of the fabled 2016-2017 bull run, there was also a similar fakeout – depicted in the green box.
Related Reading | The Hidden Bitcoin Trend Line That Could Save The Bull Run
Prior to the 2014-2015 bear market, however, there was a death cross, golden cross, back into a death cross fakeout that closely mimics the situation brewing in Bitcoin right now in the red box.
Another such example could result in a renewed bear phase. But the data otherwise shows that the “death cross” is not a reaper you need to fear.
How will #Bitcoin . React to the “death cross”

— NEWSBTC (@newsbtc) January 12, 2022
Follow @TonySpilotroBTC on Twitter or join the TonyTradesBTC Telegram for exclusive daily market insights and technical analysis education. Please note: Content is educational and should not be considered investment advice.
Featured image from iStockPhoto, Charts from TradingView.com
Will this time be different? Bitcoin eyes drop to $35K as BTC price paints ‘death cross’

While recent bearish crossovers between Bitcoin’s 50-day and 200-day exponential moving averages failed to push prices lower, this time could be different.
Bitcoin ‘death cross’ that pushed BTC price to $28.8K reappears

The bearish crossover between Bitcoin’s 20-day and 200-day exponential moving averages hints at a drop toward the $40,000-$42,000 area.
Cardano price paints ‘death cross’ with ADA at two-month lows vs. Bitcoin

ADA price has been struggling against the U.S. dollar in October.
How to Spot Bitcoin’s Golden or Death Cross Using Simple Moving Averages

The golden cross and death cross have long helped traders predict and confirm long-term price trends. Here’s a primer for crypto investors.


