Is Dogecoin About to Take Off? Indicators Suggest Upward Momentum Ahead

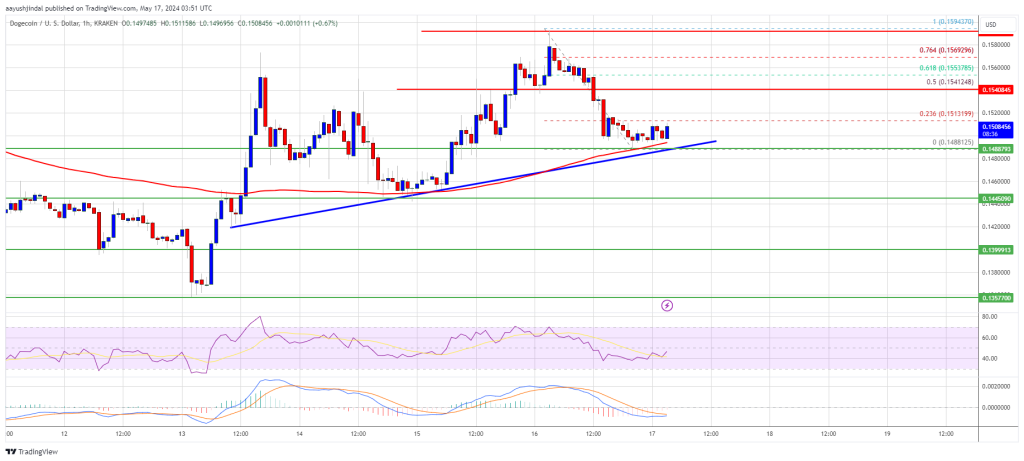
Dogecoin corrected gains and tested the $0.150 zone against the US Dollar. DOGE is now forming a base and might start a fresh increase above $0.1520.

  • DOGE price jumped toward $0.160 before correcting gains.
  • The price is trading above the $0.150 level and the 100-hourly simple moving average.
  • There is a key bullish trend line forming with support at $0.1485 on the hourly chart of the DOGE/USD pair (data source from Kraken).
  • The price must settle above $0.1540 to move into a positive zone and start a fresh surge.

Dogecoin Price Holds Support

After a steady increase, Dogecoin price faced resistance near the $0.160 zone. A high was formed at $0.1594 before DOGE started a downside correction like Bitcoin and Ethereum. There was a drop below the $0.1540 support zone.

A low was formed at $0.1488 and DOGE is now consolidating for the next move. Dogecoin is still trading above the $0.150 level and the 100-hourly simple moving average. There is also a key bullish trend line forming with support at $0.1485 on the hourly chart of the DOGE/USD pair.

On the upside, the price is facing resistance near the $0.1515 level. It is near the 23.6% Fib retracement level of the downward move from the $0.1594 swing high to the $0.1488 low.

Dogecoin Price

The next major resistance is near the $0.1540 level or the 50% Fib retracement level of the downward move from the $0.1594 swing high to the $0.1488 low. A close above the $0.1540 resistance might send the price toward the $0.160 resistance. Any more gains might send the price toward the $0.1650 level. The next major stop for the bulls might be $0.1720.

More Losses In DOGE?

If DOGE’s price fails to gain pace above the $0.1540 level, it could start another decline. Initial support on the downside is near the $0.150 level and the trend line.

The next major support is near the $0.1445 level. If there is a downside break below the $0.1445 support, the price could decline further. In the stated case, the price might decline toward the $0.1350 level.

Technical Indicators

Hourly MACD – The MACD for DOGE/USD is now losing momentum in the bearish zone.

Hourly RSI (Relative Strength Index) – The RSI for DOGE/USD is now above the 50 level.

Major Support Levels – $0.1500, $0.1445 and $0.1350.

Major Resistance Levels – $0.1515, $0.1540, and $0.1600.
DOGE Price Prediction – Can Dogecoin Bulls Overcome This Hurdle?

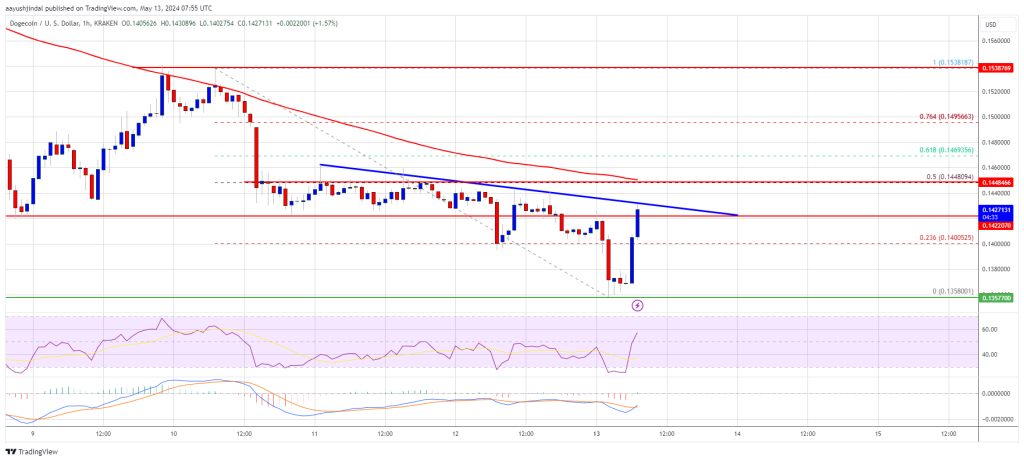
Dogecoin extended losses and traded below the $0.1420 support zone against the US Dollar. DOGE is now recovering but facing key hurdles at $0.1450.

  • DOGE price tested the $0.1360 support and started a recovery wave.
  • The price is trading below the $0.1450 level and the 100 simple moving average (4 hours).
  • There is a key bearish trend line forming with resistance at $0.1430 on the 4-hour chart of the DOGE/USD pair (data source from Kraken).
  • The price must settle above $0.1450 to move into a positive zone and start a fresh surge.

Dogecoin Price Extends Losses

After a close below $0.150, Dogecoin price extended losses and moved into a short-term bearish zone, like Bitcoin and Ethereum. There was a drop below the $0.1450 support zone.

A low was formed at $0.1358 and DOGE is attempting a recovery wave. There was a minor increase above the $0.1420 resistance level. The price climbed above the 23.6% Fib retracement level of the downward move from the $0.1538 swing high to the $0.1358 low.

Dogecoin is still below the $0.1450 level and the 100 simple moving average (4 hours). On the upside, the price is facing resistance near the $0.1430 level. There is also a key bearish trend line forming with resistance at $0.1430 on the 4-hour chart of the DOGE/USD pair.

The next major resistance is near the $0.1450 level and the 100 simple moving average (4 hours). It coincides with the 50% Fib retracement level of the downward move from the $0.1538 swing high to the $0.1358 low.

DOGE Price Prediction

Source: DOGEUSD on TradingView.com

A close above the $0.1450 resistance might send the price toward the $0.1535 resistance. Any more gains might send the price toward the $0.1620 level.

Another Decline In DOGE?

If DOGE’s price fails to gain pace above the $0.1450 level, it could start another decline. Initial support on the downside is near the $0.140 level.

The next major support is near the $0.1360 level. If there is a downside break below the $0.1360 support, the price could decline further. In the stated case, the price might decline toward the $0.1200 level.

Technical Indicators

4 Hours MACD – The MACD for DOGE/USD is now losing momentum in the bearish zone.

4 Hours RSI (Relative Strength Index) – The RSI for DOGE/USD is now above the 50 level.

Major Support Levels – $0.1400, $0.1360 and $0.1200.

Major Resistance Levels – $0.1430, $0.1450, and $0.1535.

DOGE Price Prediction – Dogecoin Reaches Make-or-Breaks Levels

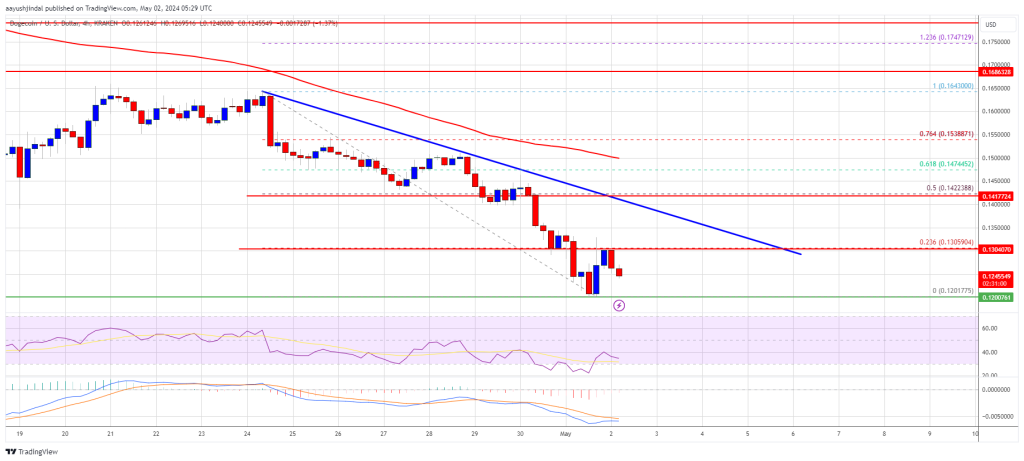
Dogecoin extended losses and traded below the $0.1350 resistance zone against the US Dollar. DOGE is now testing an important support at $0.1200.

  • DOGE gained bearish momentum below the $0.140 and $0.1350 levels against the US dollar.
  • The price is trading below the $0.1350 level and the 100 simple moving average (4 hours).
  • There is a major bearish trend line forming with resistance at $0.1350 on the 4-hour chart of the DOGE/USD pair (data source from Kraken).
  • The price must settle above $0.1420 to move into a positive zone and start a fresh surge.

Dogecoin Price Extends Losses

After a close below $0.150, Dogecoin price extended losses and moved into a short-term bearish zone, like Bitcoin and Ethereum. There was a drop below the $0.1350 support zone.

A low was formed at $0.1201 and DOGE is now consolidating losses. There was a minor recovery wave above the $0.1250 level. The price tested the 23.6% Fib retracement level of the downward move from the $0.1640 swing high to the $0.1201 low.

However, the bears protected more gains above the $0.130 resistance. Dogecoin is also below the $0.1420 level and the 100 simple moving average (4 hours). On the upside, the price is facing resistance near the $0.130 level.

DOGE Price Prediction

Source: DOGEUSD on TradingView.com

The next major resistance is near the $0.1350 level. There is also a major bearish trend line forming with resistance at $0.1350 on the 4-hour chart of the DOGE/USD pair. The main hurdle is at $0.1420. A close above the $0.1420 resistance and the 50% Fib retracement level of the downward move from the $0.1640 swing high to the $0.1201 low might send the price toward the $0.1550 resistance. Any more gains might send the price toward the $0.1620 level.

More Losses in DOGE?

If DOGE’s price fails to gain pace above the $0.1350 level, it could start another decline. Initial support on the downside is near the $0.1220 level.

The next major support is near the $0.120 level. If there is a downside break below the $0.120 support, the price could decline further. In the stated case, the price might decline toward the $0.1040 level.

Technical Indicators

4 Hours MACD – The MACD for DOGE/USD is now gaining momentum in the bearish zone.

4 Hours RSI (Relative Strength Index) – The RSI for DOGE/USD is now below the 50 level.

Major Support Levels – $0.1240, $0.1200 and $0.1040.

Major Resistance Levels – $0.1300, $0.1350, and $0.1420.

DOGE Price Prediction – Dogecoin Below $0.14 Could Spark Larger Degree Drop

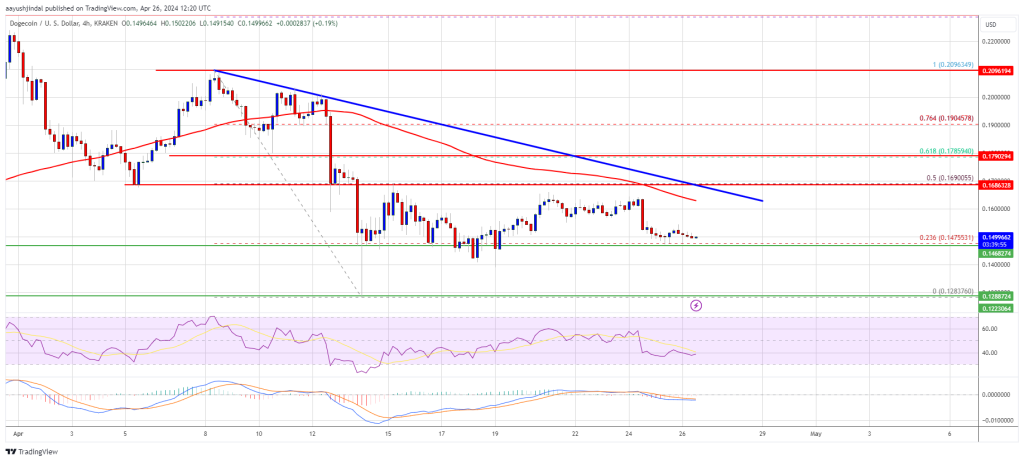
Dogecoin is struggling to rise above the $0.1650 resistance zone against the US Dollar. DOGE could decline heavily if it settles below the $0.140 support.

  • DOGE is facing many hurdles near the $0.1650 and $0.170 levels against the US dollar.
  • The price is trading below the $0.1620 level and the 100 simple moving average (4 hours).
  • There is a major bearish trend line forming with resistance at $0.1620 on the 4-hour chart of the DOGE/USD pair (data source from Kraken).
  • The price must settle above $0.170 to move into a positive zone and start a fresh surge.

Dogecoin Price Signals Downturn

After a major decline, Dogecoin price started a recovery wave from the $0.1280 zone. A low was formed at $0.1283 and DOGE climbed above $0.1350, like Bitcoin and Ethereum.

There was a move above the $0.1385 and $0.140 resistance levels. The price climbed above the 23.6% Fib retracement level of the downward move from the $0.2092 swing high to the $0.1283 low. However, the bears protected more gains above the $0.170 resistance.

The price failed to test the 50% Fib retracement level of the downward move from the $0.2092 swing high to the $0.1283 low. There is also a major bearish trend line forming with resistance at $0.1620 on the 4-hour chart of the DOGE/USD pair.

Dogecoin is also below the $0.160 level and the 100 simple moving average (4 hours). On the upside, the price is facing resistance near the $0.160 level.

DOGE Price Prediction

Source: DOGEUSD on TradingView.com

The next major resistance is near the $0.1680 level. The main hurdle is at $0.170. A close above the $0.170 resistance might send the price toward the $0.1850 resistance. Any more gains might send the price toward the $0.20 level.

More Losses in DOGE?

If DOGE’s price fails to gain pace above the $0.160 level, it could start another decline. Initial support on the downside is near the $0.1475 level.

The next major support is near the $0.1400 level. If there is a downside break below the $0.1400 support, the price could decline further. In the stated case, the price might decline toward the $0.120 level.

Technical Indicators

4 Hours MACD – The MACD for DOGE/USD is now gaining momentum in the bearish zone.

4 Hours RSI (Relative Strength Index) – The RSI for DOGE/USD is now below the 50 level.

Major Support Levels – $0.1475, $0.1400 and $0.1200.

Major Resistance Levels – $0.1600, $0.1680, and $0.1700.

Expert Forecasts 700% Growth For Dogecoin (DOGE) As It Sets Sights On $1 Target

Dogecoin (DOGE), the popular meme-based cryptocurrency, has demonstrated its resilience in the market with a 2.5% price increase over the past 24 hours, reaching a trading price of $0.1607. 

Analysts, including Altcoin Sherpa and Ali Martinez, have recently shared optimistic predictions for DOGE’s future, suggesting further gains and potential for outperformance compared to other tokens.

A Strong Future For Dogecoin In 2024? 

Over the past months, DOGE has closely followed Bitcoin’s price action, experiencing ups and downs in tandem with the market leader. 

On March 28, DOGE reached its yearly high of $0.2292, solidifying its position as the 9th largest cryptocurrency with nearly 100% year-to-date growth. Despite the volatility, DOGE has demonstrated its ability to rebound and attract investor attention.

Market expert Altcoin Sherpa recently expressed optimism about DOGE’s future, stating that the coin is poised for strength in 2024. 

Altcoin Sherpa recommended averaging between $0.12 and $0.14, emphasizing DOGE’s potential to outperform other tokens.

The analyst highlighted DOGE’s previous consolidation phase, lasting almost two years, and suggested that it is primed for a significant price surge in the future. Sherpa stated:

DOGE is looking good. I strongly feel like this is going to be a strong coin for 2024. I think averaging between $.12 and $.14 would be a solid play and this one should outperform many other tokens for a lot of reasons. It chopped for almost 2 years, it’s going to moon later. 

700% Price Uptrend Toward $1

On the other hand, crypto analyst Ali Martinez has also shared a bullish prediction for DOGE, noting the coin’s recurring price patterns. 

Martinez pointed out that DOGE consolidates after breaking out of a descending triangle formation. Based on historical trends, the analyst believes that DOGE has the potential to rally towards $1 in the coming weeks, which would represent a staggering 700% uptrend in price from current levels, surpassing the cryptocurrency’s current all-time high of $0.7316, reached in May 2021. 

Dogecoin

Despite Martinez’s optimistic outlook, Dogecoin faces several resistance levels that have impeded its recovery after a 21% price decline in the past two weeks.

The meme coin encounters a significant obstacle at the $0.1633 price level, as depicted in the DOGE/USD daily chart above. This level has acted as a barrier for the past 10 days, hindering further upward movement.

In its journey towards the $0.200 mark, DOGE may encounter additional hurdles at $0.1739, $0.1938, and $0.1998. These resistance levels must be overcome before the cryptocurrency can potentially retest its all-time high.

It is important to note that Bitcoin’s performance will likely influence Dogecoin’s price movement in the coming weeks. In addition, Dogecoin’s overall trajectory through the end of 2024 remains uncertain as it depends on the potential for a bullish breakout and various market factors.

Featured image from Shutterstock, chart from TradingView.com 

DOGE Price Prediction – Dogecoin Recovery Could Stall At $0.170

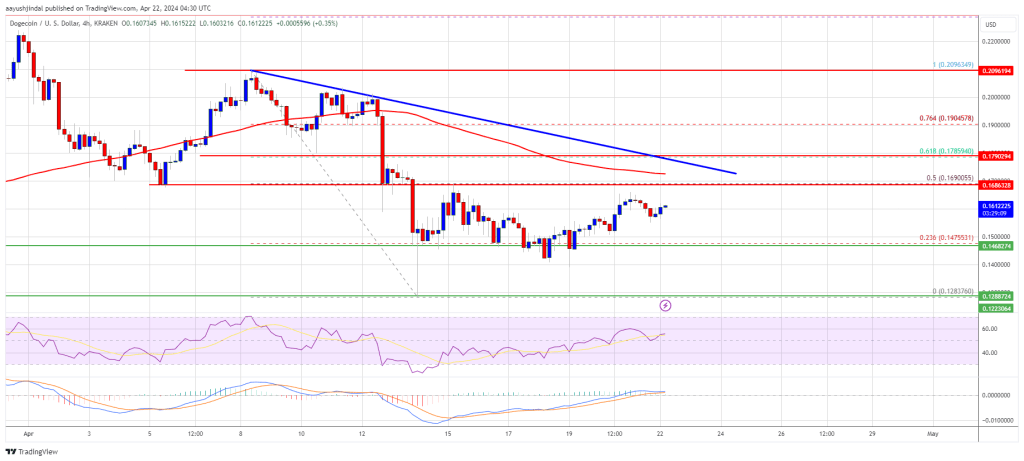
Dogecoin is attempting a recovery wave above the $0.150 resistance zone against the US Dollar. DOGE could struggle to clear the $0.170 resistance zone.

  • DOGE started a recovery wave from the $0.1280 support zone against the US dollar.
  • The price is trading above the $0.1500 level and the 100 simple moving average (4 hours).
  • There is a key bearish trend line forming with resistance at $0.170 on the 4-hour chart of the DOGE/USD pair (data source from Kraken).
  • The price must settle above $0.170 to move into a positive zone and start a fresh surge.

Dogecoin Price Faces Hurdles

After a major decline, Dogecoin price found support at $0.1280. A low was formed at $0.1283 and DOGE started a decent recovery wave, like Bitcoin and Ethereum. There was a move above the $0.1350 and $0.140 resistance levels.

The price climbed above the 23.6% Fib retracement level of the downward wave from the $0.2093 swing high to the $0.1283 low. However, the bears are still active and protecting more gains. There is also a key bearish trend line forming with resistance at $0.170 on the 4-hour chart of the DOGE/USD pair.

Dogecoin is also below the $0.1650 level and the 100 simple moving average (4 hours). On the upside, the price is facing resistance near the $0.1690 level or the 50% Fib retracement level of the downward wave from the $0.2093 swing high to the $0.1283 low.

DOGE Price Prediction

Source: DOGEUSD on TradingView.com

The next major resistance is near the $0.170 level. A close above the $0.170 resistance might send the price toward the $0.1880 resistance. The next major resistance is near $0.200. Any more gains might send the price toward the $0.220 level.

Another Decline in DOGE?

If DOGE’s price fails to gain pace above the $0.170 level, it could start another decline. Initial support on the downside is near the $0.1525 level.

The next major support is near the $0.1475 level. If there is a downside break below the $0.1750 support, the price could decline further. In the stated case, the price might decline toward the $0.1280 level.

Technical Indicators

4 Hours MACD – The MACD for DOGE/USD is now gaining momentum in the bullish zone.

4 Hours RSI (Relative Strength Index) – The RSI for DOGE/USD is now above the 50 level.

Major Support Levels – $0.1525, $0.1475 and $0.1280.

Major Resistance Levels – $0.1690, $0.1700, and $0.200.

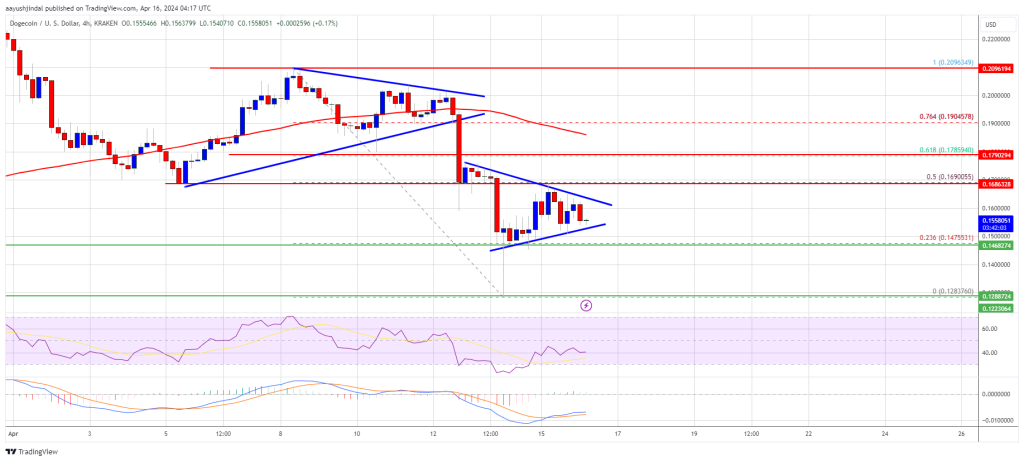
DOGE Price Prediction – Dogecoin Could Restart Drop To $0.12

Dogecoin is struggling below the $0.180 resistance zone against the US Dollar. DOGE must stay above the $0.1450 support zone to start a fresh increase.

  • DOGE started a fresh decline below the $0.1750 zone against the US dollar.
  • The price is trading above the $0.1700 level and the 100 simple moving average (4 hours).
  • There is a key contracting forming with support at $0.1540 on the 4-hour chart of the DOGE/USD pair (data source from Kraken).
  • The price could restart its increase unless there is a close below the $0.1450 support.

Dogecoin Price Turns Red

After struggling to clear the $0.20 resistance zone, Dogecoin price started a fresh decline. There was a sharp bearish move below the $0.180 and $0.1650 levels. DOGE traded as low as $0.1283 and recently attempted a recovery wave like Bitcoin and Ethereum.

The price climbed above the $0.1450 level. It broke the 23.6% Fib retracement level of the downward move from the $0.2096 swing high to the $0.1283 low.

However, the bears are active near the $0.1680 resistance and the 50% Fib retracement level of the downward move from the $0.2096 swing high to the $0.1283 low. The price is now consolidating near the $0.1550 level. There is also a key contracting forming with support at $0.1540 on the 4-hour chart of the DOGE/USD pair.

DOGE Price

Source: DOGEUSD on TradingView.com

Dogecoin is also below the $0.1600 level and the 100 simple moving average (4 hours). On the upside, the price is facing resistance near the $0.160 level. The next major resistance is near the $0.170 level. A close above the $0.170 resistance might send the price toward the $0.1880 resistance. The next major resistance is near $0.200. Any more gains might send the price toward the $0.220 level.

More Downsides in DOGE?

If DOGE’s price fails to gain pace above the $0.160 level, it could continue to move down. Initial support on the downside is near the $0.1520 level.

The next major support is near the $0.1450 level. If there is a downside break below the $0.1450 support, the price could decline further. In the stated case, the price might decline toward the $0.120 level.

Technical Indicators

4 Hours MACD – The MACD for DOGE/USD is now gaining momentum in the bearish zone.

4 Hours RSI (Relative Strength Index) – The RSI for DOGE/USD is now below the 50 level.

Major Support Levels – $0.1520, $0.1450 and $0.1280.

Major Resistance Levels – $0.1600, $0.1780, and $0.200.

DOGE Price Prediction – Dogecoin Could Restart Rally If It Holds This Support

Dogecoin is correcting gains from the $0.230 zone against the US Dollar. DOGE must stay above the $0.1750 support zone to start a fresh increase.

  • DOGE struggled to stay above $0.225 and corrected gains against the US dollar.
  • The price is trading above the $0.1750 level and the 100 simple moving average (4 hours).
  • There was a break below a key bullish trend line with support at $0.2040 on the 4-hour chart of the DOGE/USD pair (data source from Kraken).
  • The price could restart its increase unless there is a close below the $0.1750 support.

Dogecoin Price Approaches Key Support

After a steady increase, Dogecoin price attempted more gains above the $0.230 zone. However, DOGE struggled above $0.2250. A high was formed at $0.2294 and the price started a downside correction, like Bitcoin and Ethereum.

There was a drop below the $0.2050 and $0.200 support levels. The price dipped below the 23.6% Fib retracement level of the upward move from the $0.1228 swing low to the $0.2294 high.

Besides, there was a break below a key bullish trend line with support at $0.2040 on the 4-hour chart of the DOGE/USD pair. However, Dogecoin is still above the $0.1750 level and the 100 simple moving average (4 hours).

DOGE Price Prediction

Source: DOGEUSD on TradingView.com

On the upside, the price is facing resistance near the $0.1950 level. The next major resistance is near the $0.200 level. A close above the $0.200 resistance might send the price toward the $0.2150 resistance. The next major resistance is near $0.2300. Any more gains might send the price toward the $0.2500 level.

More Downsides in DOGE?

If DOGE’s price fails to gain pace above the $0.200 level, it could continue to move down. Initial support on the downside is near the $0.1820 level.

The next major support is near the $0.1750 level or the 50% Fib retracement level of the upward move from the $0.1228 swing low to the $0.2294 high. If there is a downside break below the $0.1750 support, the price could decline further. In the stated case, the price might decline toward the $0.1480 level.

Technical Indicators

4 Hours MACD – The MACD for DOGE/USD is now gaining momentum in the bearish zone.

4 Hours RSI (Relative Strength Index) – The RSI for DOGE/USD is now below the 50 level.

Major Support Levels – $0.1820, $0.1750 and $0.1480.

Major Resistance Levels – $0.2000, $0.2150, and $0.2300.

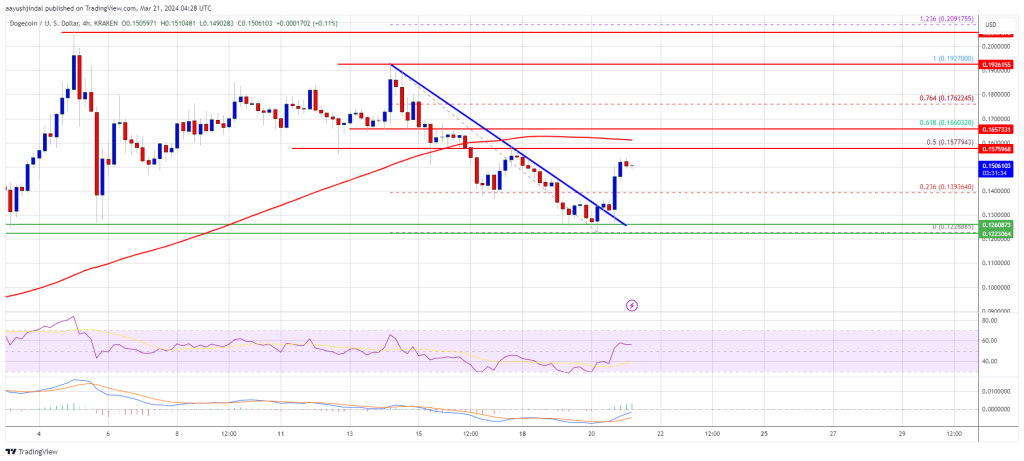
Dogecoin Price Holds Crucial Support But Can DOGE Clear This Hurdle?

Dogecoin is recovering higher from $0.1220 against the US Dollar. DOGE must clear the $0.1650 resistance to start another increase toward $0.200.

  • DOGE declined heavily and tested the $0.1220 support against the US dollar.
  • The price is trading below the $0.1650 level and the 100 simple moving average (4 hours).
  • There was a break above a key bearish trend line with resistance at $0.1310 on the 4-hour chart of the DOGE/USD pair (data source from Kraken).
  • The price could gain bullish momentum if it clears the $0.1600 and $0.1650 resistance levels.

Dogecoin Price Recovers Over 15%

After a strong decline, Dogecoin price found support near the $0.1220 zone. A low was formed at $0.1228 and DOGE recently started a decent recovery wave, like Bitcoin and Ethereum.

There was a steady increase above the $0.1320 and $0.1350 resistance levels. The price cleared the 23.6% Fib retracement level of the downward move from the $0.1927 swing high to the $0.1228 low. There was also a break above a key bearish trend line with resistance at $0.1310 on the 4-hour chart of the DOGE/USD pair.

Dogecoin is still trading below the $0.160 level and the 100 simple moving average (4 hours). On the upside, the price is facing resistance near the $0.1580 level or the 50% Fib retracement level of the downward move from the $0.1927 swing high to the $0.1228 low.

Dogecoin Price

Source: DOGEUSD on TradingView.com

The next major resistance is near the $0.1650 level. A close above the $0.1650 resistance might send the price toward the $0.1850 resistance. The next major resistance is near $0.200. Any more gains might send the price toward the $0.220 level.

Another Decline in DOGE?

If DOGE’s price fails to gain pace above the $0.160 level, it could start another decline. Initial support on the downside is near the $0.1450 level.

The next major support is near the $0.130 level. If there is a downside break below the $0.130 support, the price could decline further. In the stated case, the price might decline toward the $0.1150 level.

Technical Indicators

4 Hours MACD – The MACD for DOGE/USD is now gaining momentum in the bullish zone.

4 Hours RSI (Relative Strength Index) – The RSI for DOGE/USD is now above the 50 level.

Major Support Levels – $0.1450, $0.130 and $0.1150.

Major Resistance Levels – $0.1580, $0.160, and $0.1650.

Dogecoin Price Pumps To $0.20, Can DOGE Bulls Send It To $0.25

Dogecoin is up over 100% against the US Dollar. DOGE rallied toward the $0.20 resistance and might continue to rise toward the $0.225 resistance.

  • DOGE extended its rally above the $0.150 resistance against the US dollar.
  • The price is trading above the $0.180 level and the 100 simple moving average (4 hours).
  • There is a connecting bullish trend line forming with support at $0.1620 on the 4-hour chart of the DOGE/USD pair (data source from Kraken).
  • The price could extend its rally above the $0.200 and $0.2120 resistance levels.

Dogecoin Price Surges Over 100%

In the past few sessions, Dogecoin price started a strong increase above the $0.10 resistance. DOGE cleared many hurdles near $0.1250 to enter a positive zone.

It even broke the $0.150 resistance and outperformed Bitcoin and Ethereum. It is up over 100% in a few sessions and traded close to the $0.20 resistance. A new multi-week high was formed near $0.992 and the price is now correcting gains.

The price is well above the 23.6% Fib retracement level of the recent rally from the $0.1250 swing low to the $0.1992 high. DOGE is also trading above the $0.180 level and the 100 simple moving average (4 hours).

There is also a connecting bullish trend line forming with support at $0.1620 on the 4-hour chart of the DOGE/USD pair. The trend line is near the 50% Fib retracement level of the recent rally from the $0.1250 swing low to the $0.1992 high.

Dogecoin Price

Source: DOGEUSD on TradingView.com

On the upside, the price is facing resistance near the $0.1980 level. The next major resistance is near the $0.20 level. A close above the $0.20 resistance might send the price toward the $0.2250 resistance. The next major resistance is near $0.2320. Any more gains might send the price toward the $0.250 level.

Downside Correction in DOGE?

If DOGE’s price fails to gain pace above the $0.20 level, it could start a downside correction. Initial support on the downside is near the $0.182 level.

The next major support is near the $0.1620 level or the trend line. If there is a downside break below the $0.1620 support, the price could decline further. In the stated case, the price might decline toward the $0.1350 level.

Technical Indicators

4 Hours MACD – The MACD for DOGE/USD is now gaining momentum in the bullish zone.

4 Hours RSI (Relative Strength Index) – The RSI for DOGE/USD is now in the overbought zone.

Major Support Levels – $0.1820, $0.1620 and $0.1350.

Major Resistance Levels – $0.1980, $0.20, and $0.2250.

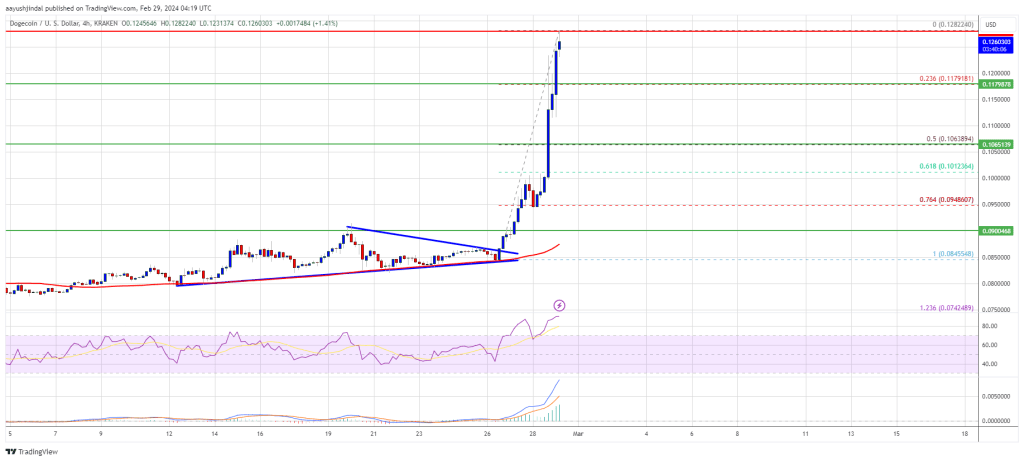
Dogecoin Price Soars 25%, Why DOGE Bulls Are Not Done Yet

Dogecoin is up over 25% against the US Dollar. DOGE cleared the $0.120 resistance and might continue to rise toward the $0.132 resistance.

  • DOGE started a strong increase after it broke the $0.0850 resistance against the US dollar.
  • The price is trading above the $0.120 level and the 100 simple moving average (4 hours).
  • There was a break above a key contracting triangle with resistance at $0.0845 on the 4-hour chart of the DOGE/USD pair (data source from Kraken).
  • The price could extend its rally above the $0.1280 and $0.130 resistance levels.

Dogecoin Price Pumps Above $0.12

In the past few sessions, Dogecoin price started a strong increase from the $0.080 support zone. DOGE cleared many hurdles near $0.0850 to enter a positive zone.

There was a break above a key contracting triangle with resistance at $0.0845 on the 4-hour chart of the DOGE/USD pair. It even broke the $0.100 resistance to move further into a positive zone like Bitcoin and Ethereum.

It is up over 25% and trading above $0.120. A new multi-week high was formed near $0.1282 and the price is now correcting gains. The price is well above the 23.6% Fib retracement level of the recent surge from the $0.0845 swing low to the $0.1282 high.

Dogecoin Price

Source: DOGEUSD on TradingView.com

DOGE is also trading above the $0.1220 level and the 100 simple moving average (4 hours). On the upside, the price is facing resistance near the $0.1280 level. The next major resistance is near the $0.1320 level. A close above the $0.1320 resistance might send the price toward the $0.1450 resistance. The next major resistance is near $0.150. Any more gains might send the price toward the $0.1620 level.

Downside Correction in DOGE?

If DOGE’s price fails to gain pace above the $0.1280 level, it could start a downside correction. Initial support on the downside is near the $0.120 level.

The next major support is near the $0.1065 level or the 50% Fib retracement level of the recent surge from the $0.0845 swing low to the $0.1282 high. If there is a downside break below the $0.1065 support, the price could decline further. In the stated case, the price might decline toward the $0.100 level.

Technical Indicators

4 Hours MACD – The MACD for DOGE/USD is now gaining momentum in the bullish zone.

4 Hours RSI (Relative Strength Index) – The RSI for DOGE/USD is now in the overbought zone.

Major Support Levels – $0.120, $0.1065 and $0.10.

Major Resistance Levels – $0.1280, $0.1320, and $0.150.

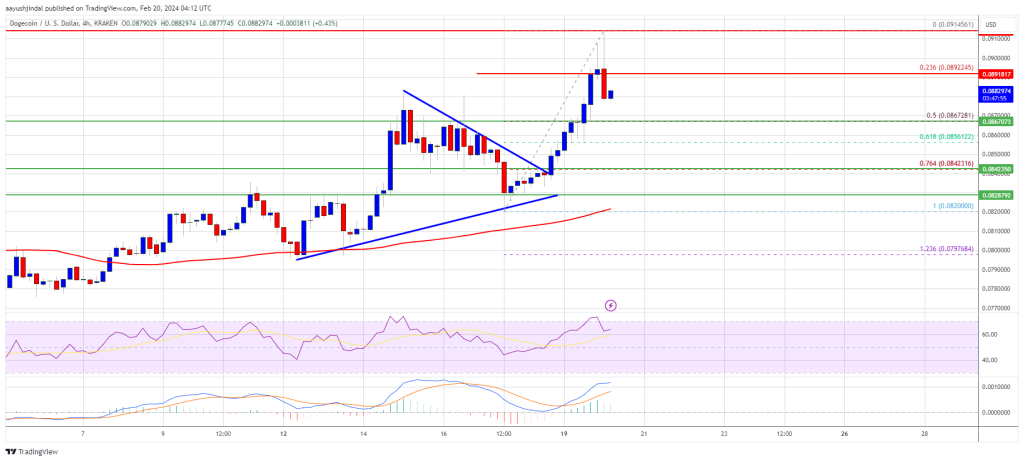
Dogecoin Price Prediction – DOGE Signals Bullish Break, Bulls Aims For $0.10

Dogecoin is showing bullish signs above the $0.0875 zone against the US Dollar. DOGE could extend its rally toward the $0.100 resistance in the near term.

  • DOGE is showing positive signs above the $0.0875 zone against the US dollar.
  • The price is trading above the $0.0880 level and the 100 simple moving average (4 hours).
  • There was a break above a key contracting triangle with resistance at $0.0842 on the 4-hour chart of the DOGE/USD pair (data source from Kraken).
  • The price could extend its rally above the $0.090 and $0.092 resistance levels.

Dogecoin Price Aims Higher

In the past few sessions, Dogecoin price started a decent increase from the $0.082 support zone. DOGE cleared many hurdles near $0.0850 to enter a positive zone.

There was a break above a key contracting triangle with resistance at $0.0842 on the 4-hour chart of the DOGE/USD pair. It even broke the $0.0880 resistance to move further into a positive zone like Bitcoin and Ethereum. A high was formed near $0.0914 and the price is now correcting gains.

There was a move below the 23.6% Fib retracement level of the recent wave from the $0.0820 swing low to the $0.0914 high. DOGE is also trading above the $0.0875 level and the 100 simple moving average (4 hours).

Dogecoin Price Prediction

Source: DOGEUSD on TradingView.com

On the upside, the price is facing resistance near the $0.0892 level. The next major resistance is near the $0.0915 level. A close above the $0.0915 resistance might send the price toward the $0.095 resistance. The next major resistance is near $0.100. Any more gains might send the price toward the $0.120 level.

Downside Correction in DOGE?

If DOGE’s price fails to gain pace above the $0.0915 level, it could start a downside correction. Initial support on the downside is near the $0.0865 level.

The next major support is near the $0.0855 level or the 61.8% Fib retracement level of the recent wave from the $0.0820 swing low to the $0.0914 high. If there is a downside break below the $0.0855 support, the price could decline further. In the stated case, the price might decline toward the $0.0820 level.

Technical Indicators

4 Hours MACD – The MACD for DOGE/USD is now losing momentum in the bullish zone.

4 Hours RSI (Relative Strength Index) – The RSI for DOGE/USD is now above the 50 level.

Major Support Levels – $0.0865, $0.0855 and $0.0820.

Major Resistance Levels – $0.0915, $0.095, and $0.10.

Dogecoin Price Prediction – DOGE Pump To $0.12 Seems Imminent

Dogecoin is gaining pace above the $0.085 zone against the US Dollar. DOGE could start a fresh rally above the $0.088 and $0.095 resistance levels.

  • DOGE is showing positive signs above the $0.085 zone against the US dollar.
  • The price is trading above the $0.0865 level and the 100 simple moving average (4 hours).
  • There was a break above a key contracting triangle with resistance at $0.0820 on the 4-hour chart of the DOGE/USD pair (data source from Kraken).
  • The price could extend its rally above the $0.088 and $0.095 resistance levels.

Dogecoin Price Turns Green

In the past few sessions, Dogecoin price started a decent increase from the $0.080 support zone. DOGE cleared many hurdles near $0.0820 to enter a positive zone.

There was a break above a key contracting triangle with resistance at $0.0820 on the 4-hour chart of the DOGE/USD pair. It even broke the $0.0850 resistance, but the upsides were less than Bitcoin and Ethereum. A high is formed near $0.0883 and the price is now consolidating gains.

It is trading above the 23.6% Fib retracement level of the recent increase from the $0.0795 swing low to the $0.0883 high. DOGE is also trading above the $0.0865 level and the 100 simple moving average (4 hours).

Dogecoin Price Prediction

Source: DOGEUSD on TradingView.com

On the upside, the price is facing resistance near the $0.0880 level. The next major resistance is near the $0.0920 level. A close above the $0.0920 resistance might send the price toward the $0.095 resistance. The next major resistance is near $0.100. Any more gains might send the price toward the $0.120 level.

Downside Correction in DOGE?

If DOGE’s price fails to gain pace above the $0.0880 level, it could start a downside correction. Initial support on the downside is near the $0.0860 level.

The next major support is near the $0.0840 level or the 50% Fib retracement level of the recent increase from the $0.0795 swing low to the $0.0883 high. If there is a downside break below the $0.0840 support, the price could decline further. In the stated case, the price might decline toward the $0.0820 level.

Technical Indicators

4 Hours MACD – The MACD for DOGE/USD is now losing momentum in the bullish zone.

4 Hours RSI (Relative Strength Index) – The RSI for DOGE/USD is now above the 50 level.

Major Support Levels – $0.086, $0.084, and $0.082.

Major Resistance Levels – $0.088, $0.092, and $0.10.

Dogecoin Price Prediction – DOGE Bulls Aim For Fresh Rally To $0.095

Dogecoin is finding bids above the $0.0750 zone against the US Dollar. DOGE could gain bullish momentum if it clears the $0.0820 resistance zone.

  • DOGE is showing positive signs above the $0.080 zone against the US dollar.
  • The price is trading above the $0.0795 level and the 100 simple moving average (4 hours).
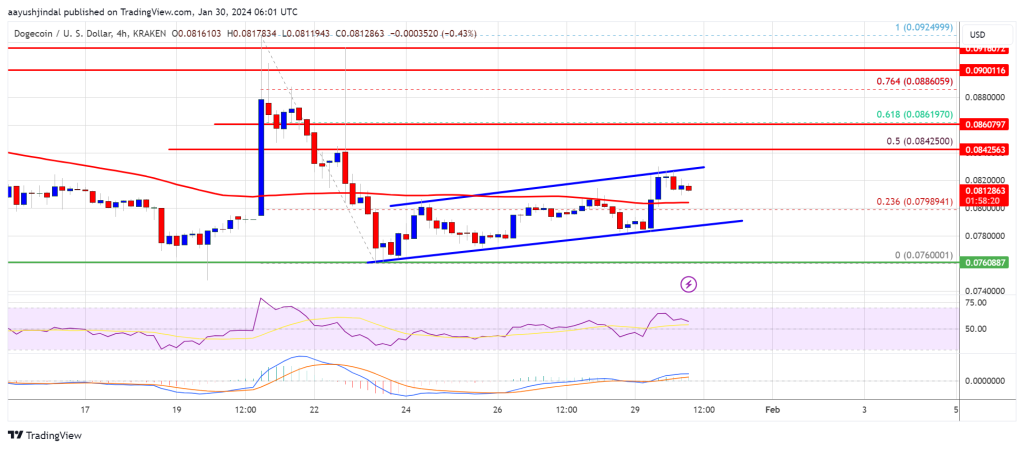
  • There is a key rising channel forming with support at $0.0795 on the 4-hour chart of the DOGE/USD pair (data source from Kraken).
  • The price could start a recovery wave if it clears $0.0820 and $0.0850.

Dogecoin Price Eyes Fresh Surge

In the past few sessions, Dogecoin price remained well-bid above the $0.0750 zone. DOGE formed a base and recently started a recovery wave above $0.0780, like Bitcoin and Ethereum.

There was a decent move above the 23.6% Fib retracement level of the downward move from the $0.0924 swing high to the $0.0760 low. DOGE is now trading above the $0.080 level and the 100 simple moving average (4 hours). There is also a key rising channel forming with support at $0.0795 on the 4-hour chart of the DOGE/USD pair.

On the upside, the price is facing resistance near the $0.0820 level. The next major resistance is near the $0.0842 level. It is close to the 50% Fib retracement level of the downward move from the $0.0924 swing high to the $0.0760 low.

Dogecoin Price Prediction

Source: DOGEUSD on TradingView.com

A close above the $0.0845 resistance might send the price toward the $0.090 resistance. The next major resistance is near $0.095. Any more gains might send the price toward the $0.105 level.

Another Decline in DOGE?

If DOGE’s price fails to gain pace above the $0.0845 level, it could start a fresh decline. Initial support on the downside is near the $0.0780 level.

The next major support is near the $0.0765 level. If there is a downside break below the $0.0765 support, the price could decline further. In the stated case, the price might decline toward the $0.0720 level.

Technical Indicators

4 Hours MACD – The MACD for DOGE/USD is now losing momentum in the bullish zone.

4 Hours RSI (Relative Strength Index) – The RSI for DOGE/USD is now above the 50 level.

Major Support Levels – $0.078, $0.0765, and $0.0750.

Major Resistance Levels – $0.0820, $0.0845, and $0.0920.

Dogecoin Price Prediction – DOGE Turns Attractive To Bears On Rallies

Dogecoin started a fresh decline from the $0.0950 resistance against the US Dollar. DOGE could extend its decline unless there is a close above $0.090.

  • DOGE struggled near $0.0950 and started a fresh decline against the US dollar.
  • The price is trading below the $0.090 level and the 100 simple moving average (4 hours).
  • There is a key bearish trend line forming with resistance near $0.0920 on the 4-hour chart of the DOGE/USD pair (data source from Kraken).
  • The price could start a recovery wave if it clears $0.090 and $0.0950.

Dogecoin Price Faces Key Hurdles

In the past few sessions, Dogecoin price struggled to gain pace above $0.0920. DOGE remained below the $0.095 resistance zone and started a fresh decline, like Bitcoin and Ethereum.

There was a sharp drop below the $0.0900 and $0.0865 support levels. It even tested the $0.0760 zone. A low was formed near $0.0760, and the price is now attempting a recovery wave. There was a move above the $0.080 resistance zone.

It cleared the 23.6% Fib retracement level of the downward move from the $0.0943 swing high to the $0.0760 low. DOGE is now trading below the $0.090 level and the 100 simple moving average (4 hours). There is also a key bearish trend line forming with resistance near $0.0920 on the 4-hour chart of the DOGE/USD pair.

On the upside, the price is facing resistance near the $0.0875 level. It is close to the 61.8% Fib retracement level of the downward move from the $0.0943 swing high to the $0.0760 low. The next major resistance is near the $0.090 level.

Dogecoin Price Prediction

Source: DOGEUSD on TradingView.com

A close above the $0.090 resistance might send the price toward the $0.092 resistance. The next major resistance is near $0.095. Any more gains might send the price toward the $0.105 level.

More Downsides in DOGE?

If DOGE’s price fails to gain pace above the $0.0875 level, it could start a fresh decline. Initial support on the downside is near the $0.080 level.

The next major support is near the $0.0760 level. If there is a downside break below the $0.0760 support, the price could decline further. In the stated case, the price might decline toward the $0.0710 level.

Technical Indicators

4 Hours MACD – The MACD for DOGE/USD is now gaining momentum in the bearish zone.

4 Hours RSI (Relative Strength Index) – The RSI for DOGE/USD is now below the 50 level.

Major Support Levels – $0.080, $0.0760, and $0.0710.

Major Resistance Levels – $0.0875, $0.0920, and $0.0950.

Dogecoin Price Prediction – DOGE Bulls Be Able to Hit $0.092 Barrier?

Dogecoin is showing positive signs above the $0.0750 resistance against the US Dollar. DOGE could rally over 10% if it clears the $0.0812 resistance zone.

  • DOGE started a decent increase above the $0.0750 resistance against the US dollar.
  • The price is trading above the $0.0785 level and the 100 simple moving average (4 hours).
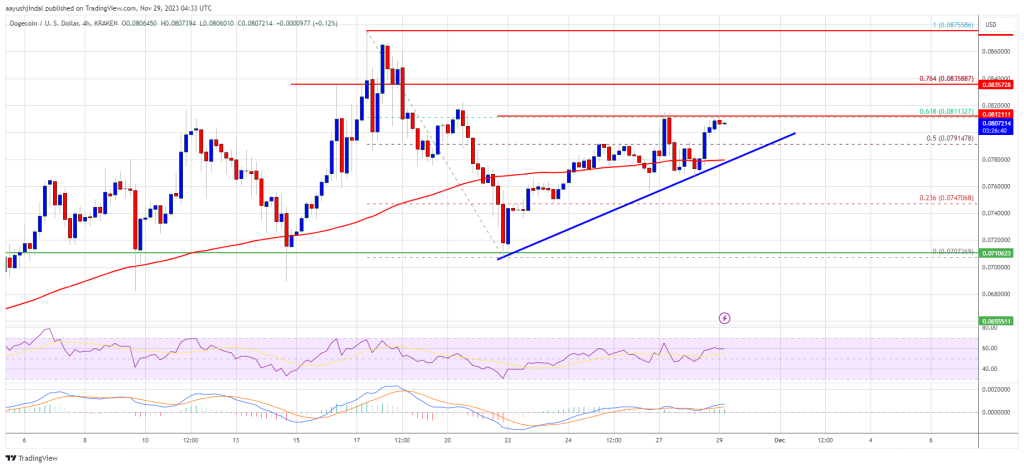
  • There is a key bullish trend line forming with support near $0.0792 on the 4-hour chart of the DOGE/USD pair (data source from Kraken).
  • The price could start a strong rally like Solana if it clears the $0.0812 resistance.

Dogecoin Price Eyes Fresh Rally

After forming a base above the $0.070 level, Dogecoin price started a fresh increase. DOGE broke the $0.0725 resistance zone to move into a positive zone, like Bitcoin and Ethereum.

The bulls were able to push the price further above the $0.0750 resistance. There was a clear move above the 50% Fib retracement level of the downward move from the $0.0875 swing high to the $0.0707 low. However, the price seems to be struggling near the $0.0812 resistance.

DOGE is now trading above the $0.0785 level and the 100 simple moving average (4 hours). There is also a key bullish trend line forming with support near $0.0792 on the 4-hour chart of the DOGE/USD pair.

On the upside, the price is facing resistance near the $0.0812 level. It is close to the 61.8% Fib retracement level of the downward move from the $0.0875 swing high to the $0.0707 low. The next major resistance is near the $0.0835 level.

Dogecoin Price Prediction

Source: DOGEUSD on TradingView.com

A close above the $0.0835 resistance might send the price toward the $0.088 resistance. The next major resistance is near $0.0920. Any more gains might send the price toward the $0.095 level.

Are Dips Supported in DOGE?

If DOGE’s price fails to gain pace above the $0.0812 level, it could start a downside correction. Initial support on the downside is near the $0.0792 level and the trend line.

The next major support is near the $0.0770 level. If there is a downside break below the $0.0770 support, the price could decline further. In the stated case, the price might decline toward the $0.0710 level.

Technical Indicators

4 Hours MACD – The MACD for DOGE/USD is now gaining momentum in the bullish zone.

4 Hours RSI (Relative Strength Index) – The RSI for DOGE/USD is now above the 50 level.

Major Support Levels – $0.0792, $0.0770, and $0.0710.

Major Resistance Levels – $0.0812, $0.0835, and $0.0880.

Howling At The Moon: 23,000% Dogecoin Signal Reawakens

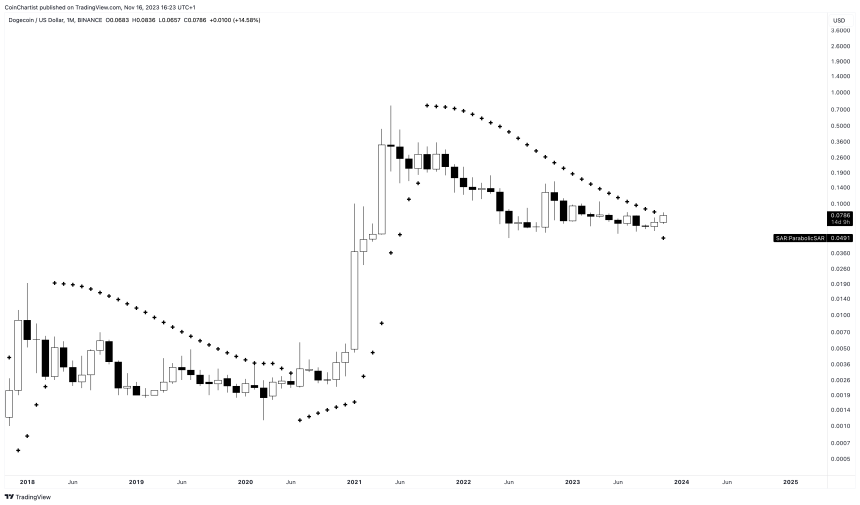
Dogecoin holders are howling for the popular meme cryptocurrency to reach “the moon” and they just might get it. That’s because a parabolic technical signal is back that last appeared prior to a stunning 23,000% rally.

Keep reading to learn more about the signal and what this could mean for DOGE.

Dogecoin Tags Parabolic SAR: Another 23,000% Surge Ahead?

During the last crypto bull market, Dogecoin was on of the standout stars, outperforming Bitcoin, Ethereum, and most other altcoins. Driven by meme mania, stimulation checks, and Elon Musk tweets, DOGE made a lot of people a lot of money.

Prior to the bull run in 2020, the Doge-inspired meme coin spent over three years in a downtrend. Right before the breakout that sent Dogecoin soaring DOGEUSD price action had tapped the 1M Parabolic SAR.

Not even one year after the monthly Parabolic SAR was tagged on the USD trading pair, Dogecoin put in over a 23,000% rally before reaching a peak in 2021.

dogecoin signal

Can The Parabolic SAR Revive Meme Coin Season Once Again?

The Parabolic SAR is a technical indicator designed by J. Welles Wilder, Jr. responsible for creating other popular tools like the Relative Strength Index, Average Directional Index, and Average True Range.

The acronym SAR stands for Stop and Reverse, and the tool’s intention is to tell an analyst when a trend has potentially stopped and reversed.

In 2020, the signal in Dogecoin indeed was the final point before the downtrend stopped and reversed up to new highs. Now that the signal has been triggered again, what type of move might we be able to expect from the meme coin?

As stated, the last time it was tagged DOGEUSD rallied more than 23,000%. The Parabolic SAR was also hit on the 1M timeframe in April 2017 just before another 6,200% rally. An average of the two major rallies suggests a possible 14,600% surge.

However, Elliott Wave Principle points to the first wave of any cycle being similar in magnitude as the final wave – hinting at another 6,200% ROI if an uptrend does materialize from here.

Dogecoin Price Prediction – DOGE Rally To $0.085 Seems Imminent

Dogecoin is showing positive signs above the $0.0720 resistance against the US Dollar. DOGE could rally over 10% if it clears the $0.0765 resistance zone.

  • DOGE started a decent increase above the $0.070 resistance against the US dollar.
  • The price is trading below the $0.0720 level and the 100 simple moving average (4 hours).
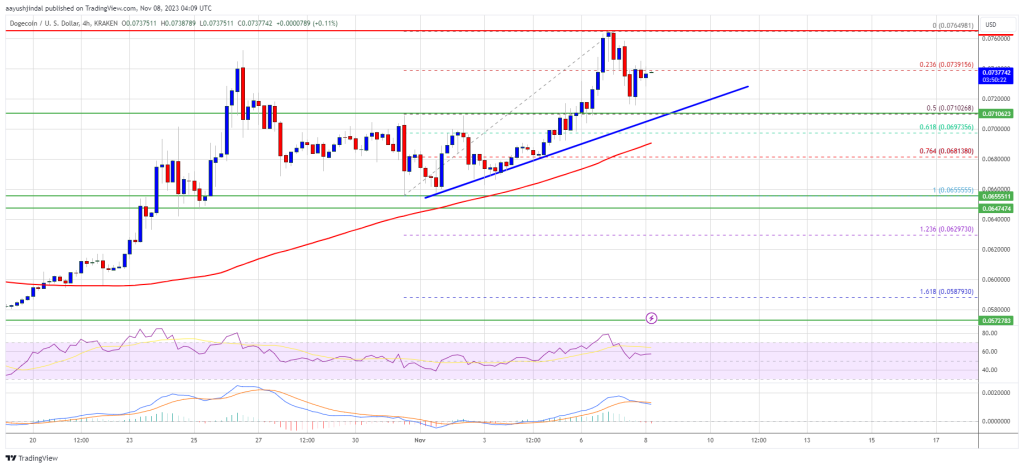
  • There is a key bullish trend line forming with support near $0.0712 on the 4-hour chart of the DOGE/USD pair (data source from Kraken).
  • The price could start a strong rally like Solana if it clears the $0.0765 resistance.

Dogecoin Price Aims Key Upside Break

After forming a base above the $0.065 level, Dogecoin price started a fresh increase. DOGE broke the $0.0685 resistance zone to move into a positive zone, like Bitcoin and Ethereum.

The bulls were able to push the price further above the $0.0720 resistance. However, the price failed to clear the $0.0765 resistance and corrected lower. There was a move below the $0.0740 level. The price declined below the 23.6% Fib retracement level of the upward move from the $0.0655 swing low to the $0.0764 high.

DOGE is now trading above the $0.072 level and the 100 simple moving average (4 hours). There is also a key bullish trend line forming with support near $0.0712 on the 4-hour chart of the DOGE/USD pair. The trend line is near the 50% Fib retracement level of the upward move from the $0.0655 swing low to the $0.0764 high.

Dogecoin Price Prediction

Source: DOGEUSD on TradingView.com

On the upside, the price is facing resistance near the $0.0750 level. The first major resistance is near the $0.0765 level. A close above the $0.0765 resistance might send the price toward the $0.080 resistance. The next major resistance is near $0.0820. Any more gains might send the price toward the $0.085 level.

Are Dips Limited in DOGE?

If DOGE’s price fails to gain pace above the $0.0765 level, it could continue to move down. Initial support on the downside is near the $0.0720 level.

The next major support is near the $0.0712 level and the trend line. If there is a downside break below the $0.0712 support, the price could decline further. In the stated case, the price might decline toward the $0.070 level or the 100 simple moving average (4 hours).

Technical Indicators

4 Hours MACD – The MACD for DOGE/USD is now gaining momentum in the bullish zone.

4 Hours RSI (Relative Strength Index) – The RSI for DOGE/USD is now above the 50 level.

Major Support Levels – $0.0720, $0.0712, and $0.0700.

Major Resistance Levels – $0.0750, $0.0765, and $0.0850.

Dogecoin Price Prediction – DOGE Could Soon Pump 20% Like Bitcoin

Dogecoin is climbing higher above the $0.065 resistance against the US Dollar. DOGE could rally over 20% if it clears the $0.070 resistance zone.

  • DOGE started a decent increase above the $0.0625 resistance against the US dollar.
  • The price is trading below the $0.0650 level and the 100 simple moving average (4 hours).
  • There is a key bullish trend line forming with support near $0.0650 on the 4-hour chart of the DOGE/USD pair (data source from Kraken).
  • The price could start a strong rally like Bitcoin if it clears the $0.070 resistance.

Dogecoin Price Starts Increase

After forming a base above the $0.0575 level, Dogecoin price started a fresh increase. DOGE broke the $0.060 resistance zone to move into a positive zone.

The recent pump in Bitcoin and Ethereum also pushed DOGE further higher. There was a steady increase above the $0.0650 resistance zone. A high is formed near $0.0693 and the price is now consolidating gains. It is also above the 23.6% Fib retracement level of the recent increase from the $0.0574 swing low to the $0.0693 high.

DOGE is now trading above the $0.065 level and the 100 simple moving average (4 hours). On the upside, the price is facing resistance near the $0.0685 level. There is also a key bullish trend line forming with support near $0.0650 on the 4-hour chart of the DOGE/USD pair.

Dogecoin Price Prediction

Source: DOGEUSD on TradingView.com

The first major resistance is near the $0.0685 level. The main resistance is near $0.070. A close above the $0.070 resistance might send the price toward the $0.0735 resistance. The next major resistance is near $0.0750. Any more gains might send the price toward the $0.080 level.

Are Dips Supported in DOGE?

If DOGE’s price fails to gain pace above the $0.070 level, it could start a downside correction. Initial support on the downside is near the $0.0665 level.

The next major support is near the $0.0650 level. If there is a downside break below the $0.0650 support, the price could decline further. In the stated case, the price might decline toward the $0.0632 level or the 50% Fib retracement level of the recent increase from the $0.0574 swing low to the $0.0693 high.

Technical Indicators

4 Hours MACD – The MACD for DOGE/USD is now gaining momentum in the bullish zone.

4 Hours RSI (Relative Strength Index) – The RSI for DOGE/USD is now above the 50 level.

Major Support Levels – $0.0665, $0.0650, and $0.0632.

Major Resistance Levels – $0.0685, $0.0700, and $0.0750.

Dogecoin Price (DOGE) Prediction – Key Support Intact But Bulls Face Challenges

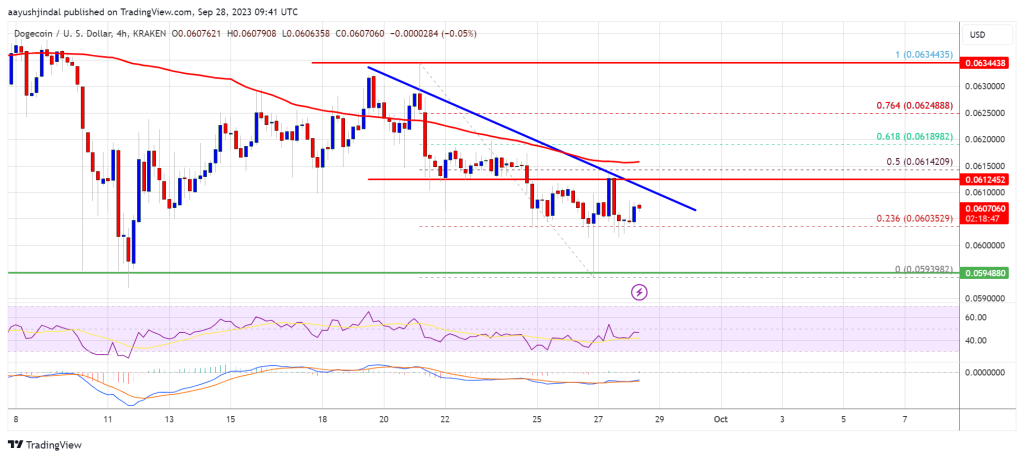
Dogecoin is holding the key support at $0.0595 against the US Dollar. DOGE could start a fresh increase if there is a clear move above $0.062 and $0.0635.

  • DOGE started a fresh decline and retested the $0.0595 level against the US dollar.
  • The price is trading below the $0.062 level and the 100 simple moving average (4 hours).
  • There is a key bearish trend line forming with resistance near $0.0610 on the 4-hour chart of the DOGE/USD pair (data source from Kraken).
  • The price could struggle to clear the $0.0615 and $0.0620 resistance levels.

Dogecoin Price Holds Support

After struggling to clear the $0.0635, Dogecoin price started a fresh decline. DOGE declined below the $0.0612 level and even spiked below $0.060.

A low was formed near $0.0593 and is currently correcting losses, like Bitcoin and Ethereum. There was a move above the $0.0602 level. The price climbed above the 23.6% Fib retracement level of the downward move from the $0.0634 swing high to the $0.0593 low.

DOGE is now trading below the $0.0615 level and the 100 simple moving average (4 hours). On the upside, the price is facing resistance near the $0.0610 level. There is also a key bearish trend line forming with resistance near $0.0610 on the 4-hour chart of the DOGE/USD pair.

The first major resistance is near the $0.0615 level. It is near the 50% Fib retracement level of the downward move from the $0.0634 swing high to the $0.0593 low.

Dogecoin Price (DOGE) Prediction

Source: DOGEUSD on TradingView.com

A close above the $0.0615 resistance might send the price toward the $0.0635 resistance. The next major resistance is near $0.0650. Any more gains might send the price toward the $0.0685 level.

Are Dips Supported in DOGE?

If DOGE’s price fails to gain pace above the $0.0612 level, it could start another decline. Initial support on the downside is near the $0.060 level.

The next major support is near the $0.0595 level. If there is a downside break below the $0.0595 support, the price could decline further. In the stated case, the price might decline toward the $0.055 level.

Technical Indicators

4 Hours MACD – The MACD for DOGE/USD is now losing momentum in the bearish zone.

4 Hours RSI (Relative Strength Index) – The RSI for DOGE/USD is now near the 50 level.

Major Support Levels – $0.060, $0.0595, and $0.0550.

Major Resistance Levels – $0.0612, $0.0635, and $0.0650.