Dogecoin Breaks Out Of Descending Triangle Like It Did In 2021, Analyst Sets $6 Target

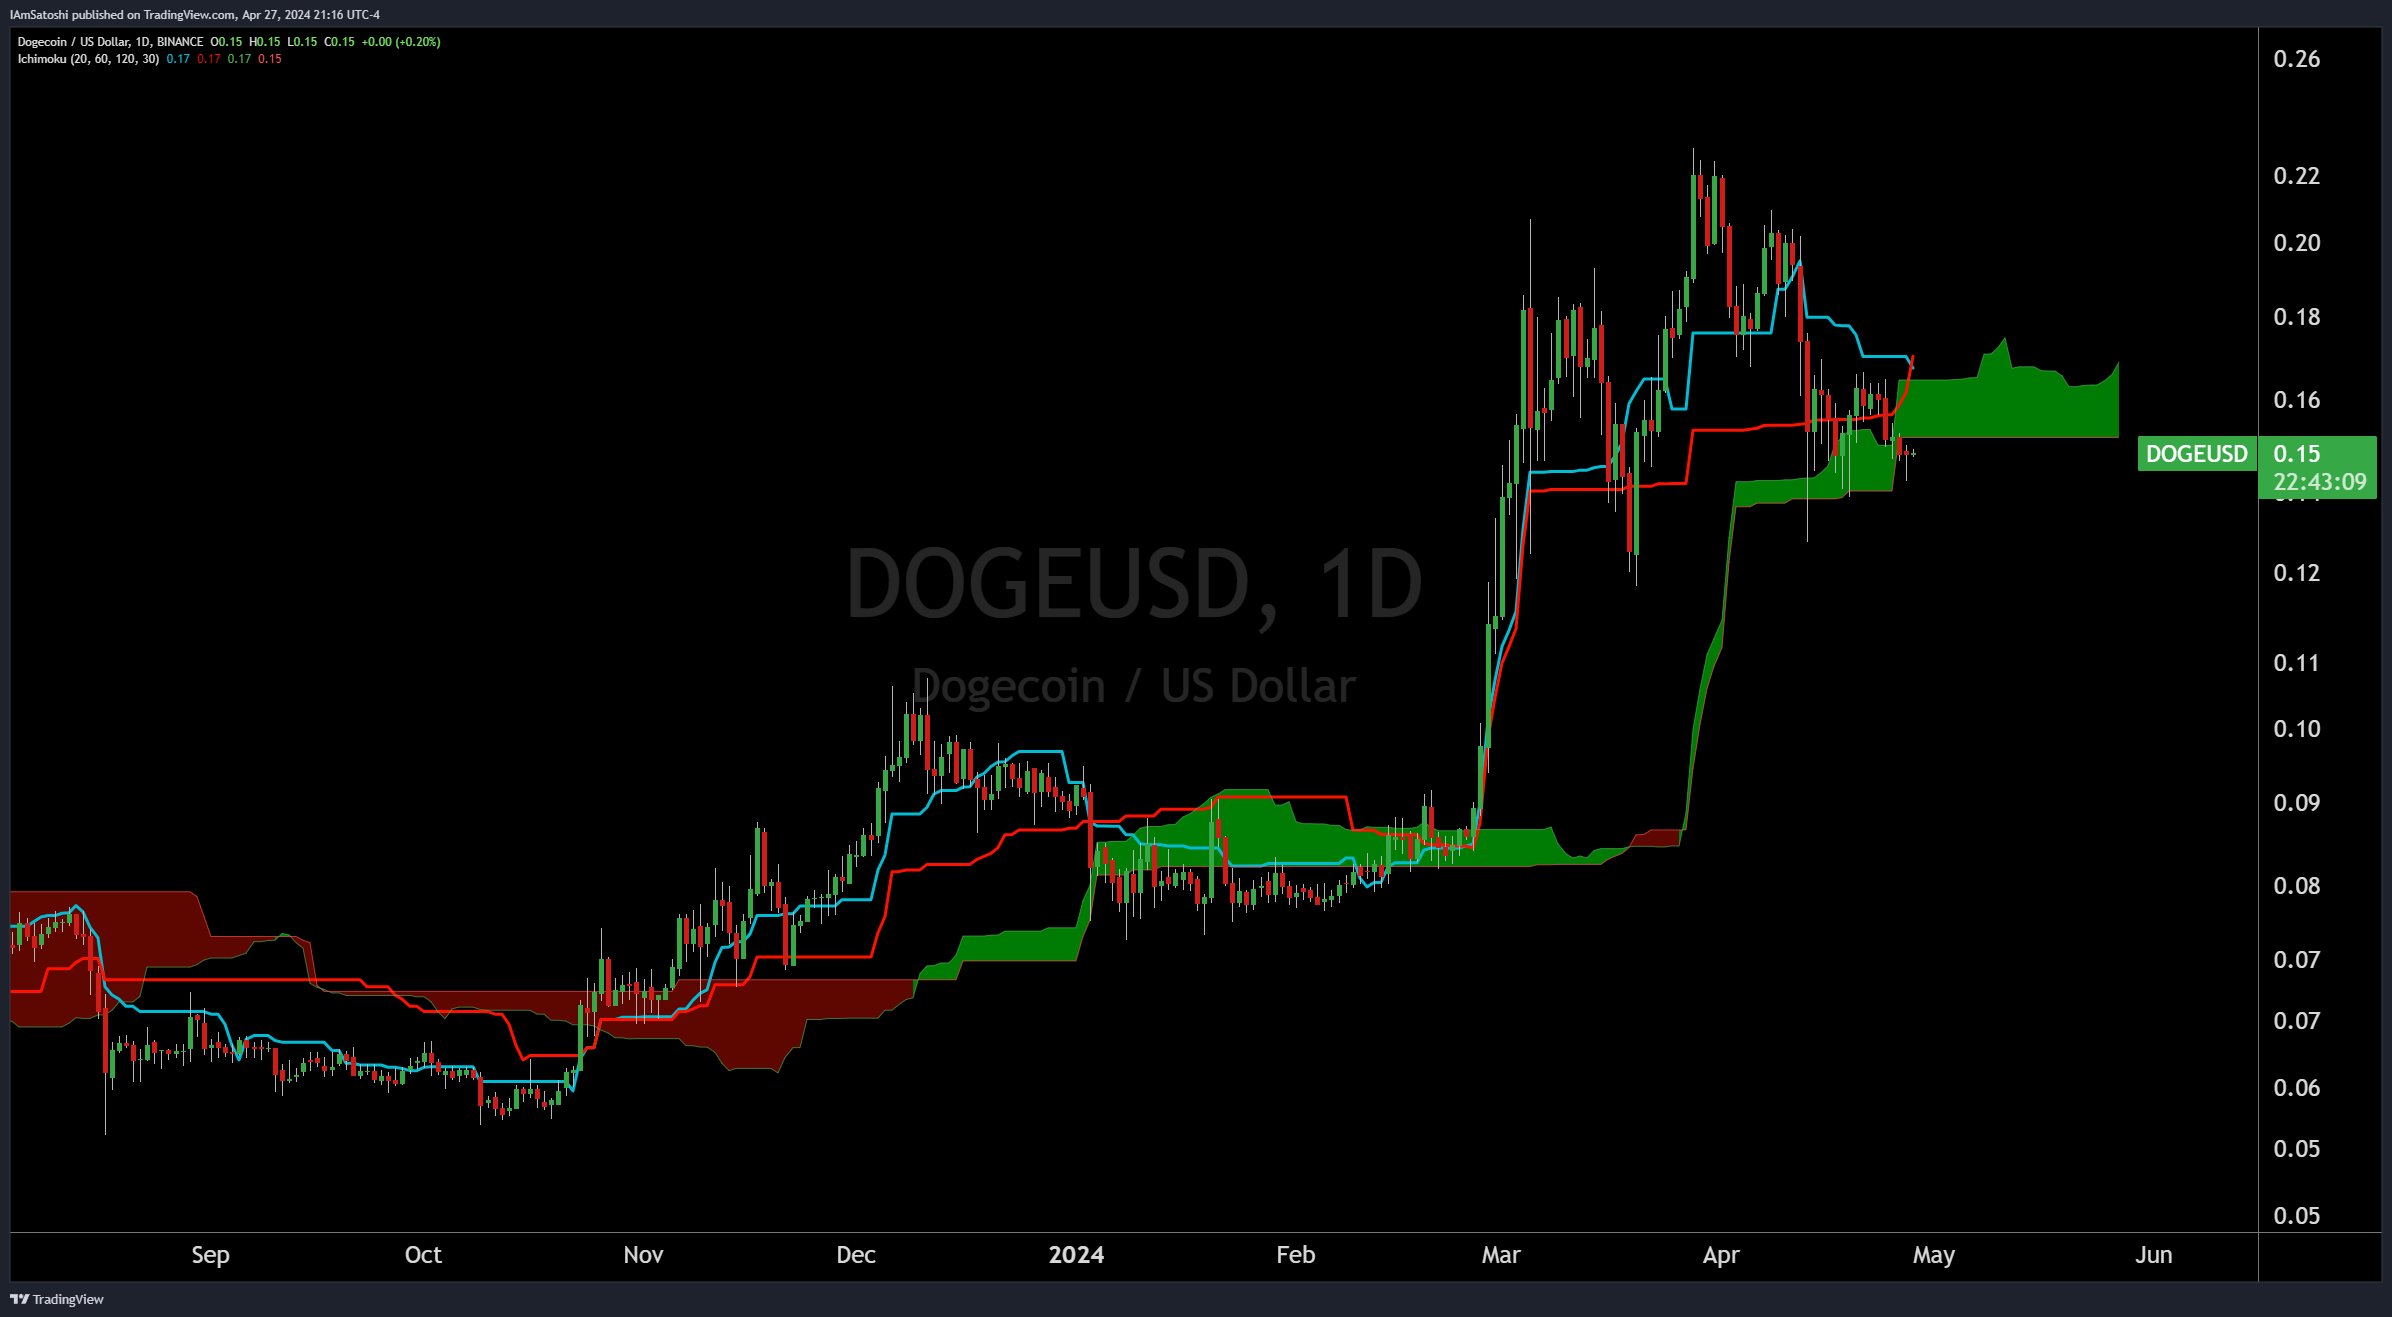
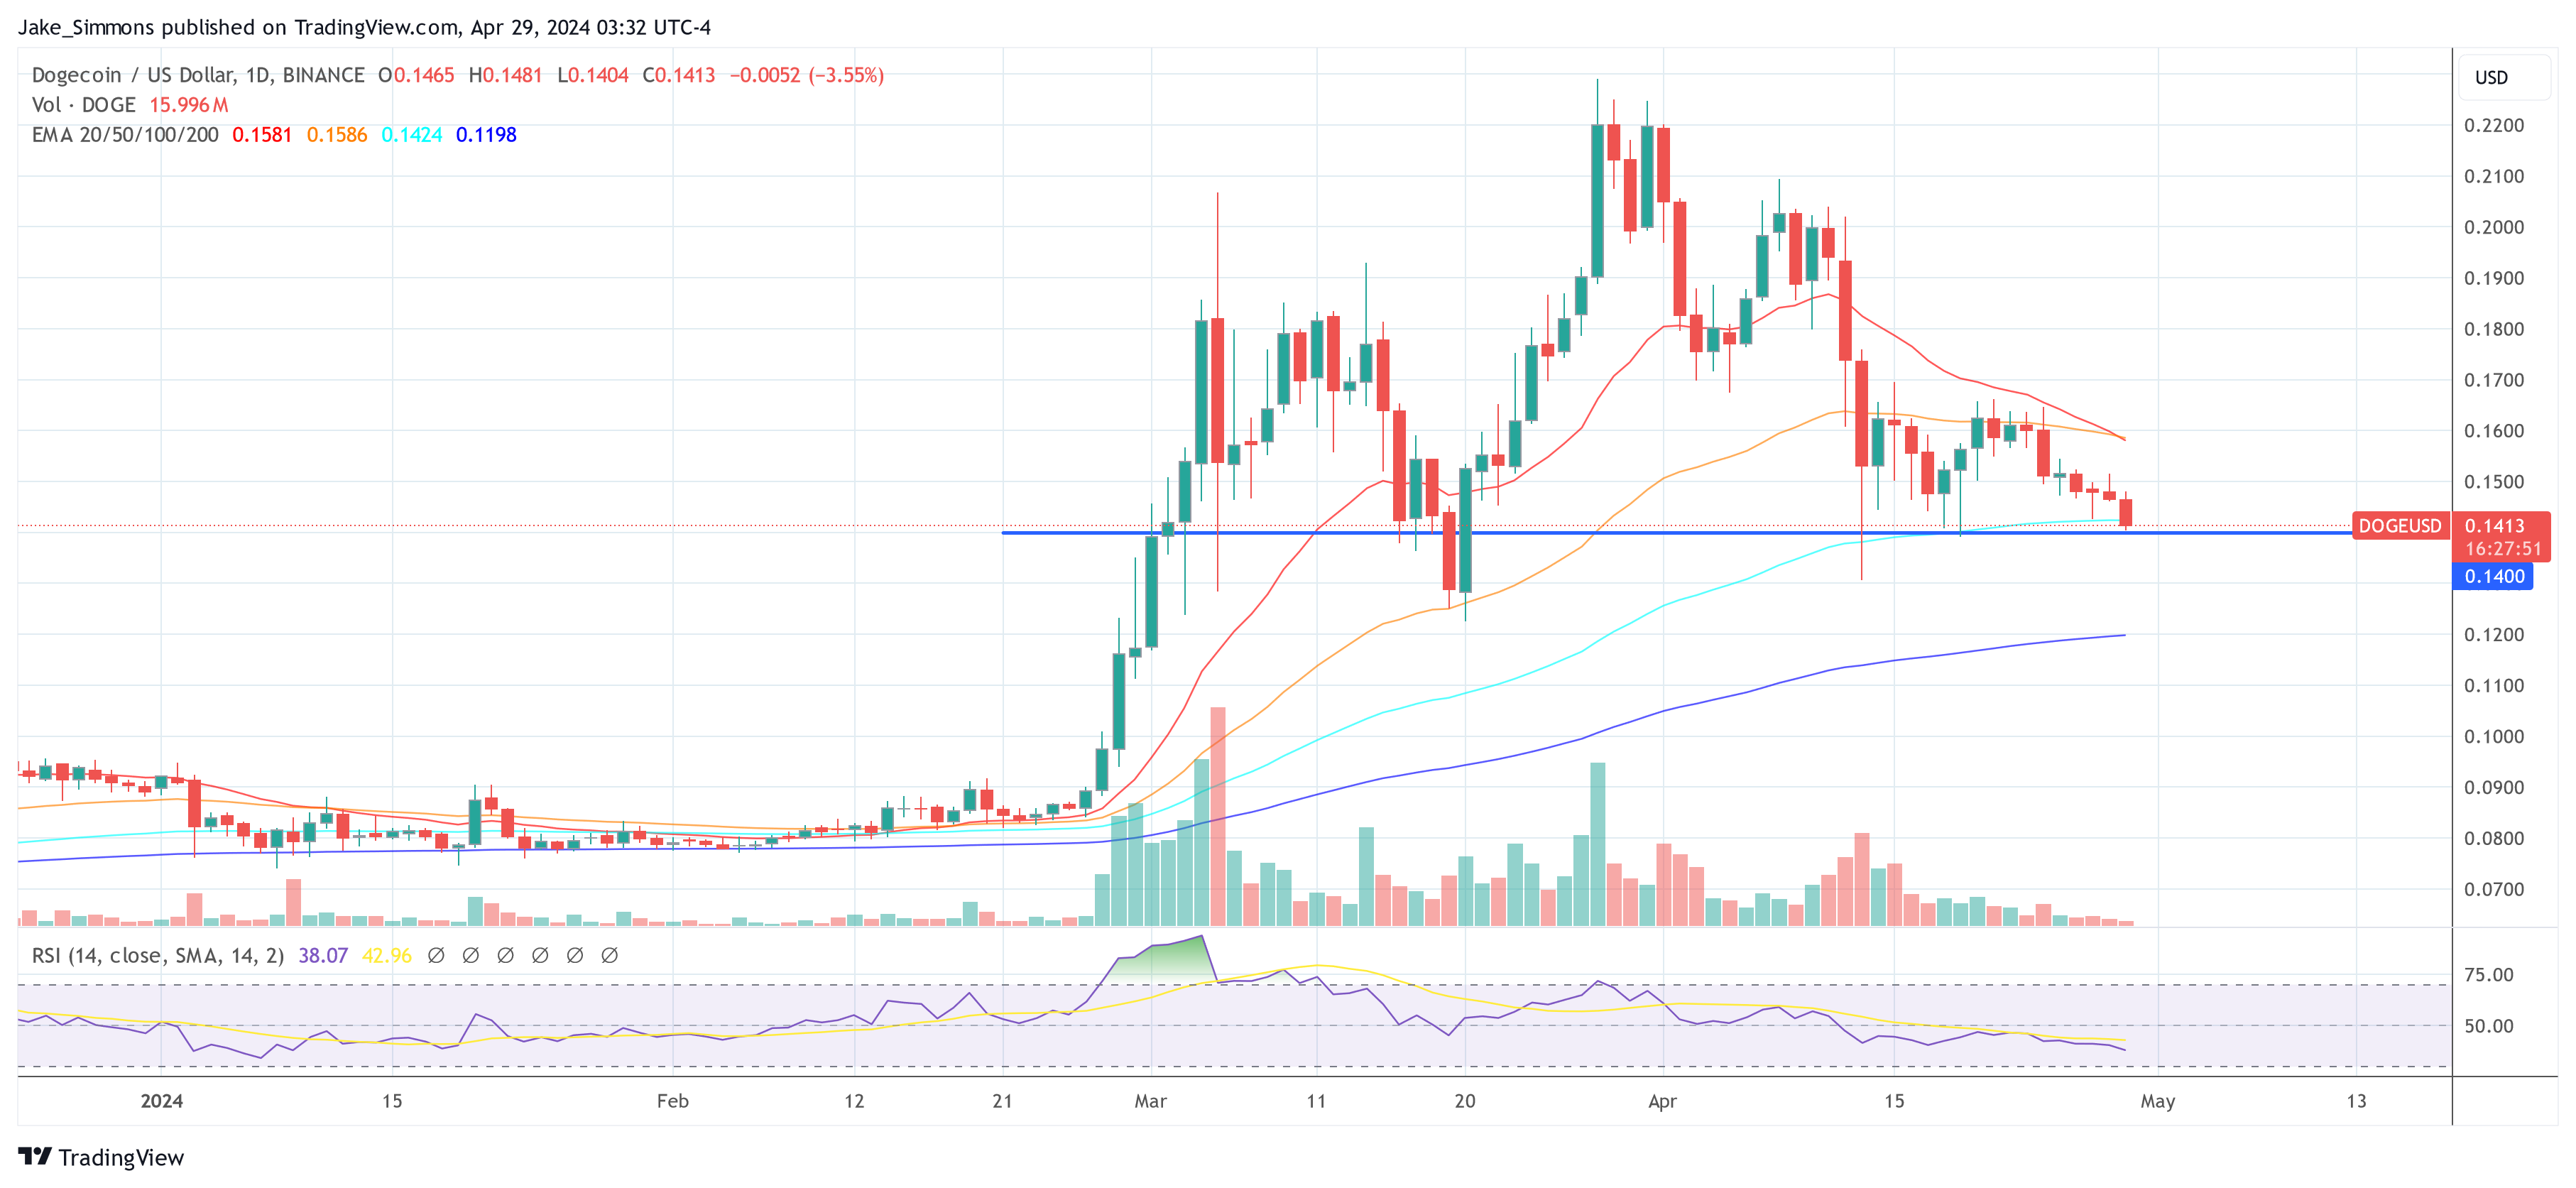
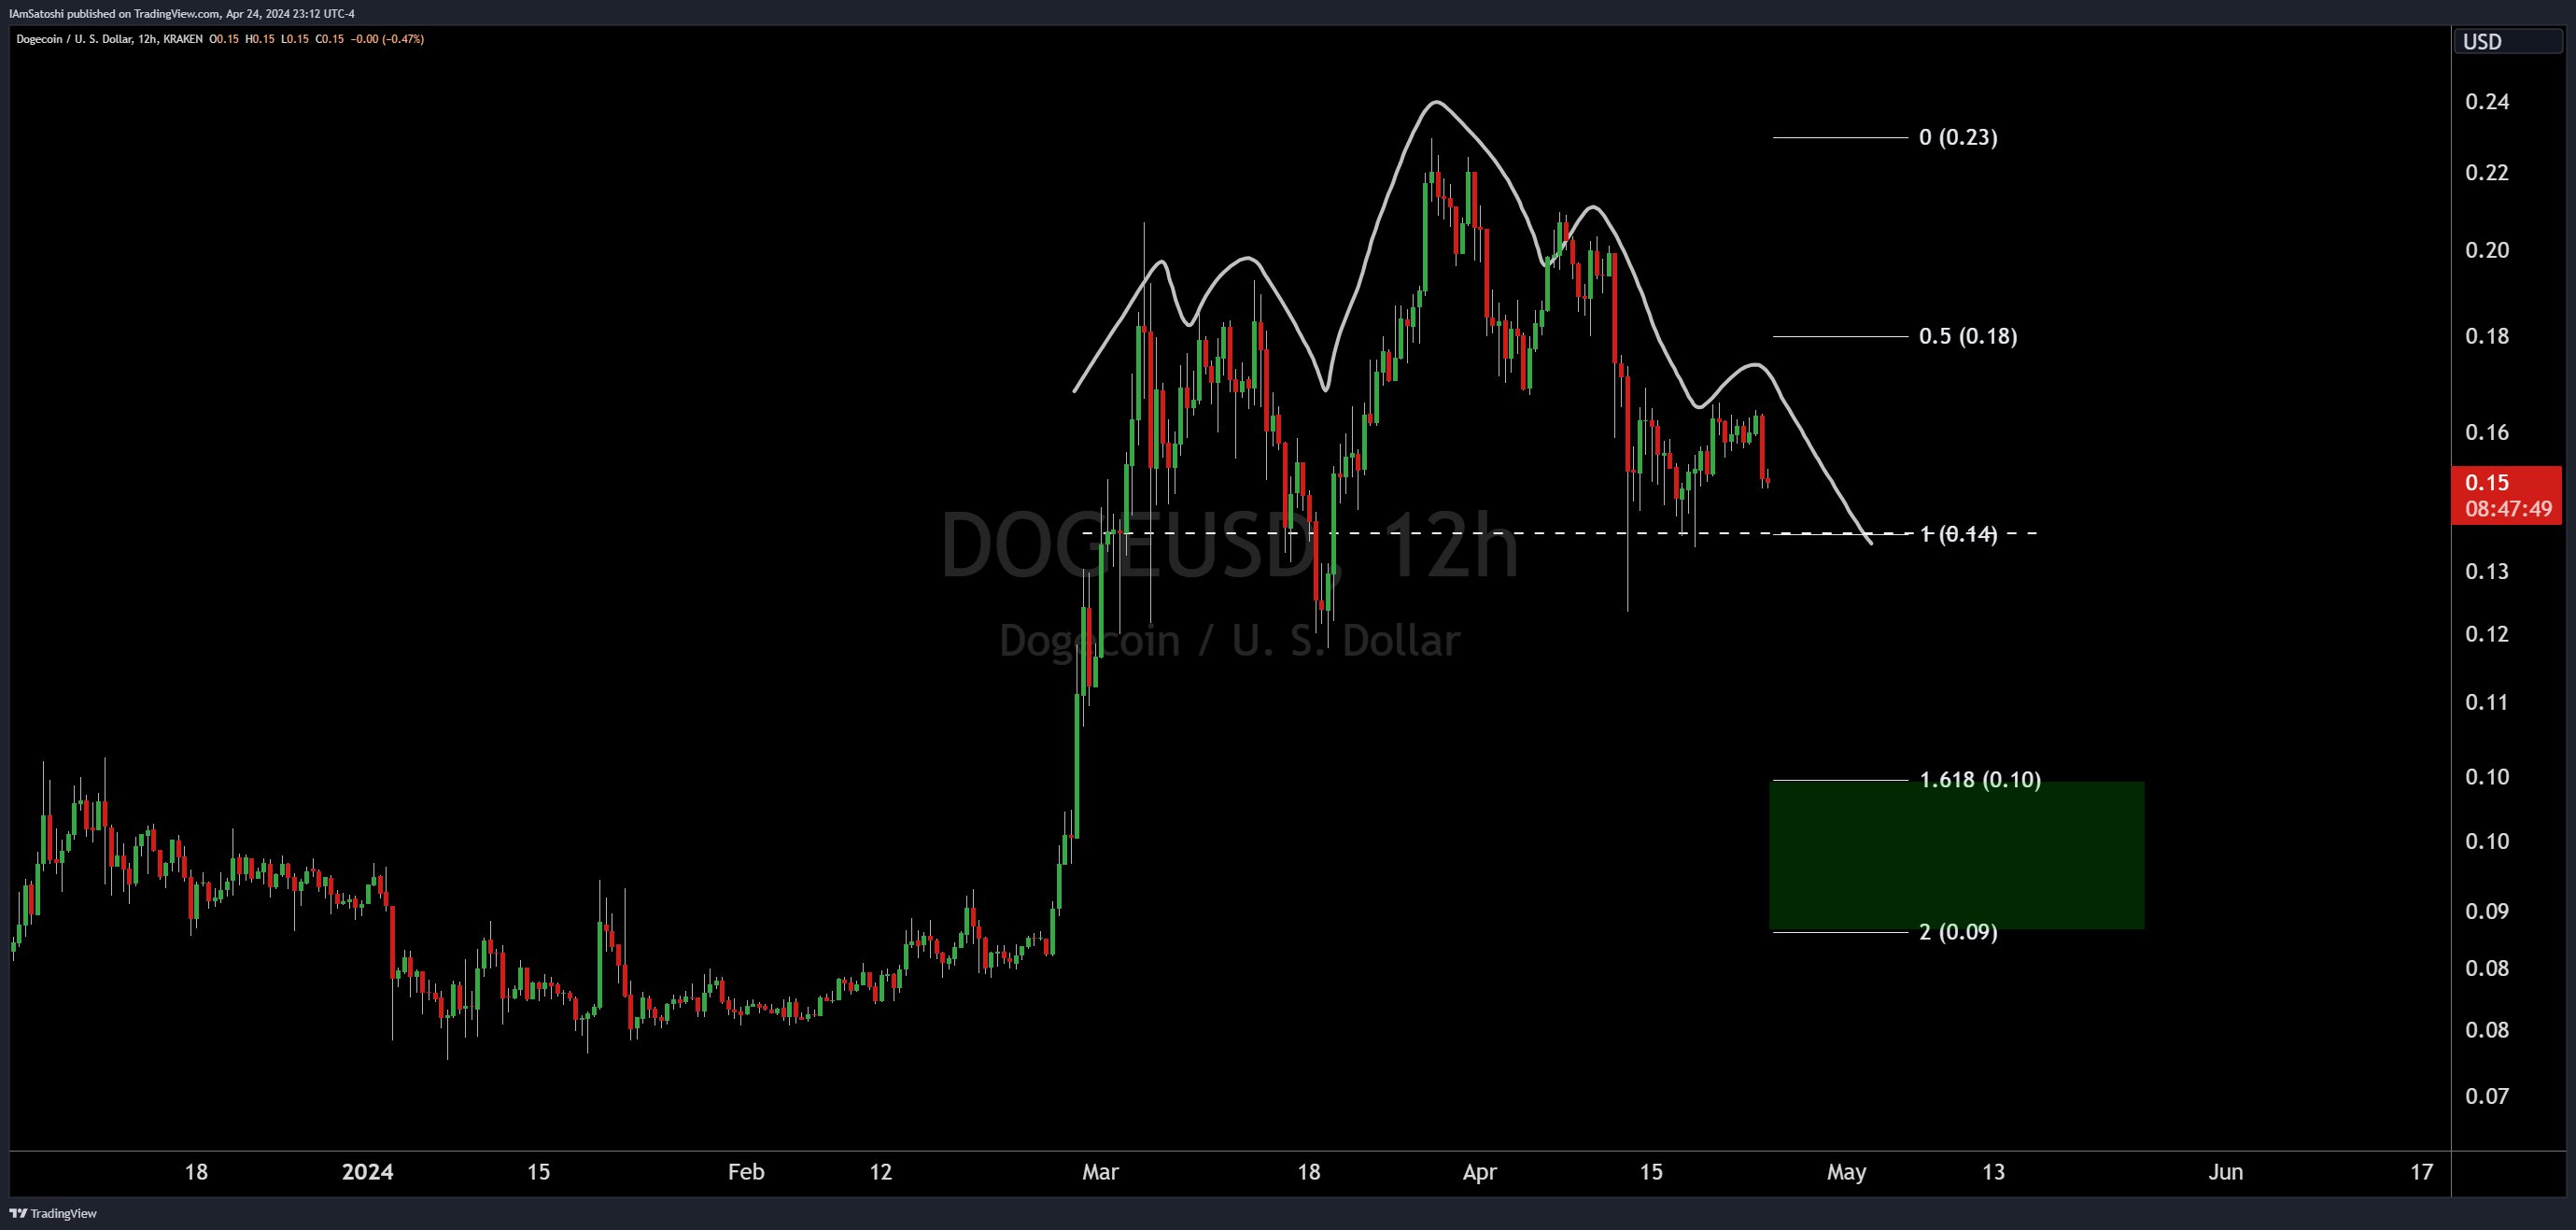
The Dogecoin price action seems to have turned bearish after a bearish close to April. Projections for the meme cryptocurrency are not bullish in the short term, especially considering the fact that it is now experiencing a 47% price correction from its highest point in the current market cycle. Despite its recent plunge, one analyst believes all is still well with Dogecoin, and the crypto asset is only gearing up for a bull run into new price territories. 

Dogecoin Repeating Behavior From Previous Bull Run

According to a recent analysis by popular crypto analyst Ali Martinez, Dogecoin’s current price action is setting up for a potential bull run, despite the cryptocurrency’s ongoing price correction. His analysis is based on interesting patterns on the Dogecoin price chart. 

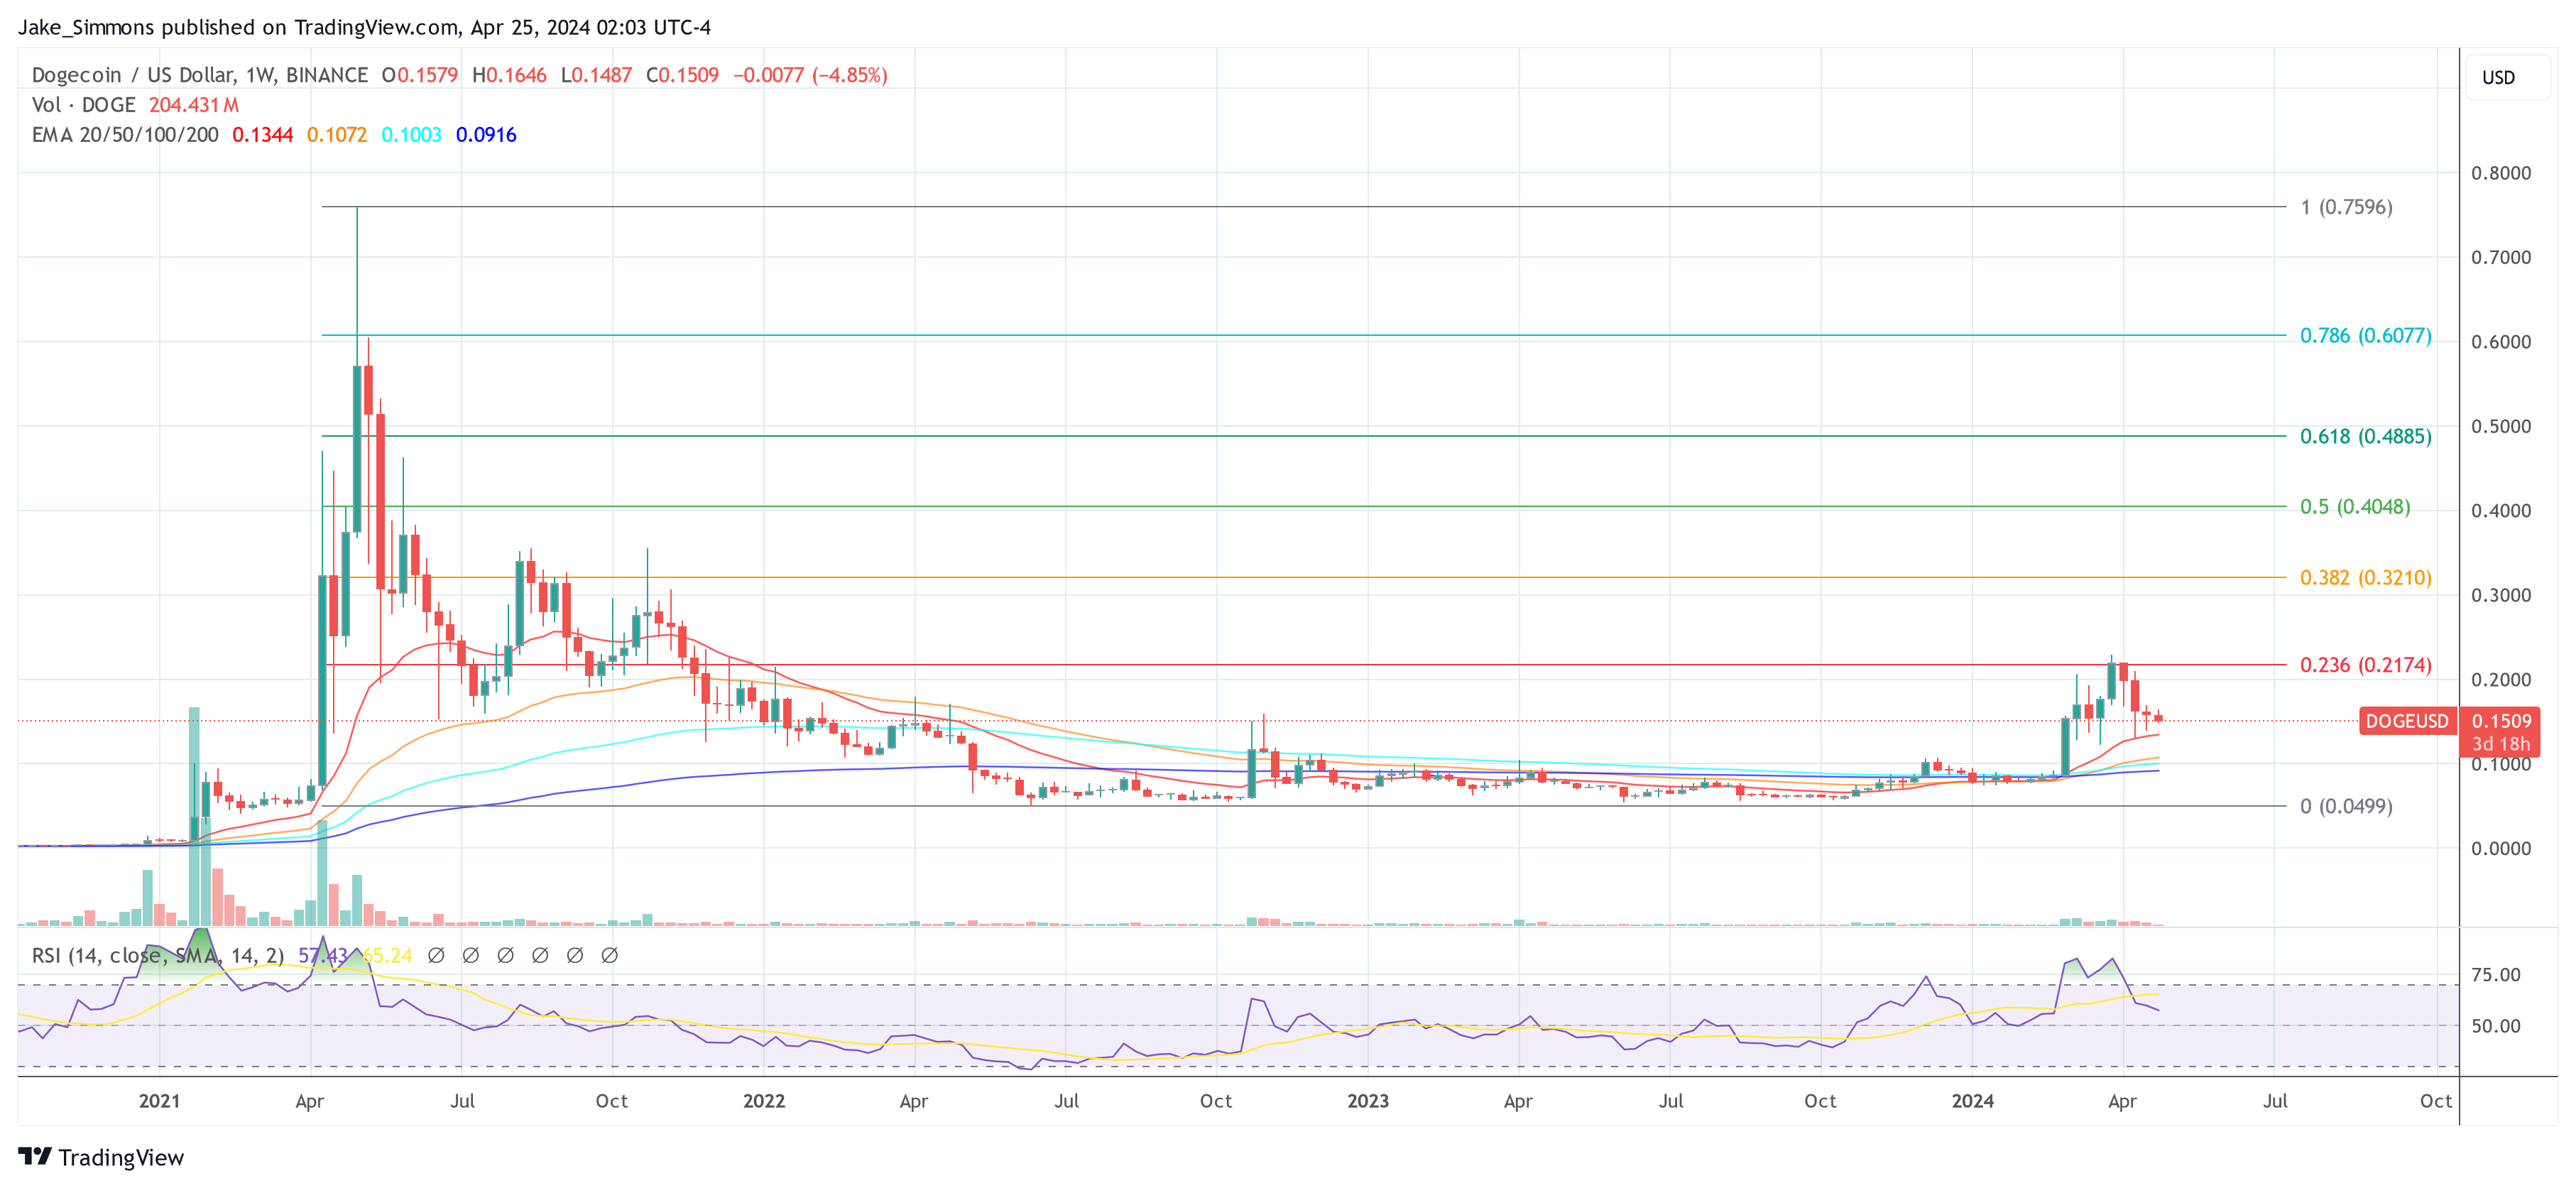
Although they are a very volatile asset class, patterns are an interesting way to predict the future movement of cryptocurrencies. Now, Dogecoin appears to be repeating some of the same patterns that led to its massive breakout in 2017 and 2021.

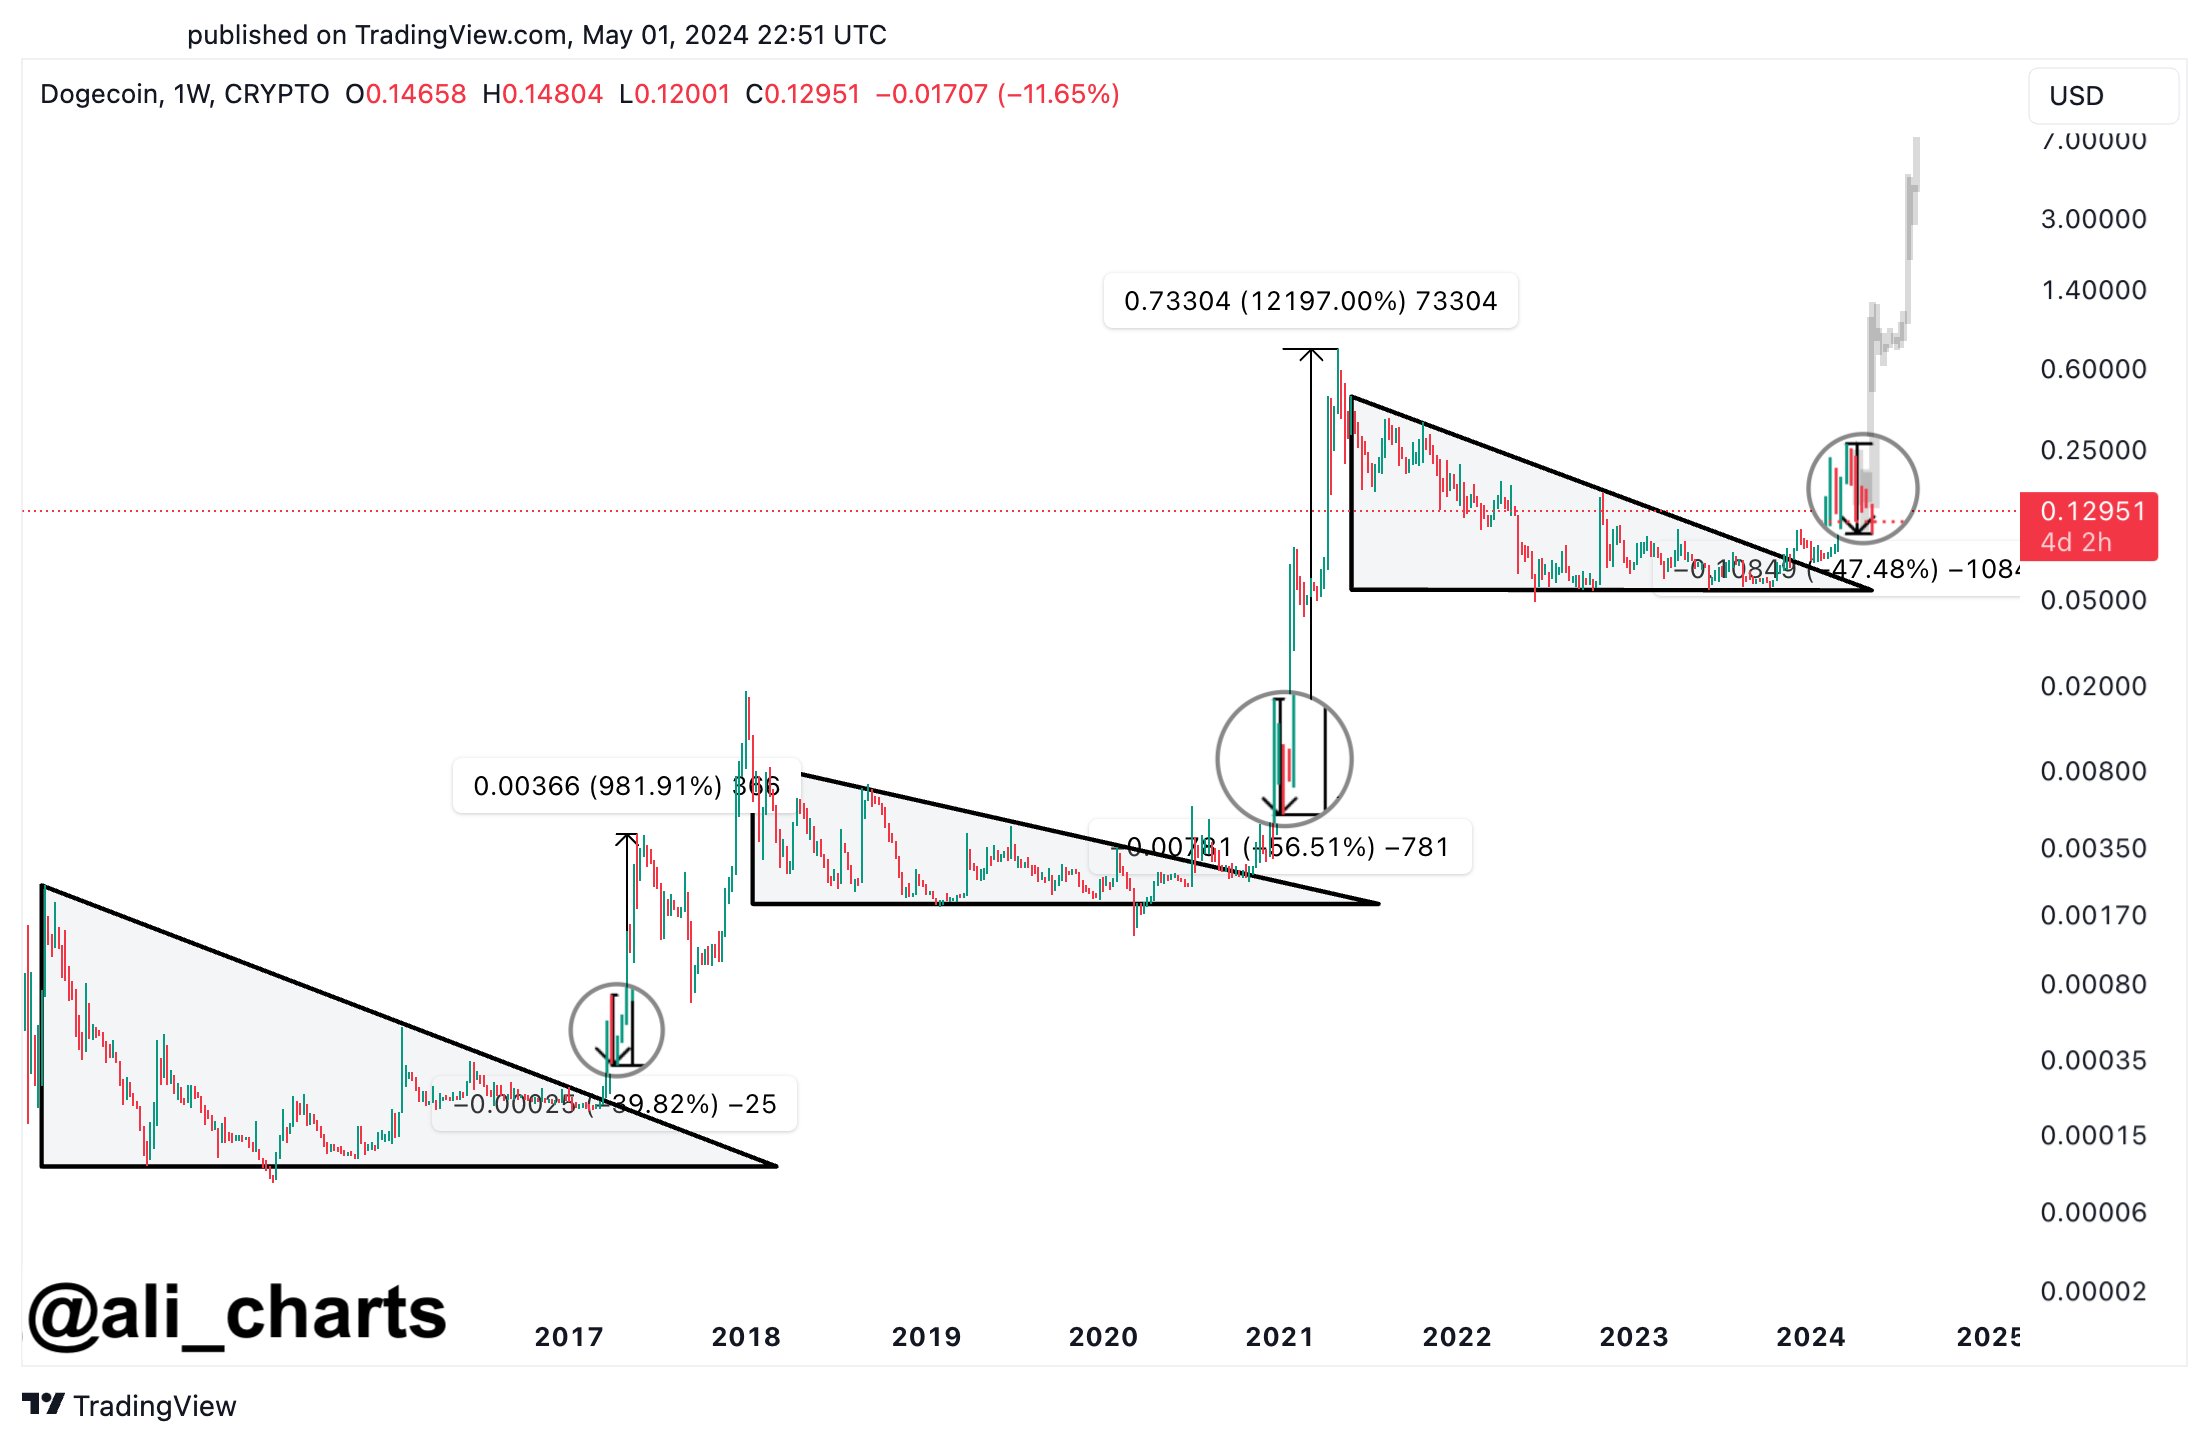
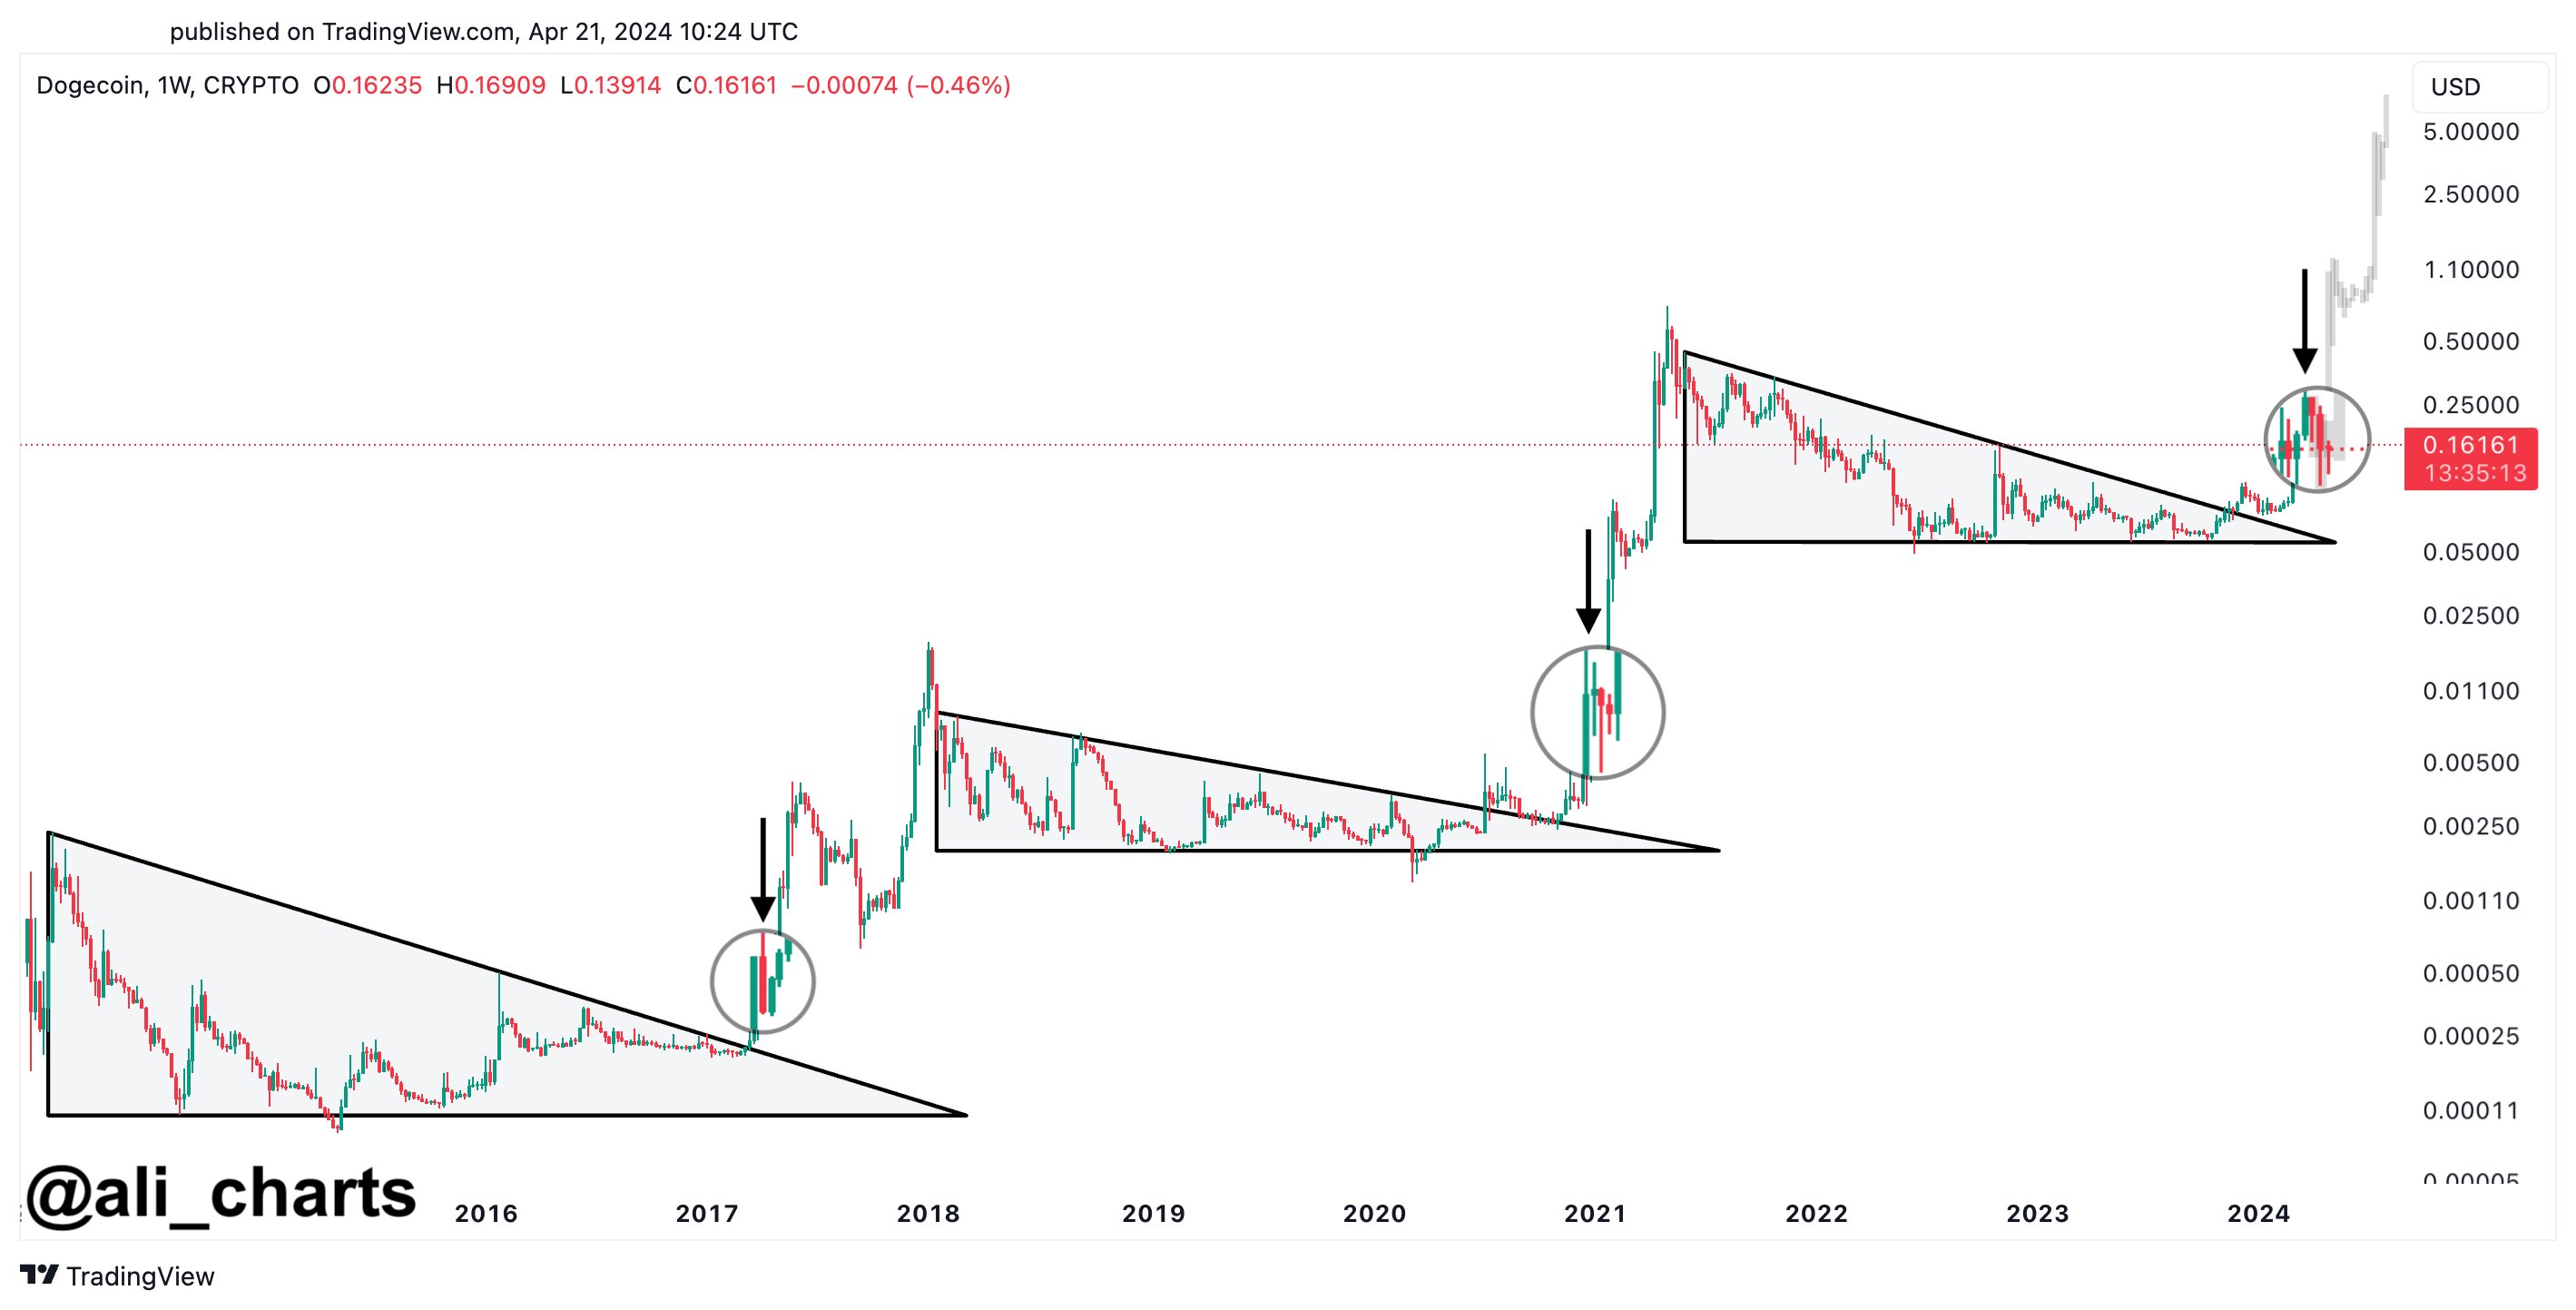
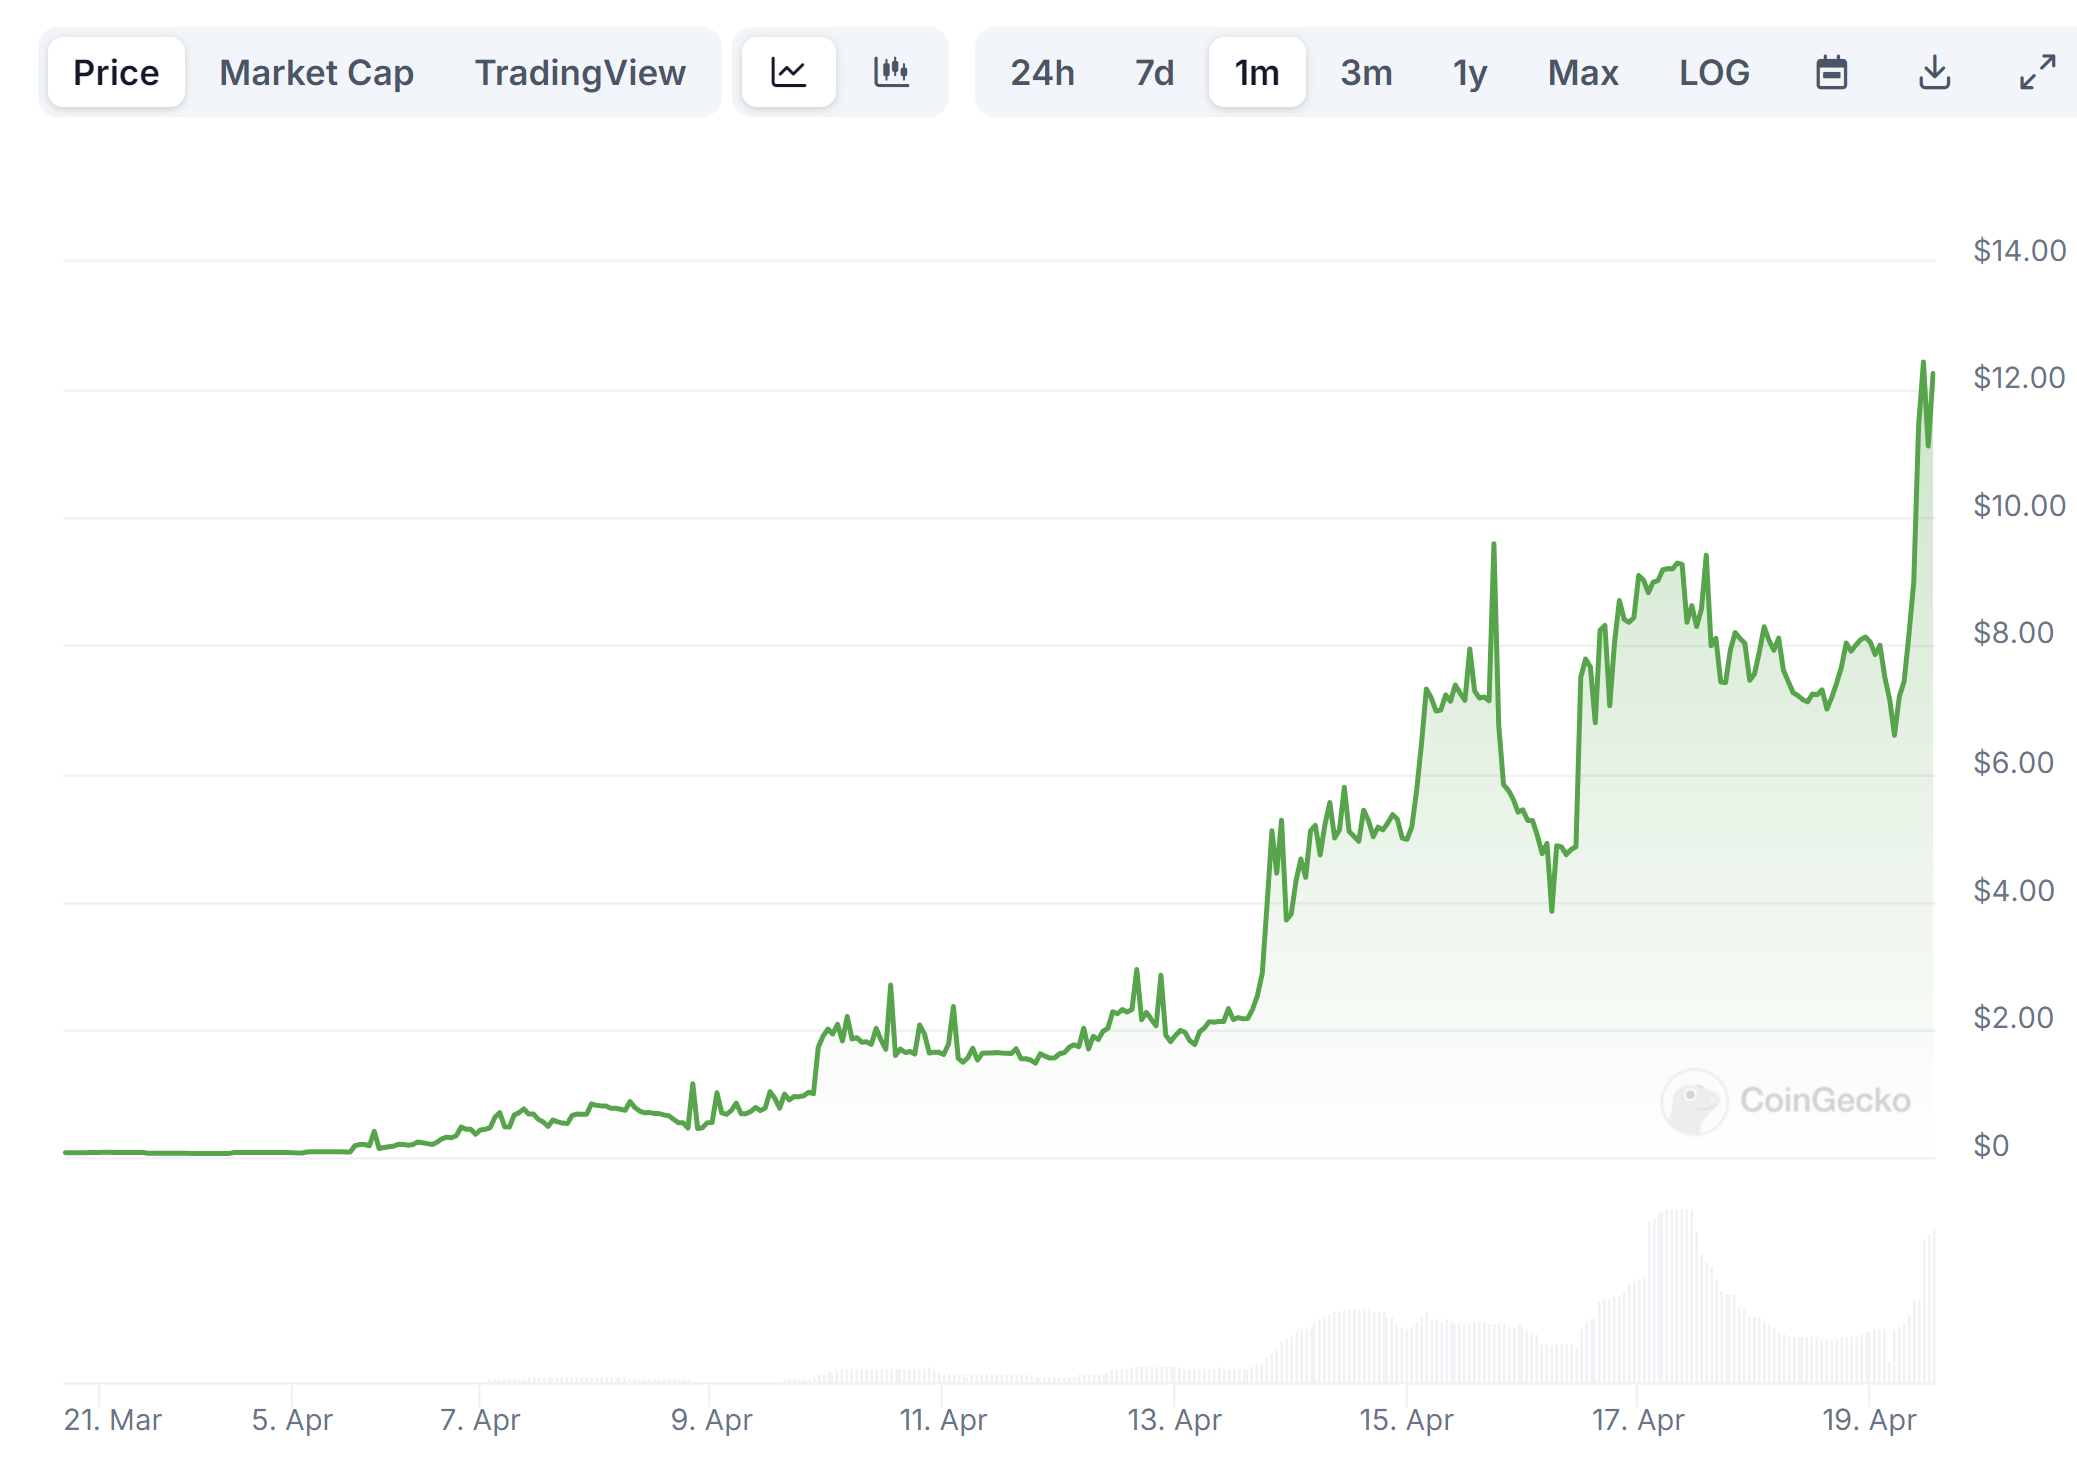
Specifically, Dogecoin broke out of a descending triangle pattern in the last quarter of 2023, a seemingly occurring trend and a first step for the cryptocurrency. As Martinez noted, the first time this breakout happened was in 2017. However, DOGE went on a 40% correction shortly after before resuming a 982% bull run. Again, a similar breakout of a descending triangle in 2021 saw the crypto retracing by 56% before skyrocketing by 12,197% to reach its current all-time high of $0.7316.

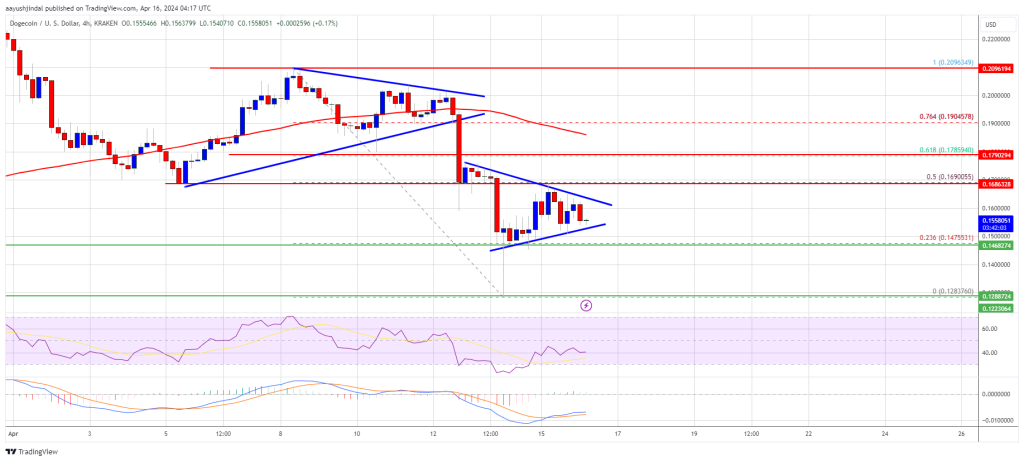
Now, the recent DOGE correction in the past month after breaking out of a descending triangle means the crypto could be gearing up for a similar bounce up. According to the DOGE price chart shared by Martinez, the first step is breaking above resistance at $0.224. If it can hurdle that level, it opens up a run back to the 2021 high and a push-up to a first target of around $1.2. 

Looking further out, Martinez’s chart shows an ultimate price surge above $6 in this bull cycle. For this to happen, Dogecoin would need to regain momentum and rally over 4,700% from current levels over the coming months. While this price point looks overachieving, Dogecoin has pulled off epic rallies before, surging over 12,000% at one point in 2021 alone.

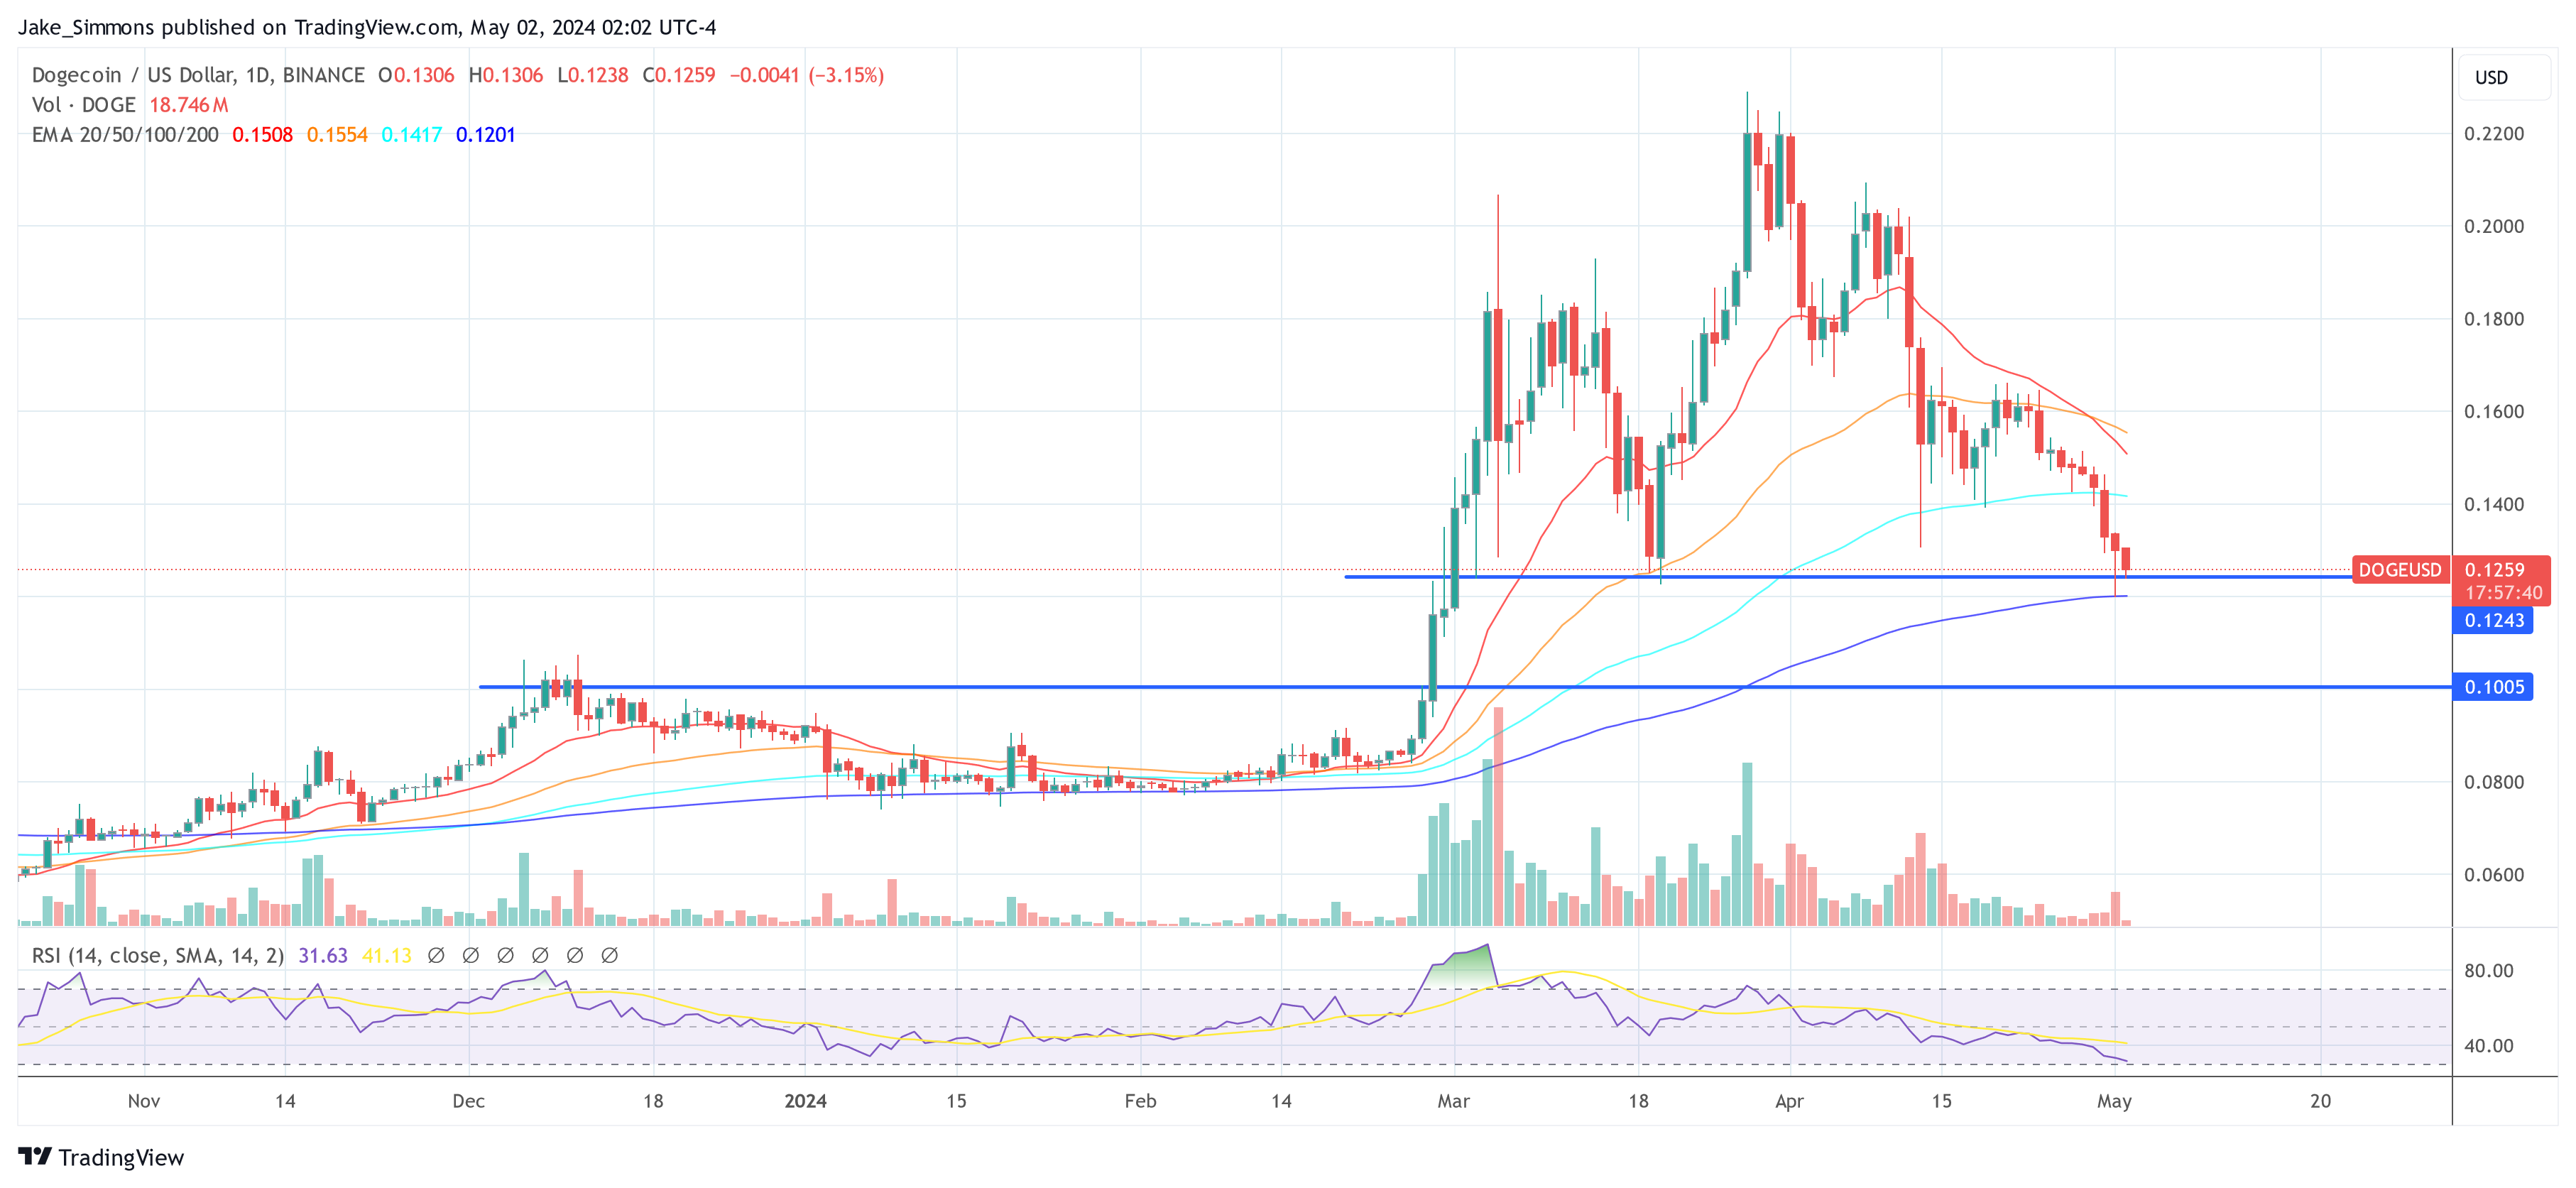
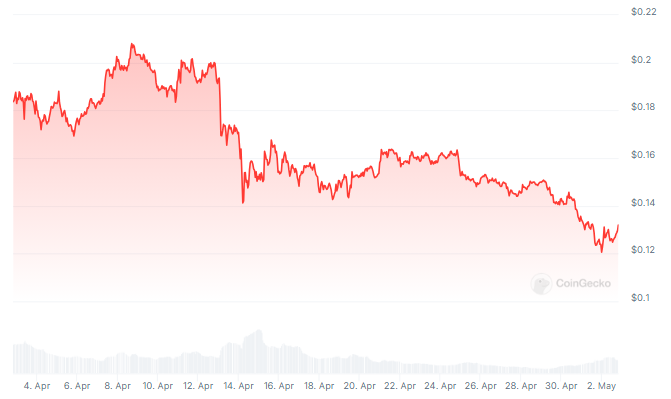
It has only been a few months into 2024 Dogecoin has already been on a wild ride this year along with the rest of the crypto market. At the time of writing, DOGE is trading at $0.125 and is down by 16.92% in the past seven days. Trading volume is up by 50% in the past 24 hours, which suggests a return of investor interest. 

Dogecoin price chart from Tradingview.com

Whales Dive In, But Dogecoin Price Sinks 20%: What’s Going On?

Dogecoin (DOGE), the Shiba Inu-faced darling of the 2021 memecoin frenzy, has found itself shivering in the current crypto winter. Once a symbol of retail investor exuberance, DOGE has plummeted over 70% from its sky-high peak, leaving its future shrouded in uncertainty.

DOGE Feels The Crypto Frost

While Bitcoin, the heavyweight champion of the crypto world, grabs headlines with its recent wobble, the impact on memecoins like DOGE has been brutal. Unlike Bitcoin’s divided analyst opinions, the sentiment surrounding DOGE is decidedly bearish.

At the time of writing, the memecoin was trading at $0.132, down 5.4% up the last 24 hours but sustained a 20% loss in the last seven days, data from Coingecko shows.

Is DOGE A Canary In The Crypto Coal Mine?

Some analysts believe DOGE’s struggles are a canary in the coal mine for the entire crypto market. They said if even a historically high-flying memecoin like Dogecoin can’t hold onto gains, it raises serious concerns about risk appetite in the crypto space in general.

Whales Accumulating DOGE: A Glimmer Of Hope?

However, a glimmer of hope flickers for the dethroned meme king. On-chain data suggests an increase in large wallet purchases of DOGE, hinting at potential accumulation by wealthy investors. This “contrarian” behavior could be a sign that some whales are using Coinglass or similar platforms to track Dogecoin derivatives and believe the coin is undervalued and ripe for a comeback.

Coinglass, a popular cryptocurrency data provider, offers insights into factors that might be influencing the whales’ decisions. By analyzing metrics like open interest, funding rates, and liquidations on Coinglass, these investors might see an opportunity to buy DOGE at a discount.

Related Reading: Solana Crawls: Network Update Fails To Fix Traffic Jam, Price Feels The Pinch

In a similar development, Whale Alert, a well-known blockchain tracker, has reported that a DOGE whale arranged two large transactions in a single day. Some 150,000,000 Dogecoins were transferred in the first transaction, and an additional 76,316,694 DOGE were transferred in the second, for a total of almost 226 million DOGE. At the time, the meme cryptocurrency was worth around $40 million in fiat money.

Can Dogecoin Thaw The Crypto Winter?

The coming weeks will be critical for DOGE. The return of positive social media sentiment, coupled with continued accumulation by whales who might be strategically using Coinglass for market analysis, could be the spark that reignites the DOGE rally. However, if the broader market weakness persists, DOGE’s summer might be spent shivering in the doghouse.

Featured image from Pixabay, chart from TradingView

Buy Dogecoin Now? Analyst Believes DOGE Is Primed For A Surge

In an analysis shared via X, crypto analyst Ali Martinez elaborated on the ongoing price correction of Dogecoin (DOGE), positing that it is a consistent precursor to major bull runs, drawing on historical patterns to forecast future price movements.

Martinez’s commentary centers on the chart pattern known as the “descending triangle.” This is a bearish formation that occurs when the price follows a downward trendline intersecting a flat support line. Typically, this pattern indicates a continuation of a downward trend, but in the context of Dogecoin, Martinez suggests it precedes significant bullish breakouts.

“The ongoing Dogecoin price correction is part of its usual behavior before massive bull runs! Let’s dive in,” Martinez shared. He explained the historical significance of this pattern in Dogecoin’s trading history: “In 2017, DOGE broke out of a descending triangle. Then, DOGE retraced by 40% before entering a 982% bull run!”

Martinez further analyzed more recent cycles to reinforce his observations, “In 2021, DOGE broke out of a descending triangle again. Then, DOGE retraced by 56% before skyrocketing by 12,197%!” According to Martinez, these retracements are not random but are characteristic of how Dogecoin has behaved in previous cycles, setting the stage for explosive gains.

The analyst drew parallels to the current market conditions: “Now, in 2024, DOGE has yet again broken out of a descending triangle! It is currently undergoing a 47% price correction, very similar to previous cycles, which could ignite the next DOGE bull run!” This assertion suggests that the current market downturn might be an opportune buying moment ahead of potential gains.

DOGE price analysis

Martinez’s analysis underscores the cyclical nature of Dogecoin’s price movements, suggesting a pattern of sharp declines followed by dramatic recoveries. “Over the years, Dogecoin appears to mirror its previous bull cycles! All you need is a little bit of patience,” he concluded.

Short-Term Dogecoin Price Analysis

Amidst this optimistic prediction, the Dogecoin price is in a precarious scenario in the short-term. Since mid-April, DOGE has experienced significant technical resistance. Particularly, the DOGE price was consistently rejected at the 50-day EMA over multiple instances, indicating strong selling pressure at higher price levels.

Amid a broader market downturn, the trajectory was accentuated when Dogecoin’s price broke below the crucial 100-day EMA. This level, often watched by traders for signs of medium-term market direction, had previously offered support. The breach underscores a weakening market sentiment and could signal extended losses.

Dogecoin price

As of press time, Dogecoin’s price hovered near $0.1259 after narrowly holding above the 200-day EMA yesterday, a key psychological and technical barrier. This moving average is now a pivotal point for Dogecoin; its sustained breach on the daily chart could significantly alter the market structure, potentially triggering a slide towards the $0.1005 support level.

The Relative Strength Index (RSI) is at 31.63, edging close to the oversold territory but not conclusively signaling an imminent reversal. This indicates that while the market is nearing oversold conditions, the selling pressure has not fully abated. One last leg down might be necessary to get DOGE into “oversold” territory in order to mark a local bottom.

DOGE Price Prediction – Dogecoin Reaches Make-or-Breaks Levels

Dogecoin extended losses and traded below the $0.1350 resistance zone against the US Dollar. DOGE is now testing an important support at $0.1200.

  • DOGE gained bearish momentum below the $0.140 and $0.1350 levels against the US dollar.
  • The price is trading below the $0.1350 level and the 100 simple moving average (4 hours).
  • There is a major bearish trend line forming with resistance at $0.1350 on the 4-hour chart of the DOGE/USD pair (data source from Kraken).
  • The price must settle above $0.1420 to move into a positive zone and start a fresh surge.

Dogecoin Price Extends Losses

After a close below $0.150, Dogecoin price extended losses and moved into a short-term bearish zone, like Bitcoin and Ethereum. There was a drop below the $0.1350 support zone.

A low was formed at $0.1201 and DOGE is now consolidating losses. There was a minor recovery wave above the $0.1250 level. The price tested the 23.6% Fib retracement level of the downward move from the $0.1640 swing high to the $0.1201 low.

However, the bears protected more gains above the $0.130 resistance. Dogecoin is also below the $0.1420 level and the 100 simple moving average (4 hours). On the upside, the price is facing resistance near the $0.130 level.

DOGE Price Prediction

Source: DOGEUSD on TradingView.com

The next major resistance is near the $0.1350 level. There is also a major bearish trend line forming with resistance at $0.1350 on the 4-hour chart of the DOGE/USD pair. The main hurdle is at $0.1420. A close above the $0.1420 resistance and the 50% Fib retracement level of the downward move from the $0.1640 swing high to the $0.1201 low might send the price toward the $0.1550 resistance. Any more gains might send the price toward the $0.1620 level.

More Losses in DOGE?

If DOGE’s price fails to gain pace above the $0.1350 level, it could start another decline. Initial support on the downside is near the $0.1220 level.

The next major support is near the $0.120 level. If there is a downside break below the $0.120 support, the price could decline further. In the stated case, the price might decline toward the $0.1040 level.

Technical Indicators

4 Hours MACD – The MACD for DOGE/USD is now gaining momentum in the bearish zone.

4 Hours RSI (Relative Strength Index) – The RSI for DOGE/USD is now below the 50 level.

Major Support Levels – $0.1240, $0.1200 and $0.1040.

Major Resistance Levels – $0.1300, $0.1350, and $0.1420.

Machine Learning Algorithm Predicts Dogecoin Price For May 2024

As April comes to a bearish close, expectations for Dogecoin in May are not exactly bullish, especially as the crypto market has continued to fall. DOGE has been one of the main losers during this time, falling below $0.14. This underperformance is expected to continue as the machine learning algorithm at CoinCodex predicts further decline for the meme coin.

Algorithm Predicts Another 13% Decline

Despite the Dogecoin price already suffering a notable 14% decline in the last week, the machine learning algorithm believes it will fall another 13% in the month of May. The machine learning algorithm, which takes a number of metrics into consideration, presented that the DOGE price remains very bearish despite the market still sitting in greed.

For the month of May, the algorithm expects the meme coin’s price to decline by a total of 13.66% from here, falling below $0.13 to $0.1238. Even on the shorter term, the Dogecoin price remains bearish with an expected 1% decline to $0.14 in the next five days.

On the broader timeframe, expectations for the meme coin are not high as the machine learning algorithm does not expect the cryptocurrency to reach a new all-time high until 2029. For the year 2025, it gives the meme coin a yearly high of over $0.66, which is less than its current all-time high price of $0.7.

The next two years after this are expected to be bearish as the price is predicted to fluctuate around $0.126 and $0.25. Then, a new all-time high price of $1.4 is expected. If this plays out, then it would mean that Dogecoin investors would have to wait another five years to see new peaks.

Dogecoin Metrics Tell A Different Story

While the machine learning algorithm remains bearish, the Dogecoin metrics have been painting a picture of bullishness. For example, there has been a steady increase in the Dogecoin trading volume, rising 28% in the last day alone. This suggests a return of investor interest and if it translates into demand, it could see the price rise rapidly from here.

There has also been an accumulation trend for the meme coin, especially among whales. One whale, in particular, withdrew 226 million DOGE from the Robinhood exchange in two transactions. Usually, when investors move coins from exchanges to private wallets, it means they are accumulating for better prices. This could signal a turn in the tide.

However, at the time of writing, the Dogecoin price is still struggling at $0.135, with a 4% drop in the last 24 hours. A reversal from here could see DOGE retest the $0.15 resistance. But a breakdown could send it back toward $0.12.

Dogecoin price chart from Tradingview.com

Bitcoin Dominance: Traders Preferring The OG To Dogecoin & Other Altcoins

On-chain data suggests Bitcoin has recently experienced an influx of investors while Dogecoin, Cardano, and other altcoins have seen a slowdown.

Bitcoin Total Amount Of Holders Rise While Altcoins See Flat Movement

According to data from the on-chain analytics firm Santiment, the number of Bitcoin investors has sharply increased recently. The on-chain metric of interest here is the “Total Amount of Holders,” which keeps track of the total number of addresses on a given network carrying some non-zero balance.

When the value of this indicator goes up for any asset, it can be due to several things. The first and most obvious contributor to this trend would be adoption, as a fresh influx of users would naturally create more addresses.

Another contributor could be old investors returning to reinvest in the coin after selling out their balance earlier. The indicator would also increase when investors spread out their holdings among multiple wallets for reasons like privacy.

In general, some net adoption occurs whenever the Total Amount of Holders goes up. Historically, adoption has been a constructive sign for any blockchain in the long term.

Naturally, when this metric’s value goes down, it implies that some investors have decided to exit from the cryptocurrency as they have completely cleaned out their wallets.

Now, here is a chart that shows the trend in the Total Amount of Holders for some of the top assets in the sector: Bitcoin (BTC), Ethereum (ETH), XRP (XRP), Cardano (ADA), Dogecoin (DOGE), and Chainlink (LINK).

Bitcoin Total Amount of Holders Vs Dogecoin

As displayed in the graph, Dogecoin started 2024 with some rapid adoption as its Total Amount of Holders had been observing a sharp uptrend. However, this growth only lasted for the first couple of months, as the metric has since flattened for the memecoin.

Other altcoins like Chainlink and Cardano have also witnessed flat action in the metric in this period. The trend had been just the opposite for Bitcoin, where more or less flat movement had occurred in its number of investors earlier in the year, but the asset has seen some uptrend in the metric this month.

It’s possible that investors were previously attracted to Dogecoin and other networks, but now that markets have been undergoing bearish price action, traders are back to preferring the original cryptocurrency.

Overall, DOGE’s holders are still up 13.8% in the past three months, while BTC’s growth stands at 2.6%. Naturally, the latter’s userbase is also larger, so a relatively small percentage could be due to that.

Cardano is among the few networks in the sector that have observed negative action in the Total Amount of Holders during this window, although the decrease is a mere 0.1%.

BTC Price

Bitcoin has been struggling to make any recovery run count recently, as its price is back at $63,000 after the latest failed attempt.

Bitcoin Price Chart

Alarm Bells Ring For Dogecoin: Bearish Signal Points To 40% Crash

Crypto analyst Josh Olszewicz is once again warning of a looming Dogecoin price crash. The analysis hinges on the Ichimoku Cloud, a comprehensive indicator that provides information on support/resistance levels, momentum, and trend direction. Olszewicz’s analysis points to two specific technical phenomena on the 1-day (1D) chart of DOGE against the US dollar (DOGE/USD). Via X, he remarked “1D DOGE: bearish TK cross + bearish Kumo breakout.

Bearish Signals For Dogecoin

The bearish TK cross refers to the bearish crossover between the Tenkan-Sen (conversion line) and the Kijun-Sen (baseline) within the Ichimoku Cloud system.

Dogecoin price analysis

The Tenkan-Sen, which is a faster-moving line typically calculated as the midpoint of the highest high and lowest low over the last nine periods, crossing below the Kijun-Sen, a slower line computed as the midpoint of the highest high and the lowest low over the past 26 periods, is considered a bearish signal.

It suggests that short-term prices are falling below the base level of prices over the last month, indicating potential further downward movement.

The Bearish Kumo breakout: The ‘Kumo’, which translates to ‘cloud’, is part of the Ichimoku Cloud indicator and is formed between two other lines: the Senkou Span A and the Senkou Span B. It represents a key area on the chart that can act as support or resistance.

In the context of Olszewicz’s analysis, a ‘bearish Kumo breakout’ implies that the price has broken through the cloud downwards. This breakout is seen as a confirmation of a bearish trend. The fact that the price is below the Kumo suggests that the overall market sentiment for DOGE is negative, with the Kumo now likely acting as resistance to any upward price movement.

The chart by Olszewicz shows DOGE trading at $0.15 with the cloud plotted behind the price action, appearing green above and red below the price lines. The cloud turning green represents a bullish future potential, but the price below both the cloud and the Tenkan-Sen/Kijun-Sen crossover indicates bearish current circumstances.

A 40% Price Crash Looming?

This gives weight to Olszewicz previous DOGE price analysis. As NewsBTC reported, the crypto analyst warned of a potential Head and Shoulders (H&S) formation on the DOGE/USD 12-hour chart which could be validated soon.

The formation is characterized by two shoulders flanking a distinctive head, with the neckline at approximately $0.14 being pivotal. Should Dogecoin’s price break below this critical support, the prophecy of the H&S pattern would likely manifest, potentially triggering a sell-off towards the $0.10 to $0.09 region.

This target area aligns with the 1.618 and 2.0 Fibonacci extension levels, suggesting a price crash of around 40% from the neckline. While the pattern has not yet been confirmed, with the price still above the crucial $0.14 support level, its presence serves as a cautionary signal to the market.

The technical confluence of the bearish TK cross and the bearish Kumo breakout in Olszewicz’s recent analysis only reinforces the possible bearish scenario that lies ahead for Dogecoin. Market participants are recommended to keep a close watch on the $0.14 level, as a decisive break below could validate the bearish outlook and set the stage for the anticipated decline.

At press time, DOGE traded at $0.1413.

Dogecoin price

Brace For Price Impact: Dogecoin Whales Move Massive 456 Million DOGE To Exchanges

Recent on-chain data has shown a transfer of 456 million DOGE tokens into crypto exchange Coinbase amidst a flurry of Dogecoin whale transactions across various exchanges in the past 24 hours. The price of DOGE has majorly traded below the $0.165 price level in the past seven days despite the price uptick among other meme coins. These recent events of whale transfers, however, appear to be leading to a bearish view towards DOGE. Transfers of this nature into a crypto exchange point to the whales getting ready to sell off their bags, which risks crashing the DOGE price. 

Whales Move 456 Million DOGE To Crypto Exchange

Whale Alerts, a crypto whale transaction tracker, has shown various instances of whale transactions in recent hours. Amidst these transactions is the transfer of 456.83 million DOGE tokens worth $68.7 million into popular crypto exchange Coinbase. Interestingly, the transfer of DOGE was made to Coinbase in two bouts of 228 million DOGE, each worth over $34 million.

Related Reading: Renowned Economist Reveals What Will Happen If Bitcoin Can’t Hold $60,000

However, considering these transactions were sent in quick succession, the nature of their movement points to them being controlled by the same whale entity. 

A further look into the two whale addresses involved, “DFBx6m” and “DCTpBb”, showed that they no longer hold any tokens at the time of writing. This lends additional credibility to the idea that the transfers were made with the intention of selling off tokens.

Notably, on-chain data shows that both addresses have been holding their DOGE tokens since last year, considering the last inflow of DOGE occurred on November 1, 2023. During this time, the price of Dogecoin was trading around $0.068. It is worth noting that DOGE has gone on an over 120% price increase since then, putting the holdings at a significant profit.

What’s Next For Dogecoin?

At the time of writing, DOGE is trading at $0.1511. The crypto is now on a correction path after failing to substantially break above $0.164 in the past week. The recent movement of nearly half a billion Dogecoin suggests major price volatility could be on the horizon. Furthermore, the recent DOGE rally seems to have stalled out as other altcoins and meme coins gain momentum.

While DOGE is currently down by 0.64% in the past seven days, Shiba Inu, PEPE, Dogwifhat, and FLOKI are up by 13.8%, 47.5%, and 32.5% in the same timeframe. 

The future of DOGE can be hard to predict. As with any meme coin, Dogecoin remains highly speculative. Its price continues to be volatile and heavily influenced by hype and social media. According to a crypto analyst, DOGE could continue to drop in the short term. Other analysts are bullish on DOGE, with analyst Ali Martinez even predicting a rally to the $1 price mark. 

Dogecoin price chart from Tradingview.com

DOGE Price Prediction – Dogecoin Below $0.14 Could Spark Larger Degree Drop

Dogecoin is struggling to rise above the $0.1650 resistance zone against the US Dollar. DOGE could decline heavily if it settles below the $0.140 support.

  • DOGE is facing many hurdles near the $0.1650 and $0.170 levels against the US dollar.
  • The price is trading below the $0.1620 level and the 100 simple moving average (4 hours).
  • There is a major bearish trend line forming with resistance at $0.1620 on the 4-hour chart of the DOGE/USD pair (data source from Kraken).
  • The price must settle above $0.170 to move into a positive zone and start a fresh surge.

Dogecoin Price Signals Downturn

After a major decline, Dogecoin price started a recovery wave from the $0.1280 zone. A low was formed at $0.1283 and DOGE climbed above $0.1350, like Bitcoin and Ethereum.

There was a move above the $0.1385 and $0.140 resistance levels. The price climbed above the 23.6% Fib retracement level of the downward move from the $0.2092 swing high to the $0.1283 low. However, the bears protected more gains above the $0.170 resistance.

The price failed to test the 50% Fib retracement level of the downward move from the $0.2092 swing high to the $0.1283 low. There is also a major bearish trend line forming with resistance at $0.1620 on the 4-hour chart of the DOGE/USD pair.

Dogecoin is also below the $0.160 level and the 100 simple moving average (4 hours). On the upside, the price is facing resistance near the $0.160 level.

DOGE Price Prediction

Source: DOGEUSD on TradingView.com

The next major resistance is near the $0.1680 level. The main hurdle is at $0.170. A close above the $0.170 resistance might send the price toward the $0.1850 resistance. Any more gains might send the price toward the $0.20 level.

More Losses in DOGE?

If DOGE’s price fails to gain pace above the $0.160 level, it could start another decline. Initial support on the downside is near the $0.1475 level.

The next major support is near the $0.1400 level. If there is a downside break below the $0.1400 support, the price could decline further. In the stated case, the price might decline toward the $0.120 level.

Technical Indicators

4 Hours MACD – The MACD for DOGE/USD is now gaining momentum in the bearish zone.

4 Hours RSI (Relative Strength Index) – The RSI for DOGE/USD is now below the 50 level.

Major Support Levels – $0.1475, $0.1400 and $0.1200.

Major Resistance Levels – $0.1600, $0.1680, and $0.1700.

Why Is The Dogecoin Price Down Today?

Dogecoin (DOGE), the foremost meme coin, is down over 6% in the last 24 hours according to data from CoinMarketCap. This downtrend can be attributed to the price movement of the flagship crypto, Bitcoin. 

Dogecoin Drops Alongside Bitcoin

Dogecoin’s price also experienced a sharp decline as the flagship crypto dropped from over $66,000 to below $64,000 in the last 24 hours. Altcoins like DOGE are known to experience a similar downtrend whenever Bitcoin’s price records a correction like the way it has done. Generally, the global crypto market is down over 4%, thanks to this occurrence. 

Several factors are believed to have contributed to Bitcoin’s recent decline (and, by extension, Dogecoin and other altcoins). One is the upcoming release of the Personal Consumption Expenditures (PCE) inflation data on April 26. Despite estimates from the Cleveland Fed, predicting that the PCE data will show that inflation has slowed, crypto investors are still wary, given that the March Consumer Price Index (CPI) data didn’t show any disinflationary progress. 

Crypto investors are also still apprehensive about the conflict in the Middle East. Although tensions between Israel and Iran seem to have subsided, there is still the belief that things could quickly get heated again. The impact this geopolitical conflict has on the crypto market has become evident, and investors want to avoid getting burned again. 

Meanwhile, the Spot Bitcoin ETFs, which now significantly impact the crypto market, have seen their inflows slow this month. The demand for these investment funds has drastically dropped, contributing to the unimpressive price action among crypto tokens like Dogecoin, given the amount of liquidity they brought into the market at their peak. 

Interestingly, the world’s largest asset manager, BlackRock, recorded zero daily inflows into its iShares Bitcoin Trust (IBIT) for the first time on April 24, further underscoring how bad things have become. 

DOGE Still Expected To Experience Further Price Declines

Based on crypto analyst CrediBULL Crypto’s recent analysis, the foremost meme coin is still expected to experience further price declines even when the crypto market picks up again. The analyst mentioned that the crypto market is getting to the point where liquidity in memes like Dogecoin and other altcoins will get sucked by Bitcoin as it makes its move to $100,000

The crypto analyst predicts that Dogecoin could drop to as low as $0.5 when this happens, suggesting there wouldn’t be enough liquidity for the meme coin to maintain any uptrend. However, crypto analyst Kevin (formerly OG Yomi) offered a different opinion, noting that nothing on the monthly time frame suggests Dogecoin will drop to as low as $0.5.

Dogecoin price chart from Tradingview.com

Head And Shoulders Alert: Dogecoin Could See A Price Crash Soon

Crypto analysts are sounding the alarm on Dogecoin as a classic chart pattern, known for predicting bearish trends, has emerged. Technical analyst Josh Olszewicz, @CarpeNoctom, flagged a potential Head and Shoulders (H&S) formation on the DOGE/USD 12-hour chart on X, hinting at a possible significant price drop if the pattern validates.

The H&S pattern is a technical indicator traditionally viewed as a bearish signal within the trading community. The pattern is composed of three peaks, with the central peak (the head) being the highest and the two outside peaks (the shoulders) being lower and approximately equal in height. The line connecting the lowest points of the two troughs (the neckline) can be horizontal or sloped and represents a critical support level.

Dogecoin Must Hold $0.14

In the case of Dogecoin’s 12-hour chart, the price has completed the left shoulder and the head, with the right shoulder currently forming. The neckline of this H&S pattern is identified at approximately $0.14, as annotated by Olszewicz. This level is crucial; a decisive break below could confirm the bearish forecast suggested by the H&S formation.

Dogecoin head & shoulder pattern, 12-hour chart

Another technical detail present on the chart is the Fibonacci retracement levels, which are horizontal lines indicating where support and resistance are likely to occur. They are based on Fibonacci numbers, a sequence famous in mathematics and nature for its proportionality.

Here, the 0.5 Fibonacci level aligns with the left shoulder around $0.18, while the 0 level coincides with the peak at approximately $0.23. These levels are key to determining the potential support and resistance areas in the market.

Olszewicz has also highlighted a projected target area based on the H&S pattern’s typical behavior. This bearish target is identified using the height of the pattern from the head’s peak to the neckline, projected downward from the point of the neckline break. The target box, marked in green, shows a potential decline to $0.10 to $0.09, coinciding with the 1.618 and 2.0 Fibonacci extension levels. A fall to this level could lead to a price crash of 40%.

The importance of the H&S pattern lies in its reliability as a trend reversal signal. It validates when the price breaks below the neckline following the formation of the right shoulder. For traders and investors alike, this pattern serves as a cautionary tale to brace for potential downside risks.

As of the latest chart by Olszewicz, the neckline has not been breached, and the pattern has yet to be confirmed. It is critical for observers to watch the $0.14 level closely, as a break below it would likely activate a sell-off, fulfilling the H&S prophecy. However, until such a break occurs, the pattern remains a watchful indicator rather than a confirmed trend reversal.

In summary, Dogecoin’s price chart is showing signs that could concern bullish investors. If history is any guide, the emerging H&S pattern, closely watched by analysts like Olszewicz, suggests a possible downward move in Dogecoin’s value in the near future. However, only a decisive break below the neckline will validate this pattern, turning a watchful eye into a bearish outlook.

At press time, DOGE traded at $0.1509.

Dogecoin price

Dogecoin To $1: Analyst Thinks Dream Milestone Could Be Hit In Coming Weeks

An analyst has explained how a pattern forming in the Dogecoin price may suggest a rally to $1, if historical trend repeats this time as well.

Dogecoin 1-Week Price Appears To Be Forming A Classic Pattern

In a new post on X, analyst Ali has discussed how DOGE seems to have been showing a classic pattern in its weekly price once again. This trend involves a technical analysis (TA) pattern called the “Descending Triangle,” which, as its name suggests, is shaped like a triangle.

The pattern involves two trendlines between which the price of the asset consolidates; one of these is a line slopped downwards while the other is parallel to the time-axis. This property of the price converging downwards as it goes through the pattern is why it has descending in its name.

Like other TA consolidation patterns, the upper line of the Descending Triangle also provides resistance to the commodity, making tops more probable to form at it. Similarly, the lower line acts as a point of support and can help the price reverse back upwards.

A break out of either of these lines may result in a continuation of the trend in that direction. This means that a break above the triangle can be a bullish signal, while one below could suggest the dominance of bearish momentum.

Similar to the Descending Triangle, there is also an Ascending Triangle in TA, which works much like it, except for the fact that the parallel axis makes the upper line, connecting together tops, while the lower line ascends up as it joins higher lows.

Now, here is the chart shared by Ali that highlights a pattern that DOGE’s 7-day price has been forming recently:

Dogecoin Descending Triangle

From the graph, it’s visible that the Dogecoin 1-week price had been trading inside a long Descending Triangle between 2021 and this year, but the meme coin found a break earlier and has since registered some notable uplift.

Recently, though, the cryptocurrency has reached a stage of sideways movement. This, however, may not entirely be a bad thing, as DOGE has also seen a similar trend of a Descending Triangle break followed by consolidation in the past as well.

As is visible in the chart, the previous two such formations led to Dogecoin witnessing some very significant growth. As such, the latest one may also prove to be bullish, if this historical pattern continues to hold.

“Based on past trends, we might just see DOGE rocket towards $1 in the coming weeks!” explains Ali. From the current spot price, such a potential rally would mean a growth of a whopping 525% for the coin.

DOGE Price

Dogecoin’s price action has been quite stale since the price plunge earlier in the month, as the asset’s price is still trading around $0.16.

Dogecoin Price Chart

DOGE Price Prediction – Dogecoin Recovery Could Stall At $0.170

Dogecoin is attempting a recovery wave above the $0.150 resistance zone against the US Dollar. DOGE could struggle to clear the $0.170 resistance zone.

  • DOGE started a recovery wave from the $0.1280 support zone against the US dollar.
  • The price is trading above the $0.1500 level and the 100 simple moving average (4 hours).
  • There is a key bearish trend line forming with resistance at $0.170 on the 4-hour chart of the DOGE/USD pair (data source from Kraken).
  • The price must settle above $0.170 to move into a positive zone and start a fresh surge.

Dogecoin Price Faces Hurdles

After a major decline, Dogecoin price found support at $0.1280. A low was formed at $0.1283 and DOGE started a decent recovery wave, like Bitcoin and Ethereum. There was a move above the $0.1350 and $0.140 resistance levels.

The price climbed above the 23.6% Fib retracement level of the downward wave from the $0.2093 swing high to the $0.1283 low. However, the bears are still active and protecting more gains. There is also a key bearish trend line forming with resistance at $0.170 on the 4-hour chart of the DOGE/USD pair.

Dogecoin is also below the $0.1650 level and the 100 simple moving average (4 hours). On the upside, the price is facing resistance near the $0.1690 level or the 50% Fib retracement level of the downward wave from the $0.2093 swing high to the $0.1283 low.

DOGE Price Prediction

Source: DOGEUSD on TradingView.com

The next major resistance is near the $0.170 level. A close above the $0.170 resistance might send the price toward the $0.1880 resistance. The next major resistance is near $0.200. Any more gains might send the price toward the $0.220 level.

Another Decline in DOGE?

If DOGE’s price fails to gain pace above the $0.170 level, it could start another decline. Initial support on the downside is near the $0.1525 level.

The next major support is near the $0.1475 level. If there is a downside break below the $0.1750 support, the price could decline further. In the stated case, the price might decline toward the $0.1280 level.

Technical Indicators

4 Hours MACD – The MACD for DOGE/USD is now gaining momentum in the bullish zone.

4 Hours RSI (Relative Strength Index) – The RSI for DOGE/USD is now above the 50 level.

Major Support Levels – $0.1525, $0.1475 and $0.1280.

Major Resistance Levels – $0.1690, $0.1700, and $0.200.

Crypto Analyst Sounds Buy Alarm For Dogecoin – Can DOGE Price Reclaim $0.2?

The DOGE price has largely struggled to make a return to $0.2 since losing this price level early in April. And the meme coin has mostly been on a descent over the past few weeks, going as low as $1.4 at some point.

However, the tides appear to be shifting for the Dogecoin investors, with the meme token putting in a positive price performance in the past week. The double-digit gain and optimistic price action over the last seven days haven’t gone unnoticed by experts, as many anticipate a continued bullish run for the DOGE price in the near future.

Is A Price Rally Imminent For Dogecoin?

Prominent crypto analyst Ali Martinez took to the X platform to share an interesting analysis and projection for the Dogecoin price. According to the pundit, DOGE’s recent price action is signaling a potential rally to the upside over the coming days.

The reasoning behind this bullish prediction revolves around the TD (Tom Demark) Sequential indicator. Martinez mentioned that this indicator has flashed a buy signal on Dogecoin’s daily chart, suggesting that a price upswing lasting between one to four days might be on the cards.

The Tom Demark Sequential is an indicator in technical analysis used to identify potential points of trend exhaustion and price reversal. Typically, the TD Sequential indicator comprises two major phases known as the “setup” and the “countdown.” 

The setup phase consists of nine consecutive candlesticks depending on whether the token is in a bullish or bearish trend. The countdown phase, on the other hand, consists of 13 consecutive candlesticks, which start immediately after the completion of the “setup.” 

DOGE price

In the chart highlighted above, the DOGE price just completed the nine-candle setup phase, which may be signaling a potential price reversal. Given that this phase was mostly formed by bearish candles, the TD Sequential might be indicating a bottom for Dogecoin’s price.

Ultimately, it is likely that investors will see the DOGE price return to $0.2 if the potential rally produces four consecutive bullish candles. However, they might keep an eye out for the formation of the “countdown” phase.

The completion of the countdown phase on Dogecoin’s daily chart could signal an even stronger and longer-lasting price reversal. This could see the meme token break out of its current bearish trend and gather some momentum for higher price levels.

DOGE Price At A Glance

As of this writing, the DOGE price stands at around $0.1618, reflecting a significant 4.7% increase in the past 24 hours.

DOGE price

The Next Dogecoin? Top Trader Points To This Memecoin

Crypto trading sensation Ansem, known on X (formerly Twitter) as @blknoiz06, has directed the market’s gaze towards the Bitcoin Runes ecosystem, labeling it as the nascent grounds for the next 100x crypto opportunity, as NewsBTC reported yesterday. Ansem, whose prowess is well-documented through his previous astronomical gains of 170x on Solana (SOL), 520x on dogwifhat (WIF), and 80x on Bonk (BONK), stirred the crypto community with his recent Dogecoin comparison.

On the cusp of Bitcoin’s highly anticipated halving today, Ansem doubled down on his initial assessment, particularly highlighting two tokens within the Bitcoin Runes ecosystem: Bitcoin Wizards (WZRD) and PUPS. He equates WZRD with Dogecoin, suggesting it has the potential to mirror Dogecoin’s viral success. In contrast, he compares PUPS to the lesser-known but highly profitable dogwifhat (WIF).

Related Reading: Elon Musk Latest Tweet: How Much Did Dogecoin Gain From It Today?

Dogecoin price

In a tweet that caught the eye of both investors and enthusiasts, Ansem elaborated on his reasoning behind the picks, stating:

Great thread, been saying, I believe Runes are next asymmetric 100x opp in crypto. The meme that got DOGE founder interested in Bitcoin & the phrase magic internet money is still used today – representative of bitcoin culture. DOGE equivalent = WZRD, WIF equivalent = PUPS.

Ansem references a thread on X by Immutable Edge (@ImmutableSOL), who delved into the historical and cultural significance of the “Magic Internet Money” meme, originally sparked by mavensbot’s viral Reddit ad.

The “Magic Internet Money” meme dates back to February 18, 2013, when mavensbot, a digital artist, submitted a hand-drawn depiction of a blue wizard to promote Bitcoin on Reddit. This ad, created during Bitcoin’s early adoption phase, was crucial in cultivating a cultural ethos around Bitcoin.

It resonated deeply within the community, encapsulating the whimsical yet revolutionary nature of Bitcoin’s rise. The ad’s simplicity and authenticity resonated with the Reddit community, propelling Bitcoin from a niche internet experiment to a major financial phenomenon. Within weeks of the ad’s debut, Bitcoin’s value surged from $27 to a record high of $1,132 by November 2013.

Bitcoin Wizards, one of the highlighted tokens, aims to rekindle this original spirit. The token leverages the iconic imagery and cultural narrative of the “Magic Internet Money” meme to foster a new wave of interest and adoption. The creators of WZRD are not only paying homage to Bitcoin’s roots but are also embedding this storied meme within the mechanics of a modern cryptocurrency, aiming to capture both nostalgia and innovation.

The Bitcoin Wizards project is part of the broader Bitcoin Runes ecosystem, which reached a lot of hype prior to its launch. According to Ansem, WZRD’s history and deep roots in memes give it the perfect ingredients to become the next Dogecoin, just on Bitcoin Runes.

Moreover, the analyst assessment comes at a critical time for the crypto market, which is often influenced by the narratives that capture the community’s imagination. As the Bitcoin halving event unfolds, many eyes will be on the Bitcoin Runes ecosystem to see if it can indeed replicate the meteoric rises seen in BRC-20 tokens and Ordinals.

At press time, WZRD traded at $12.15, up 70% in the last 24 hours.

WZRD/USD price

DOGE Price Prediction – Dogecoin Could Restart Drop To $0.12

Dogecoin is struggling below the $0.180 resistance zone against the US Dollar. DOGE must stay above the $0.1450 support zone to start a fresh increase.

  • DOGE started a fresh decline below the $0.1750 zone against the US dollar.
  • The price is trading above the $0.1700 level and the 100 simple moving average (4 hours).
  • There is a key contracting forming with support at $0.1540 on the 4-hour chart of the DOGE/USD pair (data source from Kraken).
  • The price could restart its increase unless there is a close below the $0.1450 support.

Dogecoin Price Turns Red

After struggling to clear the $0.20 resistance zone, Dogecoin price started a fresh decline. There was a sharp bearish move below the $0.180 and $0.1650 levels. DOGE traded as low as $0.1283 and recently attempted a recovery wave like Bitcoin and Ethereum.

The price climbed above the $0.1450 level. It broke the 23.6% Fib retracement level of the downward move from the $0.2096 swing high to the $0.1283 low.

However, the bears are active near the $0.1680 resistance and the 50% Fib retracement level of the downward move from the $0.2096 swing high to the $0.1283 low. The price is now consolidating near the $0.1550 level. There is also a key contracting forming with support at $0.1540 on the 4-hour chart of the DOGE/USD pair.

DOGE Price

Source: DOGEUSD on TradingView.com

Dogecoin is also below the $0.1600 level and the 100 simple moving average (4 hours). On the upside, the price is facing resistance near the $0.160 level. The next major resistance is near the $0.170 level. A close above the $0.170 resistance might send the price toward the $0.1880 resistance. The next major resistance is near $0.200. Any more gains might send the price toward the $0.220 level.

More Downsides in DOGE?

If DOGE’s price fails to gain pace above the $0.160 level, it could continue to move down. Initial support on the downside is near the $0.1520 level.

The next major support is near the $0.1450 level. If there is a downside break below the $0.1450 support, the price could decline further. In the stated case, the price might decline toward the $0.120 level.

Technical Indicators

4 Hours MACD – The MACD for DOGE/USD is now gaining momentum in the bearish zone.

4 Hours RSI (Relative Strength Index) – The RSI for DOGE/USD is now below the 50 level.

Major Support Levels – $0.1520, $0.1450 and $0.1280.

Major Resistance Levels – $0.1600, $0.1780, and $0.200.

Dogecoin Flashes Weekly Golden Cross: Why This Analyst Believes The Bull Rally Is Far From Over

A crypto analyst known as Yomi has noted that the Dogecoin recent price action could turn bullish after this week. According to Yomi, DOGE is on the verge of creating a golden cross on its price chart, an event that could indicate the continuation of a major bull run. He noted the need for a green candle this week in order to start a new rally, which could be tough considering recent on-chain metrics and market fundamentals. 

Dogecoin Flashing Weekly Golden Cross

The weekly chart for Dogecoin is flashing a golden cross, a bullish signal that occurs when the 50-week moving average crosses above the 200-week moving average. According to a weekly price chart shared by Yomi, this weekly cross looked almost completed just two weeks ago, as a price surge for DOGE in the past two months saw the short-term moving average approaching the longer one. 

However, trader sentiment around DOGE has turned bearish since the beginning of April as the bulls struggled to push the crypto past the $0.22 mark, allowing it to form a price resistance level. Consequently, DOGE has gone on to form two weeks of bearish candles, which has derailed the completion of a golden cross. 

Yomi observed that the formation of this bullish indicator has been pushed forward to multiple weeks of upward price movement. Furthermore, Yomi said all that’s needed is for DOGE to close higher than its open price this week and form a green candle to confirm the breakout and get back on track to a golden cross. 

DOGE To Turn Bullish?

Dogecoin dropped by an astounding margin last week to spearhead the crash in the majority of meme coins. Interestingly, the crypto fell to as low as $0.13 in the middle of the week, representing a 33% decline from its opening price at the start of the week. During the price fall, crypto whale transaction tracker Whale Alerts noted the transfer of 600 million DOGE tokens worth $92.3 million from a private wallet into Binance, hinting at a potential sell-off from a DOGE whale.

However, all is not lost as Dogecoin price action has been showing green in the past day. At the time of writing, DOGE is trading at $0.1669, up by 5% in the past 24 hours. If DOGE can close substantially above its weekly open of $0.1624, that would confirm the continuation of the journey to a golden cross and likely kick off a new uptrend

Yomi noted in another post on social media that Doge will continue to tease a bullish price action in the longer term as long as it stays above $0.12 this week. 

Dogecoin price chart from Tradingview.com

Dogecoin Whales Send 800 Million DOGE To Exchanges, Dump Incoming?

Dogecoin has been one of the best performers over the past year, consistently holding up gains even through market dumps. However, after the meme coin’s rally in March and then the subsequent dump in April, it looks like investors, especially whales, are finally getting ready to start taking profit. This is evidenced by a number of large DOGE transactions that were flagged going into exchanges over the last day.

Dogecoin Whales Move 800 Million DOGE To Exchanges

The movement of coins to centralized exchanges can be very bearish for the price of a cryptocurrency. This is because the move to centralized exchanges often points to a selling spree as investors look to take advantage of the deep liquidity that is provided by these exchange platforms. This reason is why the massive amounts of DOGE tokens being sent to centralized exchanges are concerning for the community.

Over the course of the last day, the on-chain whale tracking platform Whale Alert reported a number of large DOGE transactions that carried tokens to centralized exchanges. The largest of these transactions happened on April 14, when a single transaction was carrying 600 DOGE tokens to the Binance exchange.

At the time of the transaction, the total stash of tokens being transferred was worth around $92.3 million. However, with the DOGE price increasing since then, the value of the tokens contained in this transaction could be closer to $95 million at the time of this writing.

Hours later, after the first transaction, two other transactions followed, also carrying notable amounts of DOGE tokens. The second transaction, which carried 100 million DOGE tokens worth $15.28 million, headed for the Robinhood exchange.

The third transaction of the trio was also headed to the Robinhood exchange, carrying 99.25 million tokens worth $16.15 million. In total, approximately 800 million DOGE tokens to centralized exchanges, signaling a potential sell-off on the horizon.

Can DOGE Surge From Here?

Despite the bearish pressure that seems to categorize Dogecoin lately, the longer-term outlook for the meme coin has remained bullish, especially among crypto analysts. Crypto analyst Trader Tardigrade has continued to maintain a bullish stance on the meme coin, which he believes could pull a significant rally soon.

Tardigrade’s latest analysis of Dogecoin saw a bullish formation on the chart, which could lead to a 100% rally. The move, which the analyst expects to happen sometime in April following the Bitcoin Halving, is expected to see the DOGE price rise as high as $0.4 in the short term.

However, first, the meme coin’s price would have to break above $0.205, which has developed into significant resistance for the altcoin. But, as the crypto analyst explains, a break above this level would confirm the bullish breakout.

For now, Dogecoin is still struggling to break through this $0.205 resistance and has since been rejected from this level. It is currently sitting at $0.165, with a 5.51% increase on the last day and a 20% decrease on the last week, according to data from Coinmarketcap.

Dogecoin price chart from Tradingview.com

Dogecoin Usurped: These Memecoins Overtake DOGE In Active Trader Count

On-chain data suggests Dogecoin is no longer the dominant meme coin in terms of its weekly active trader count. Here are the coins above it.

Dogecoin Has Been Surpassed In Trader Count By Other Memecoins

According to data from the market intelligence platform IntoTheBlock, DOG and DEGEN are the two assets that have managed to surpass the original meme-based cryptocurrency in terms of weekly trader count.

A “trader” here refers to an investor who has been holding onto their coins since less than 30 days ago. These investors generally tend to move their coins often, as they play the role of active traders in the market. They are certainly not the HODLers of the sector.

When the number of these traders goes up for any asset, it means that some fresh interest is potentially coming into the coin. Price actions like rallies are only sustainable when they have an ever-increasing fuel coming in, so the trader count going up can perhaps be a bullish indication in this direction.

On the other hand, the metric going down implies traders either are losing interest in the cryptocurrency or have decided to hold onto it in the long term, thus maturing past the 30-day threshold. Whatever the case be, though, a drawdown in the indicator does suggest a lack of new hands coming into the market.

Now, here is a chart that shows the trend in the number of traders for the various meme coins in the sector:

Dogecoin Number of Traders

As displayed in the chart, Dogecoin (in blue) has consistently remained number one in terms of the number of traders, which only makes sense as DOGE has generally been the most popular meme coin, as its market cap would indicate.

Hype and excitement are usually the number one driver for attracting users to a cryptocurrency. It would appear, though, that DOGE has recently been falling off in this metric.

“While DOGE has long dominated almost every metric in the memecoin market, it seems to be losing some of its dominance,” says the analytics firm. The interest behind the coin may thus not be at the same level anymore.

As for which meme coins have overtaken the cryptocurrency so far, IntoTheBlock notes, “DEGEN currently leads with 129k active traders, followed by DOG with 126k.”

Given this high interest in these memecoins, it’s possible they may be likely to go through some volatility in the near future as all these traders make moves at once.

In theory, this volatility can take these coins in either direction, but as the intelligence platform explains, “a strong increase in traders usually coincides with bullish momentum.”

DOGE Price

Dogecoin had slipped below the $0.17 level last week, but the coin has since bounced back as it’s now trading just under $0.20.

Dogecoin Price Chart