Expert Forecasts 700% Growth For Dogecoin (DOGE) As It Sets Sights On $1 Target

Dogecoin (DOGE), the popular meme-based cryptocurrency, has demonstrated its resilience in the market with a 2.5% price increase over the past 24 hours, reaching a trading price of $0.1607. 

Analysts, including Altcoin Sherpa and Ali Martinez, have recently shared optimistic predictions for DOGE’s future, suggesting further gains and potential for outperformance compared to other tokens.

A Strong Future For Dogecoin In 2024? 

Over the past months, DOGE has closely followed Bitcoin’s price action, experiencing ups and downs in tandem with the market leader. 

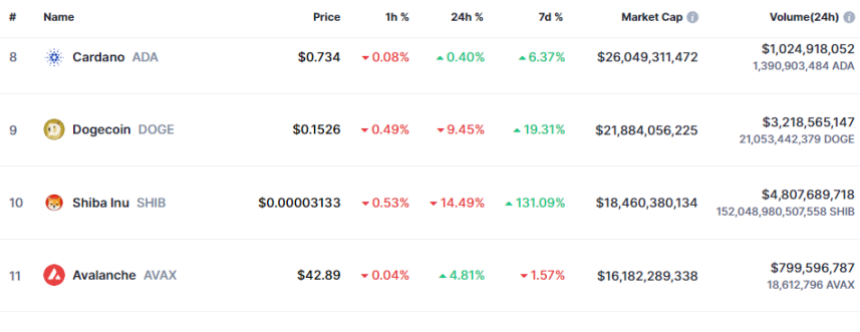
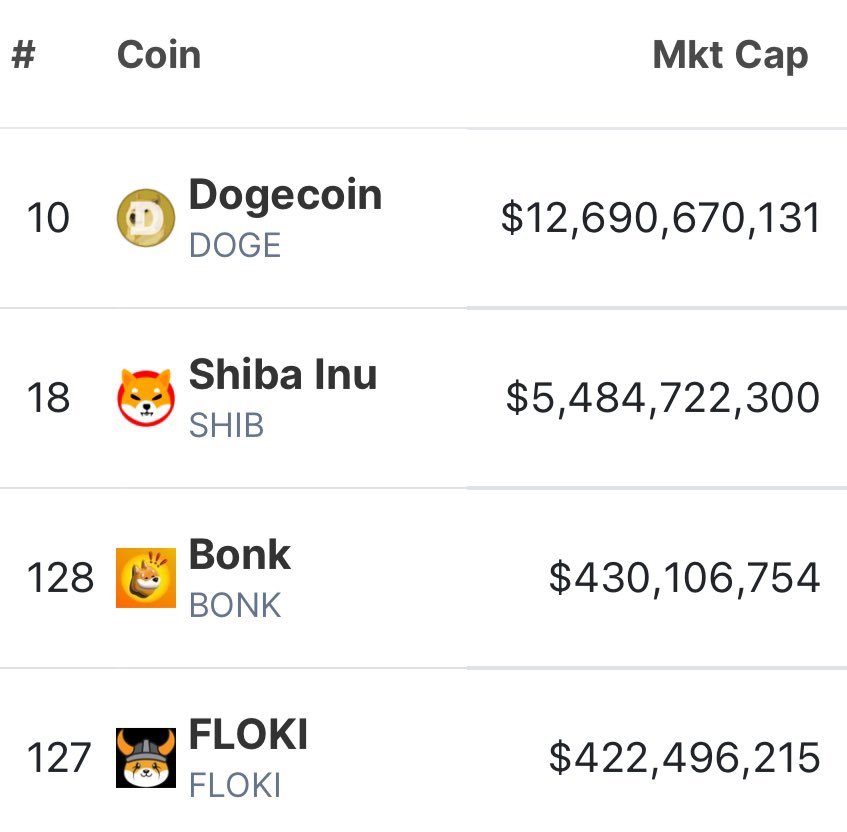
On March 28, DOGE reached its yearly high of $0.2292, solidifying its position as the 9th largest cryptocurrency with nearly 100% year-to-date growth. Despite the volatility, DOGE has demonstrated its ability to rebound and attract investor attention.

Market expert Altcoin Sherpa recently expressed optimism about DOGE’s future, stating that the coin is poised for strength in 2024. 

Altcoin Sherpa recommended averaging between $0.12 and $0.14, emphasizing DOGE’s potential to outperform other tokens.

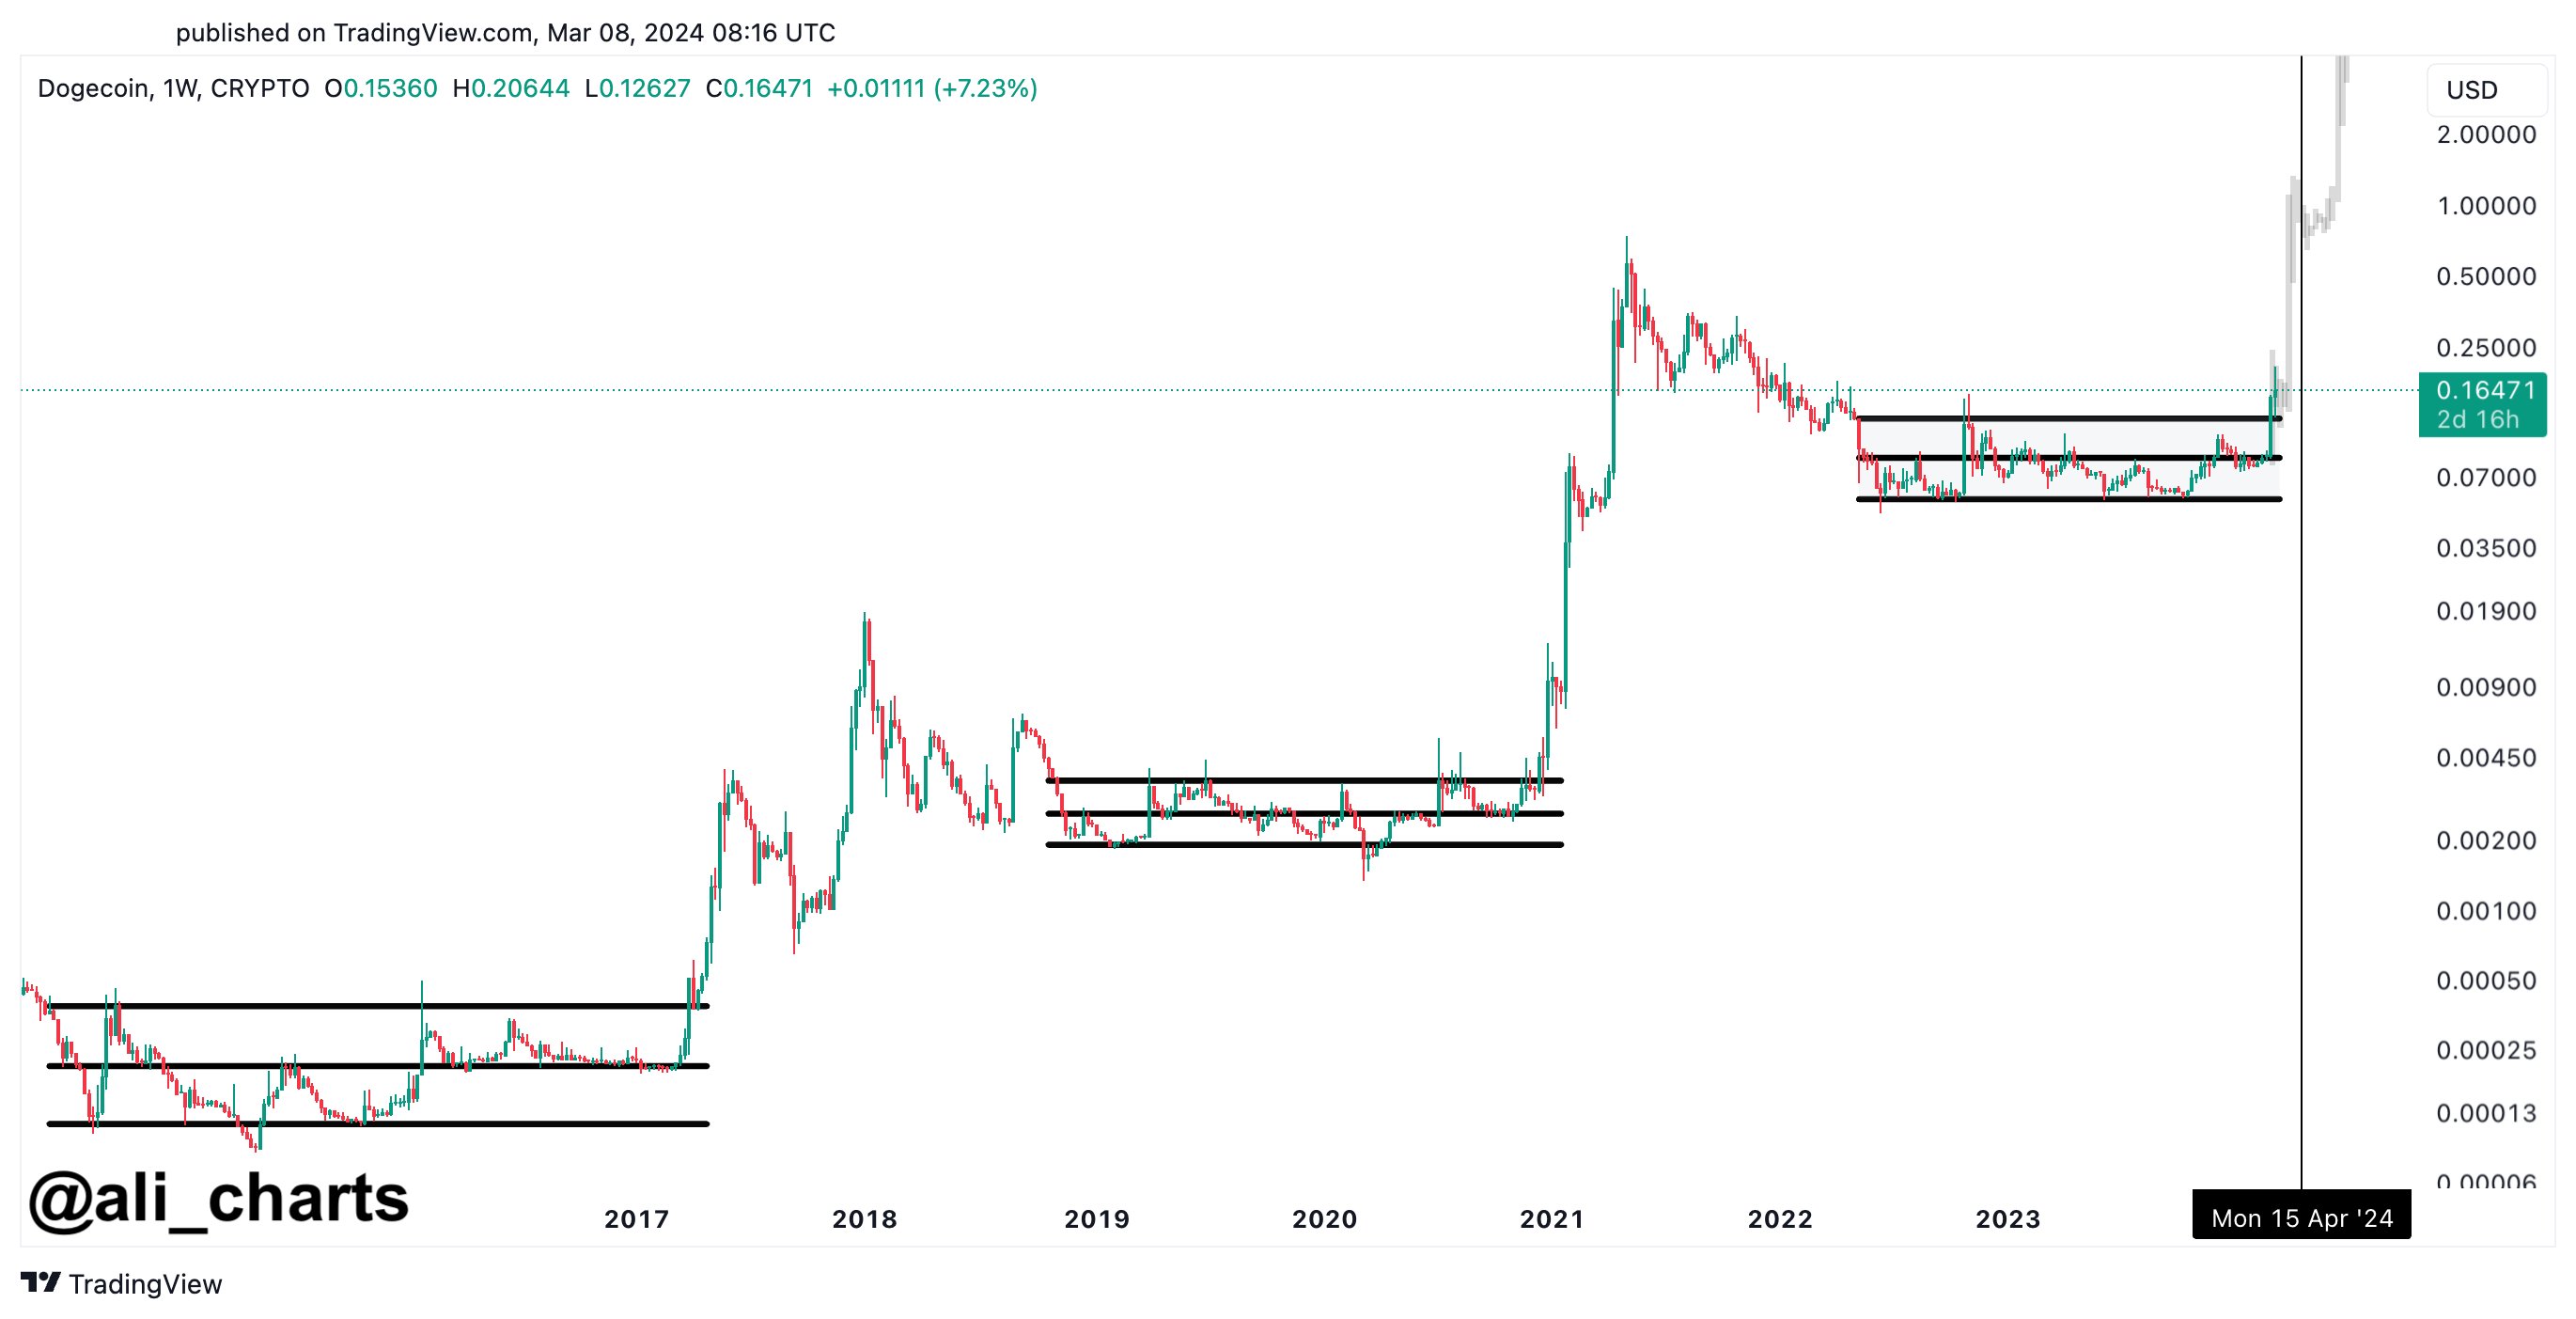
The analyst highlighted DOGE’s previous consolidation phase, lasting almost two years, and suggested that it is primed for a significant price surge in the future. Sherpa stated:

DOGE is looking good. I strongly feel like this is going to be a strong coin for 2024. I think averaging between $.12 and $.14 would be a solid play and this one should outperform many other tokens for a lot of reasons. It chopped for almost 2 years, it’s going to moon later. 

700% Price Uptrend Toward $1

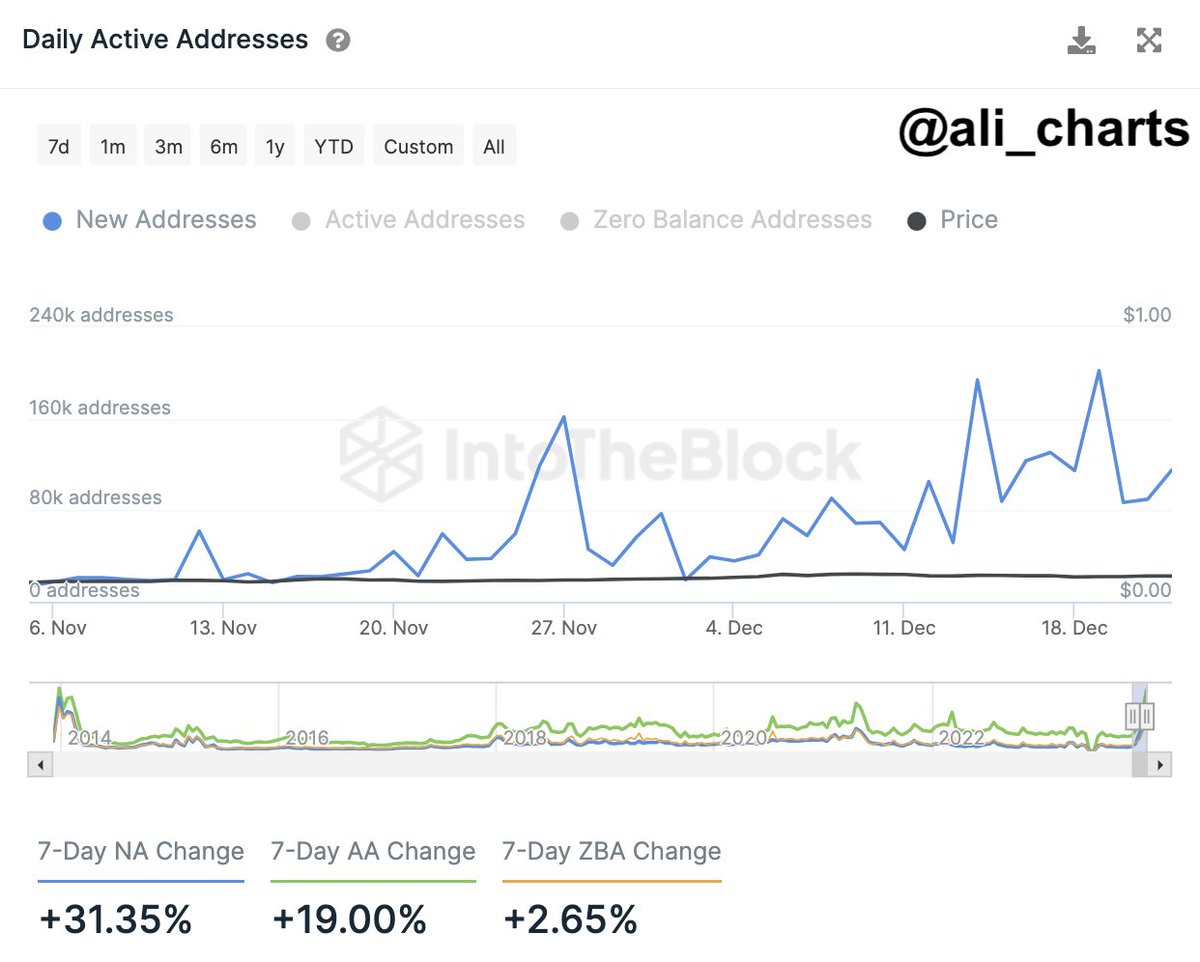
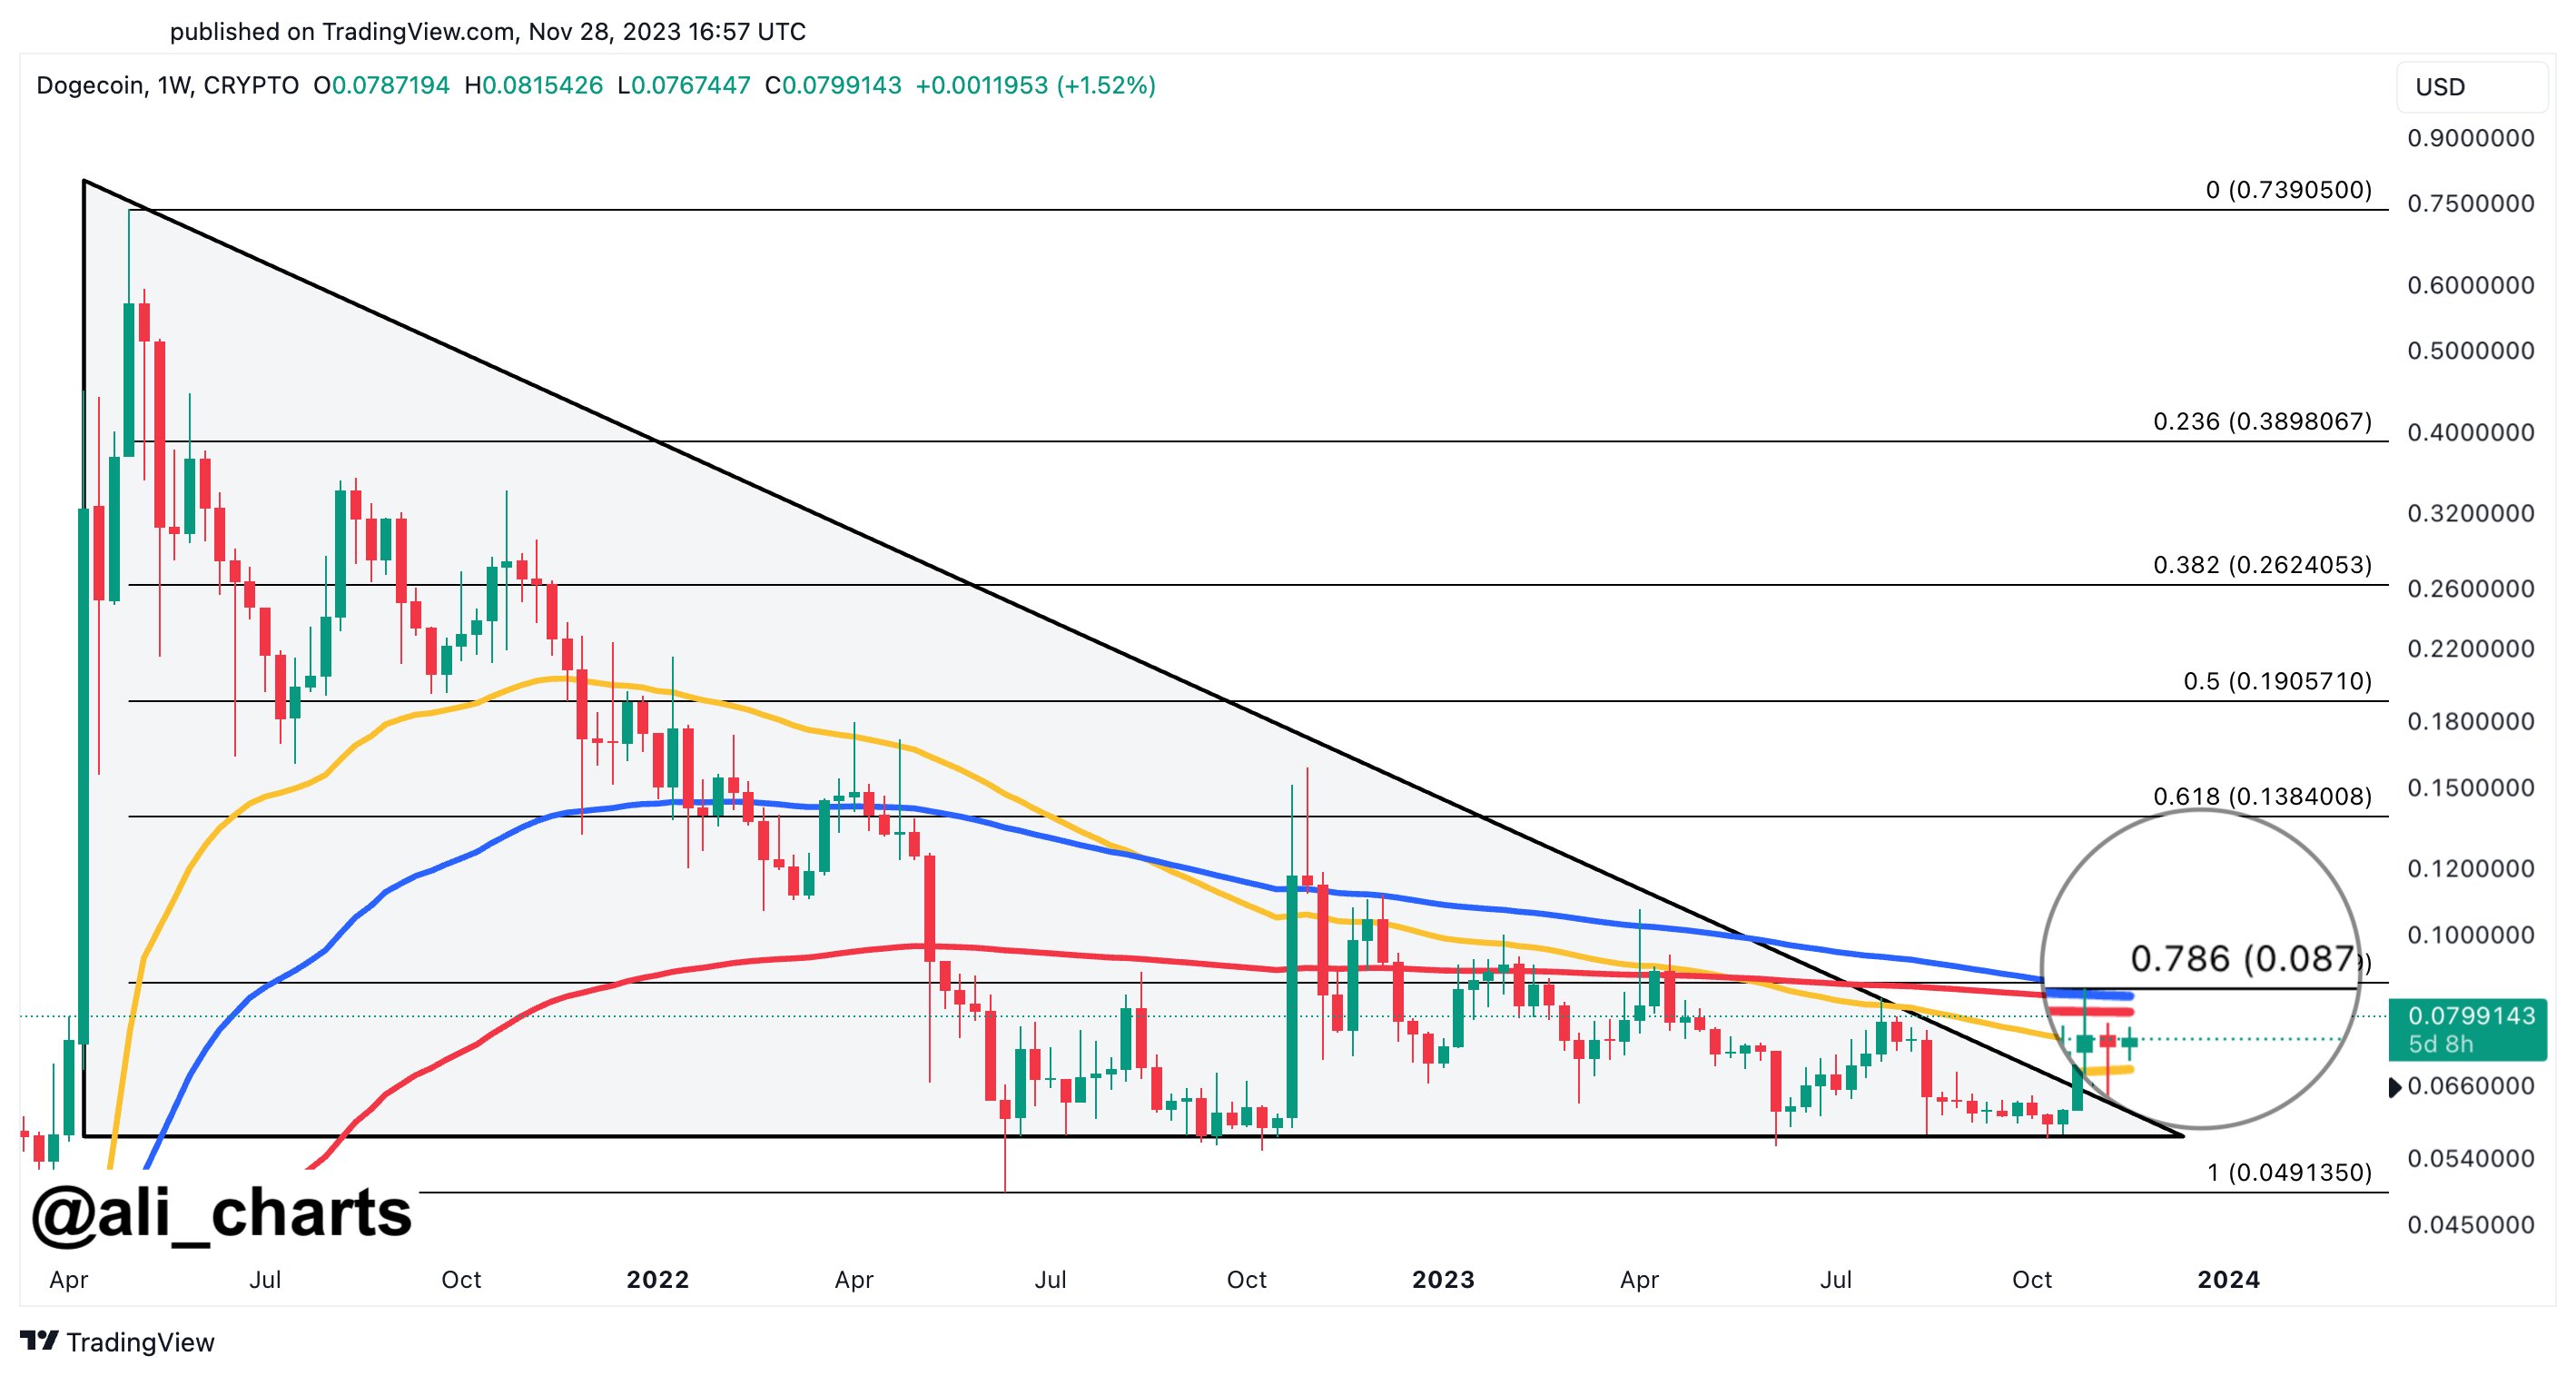
On the other hand, crypto analyst Ali Martinez has also shared a bullish prediction for DOGE, noting the coin’s recurring price patterns. 

Martinez pointed out that DOGE consolidates after breaking out of a descending triangle formation. Based on historical trends, the analyst believes that DOGE has the potential to rally towards $1 in the coming weeks, which would represent a staggering 700% uptrend in price from current levels, surpassing the cryptocurrency’s current all-time high of $0.7316, reached in May 2021. 

Dogecoin

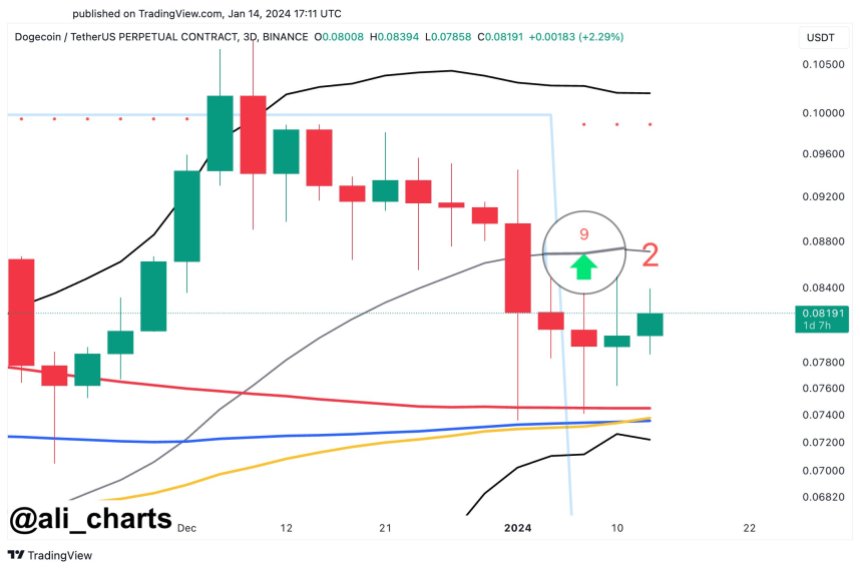
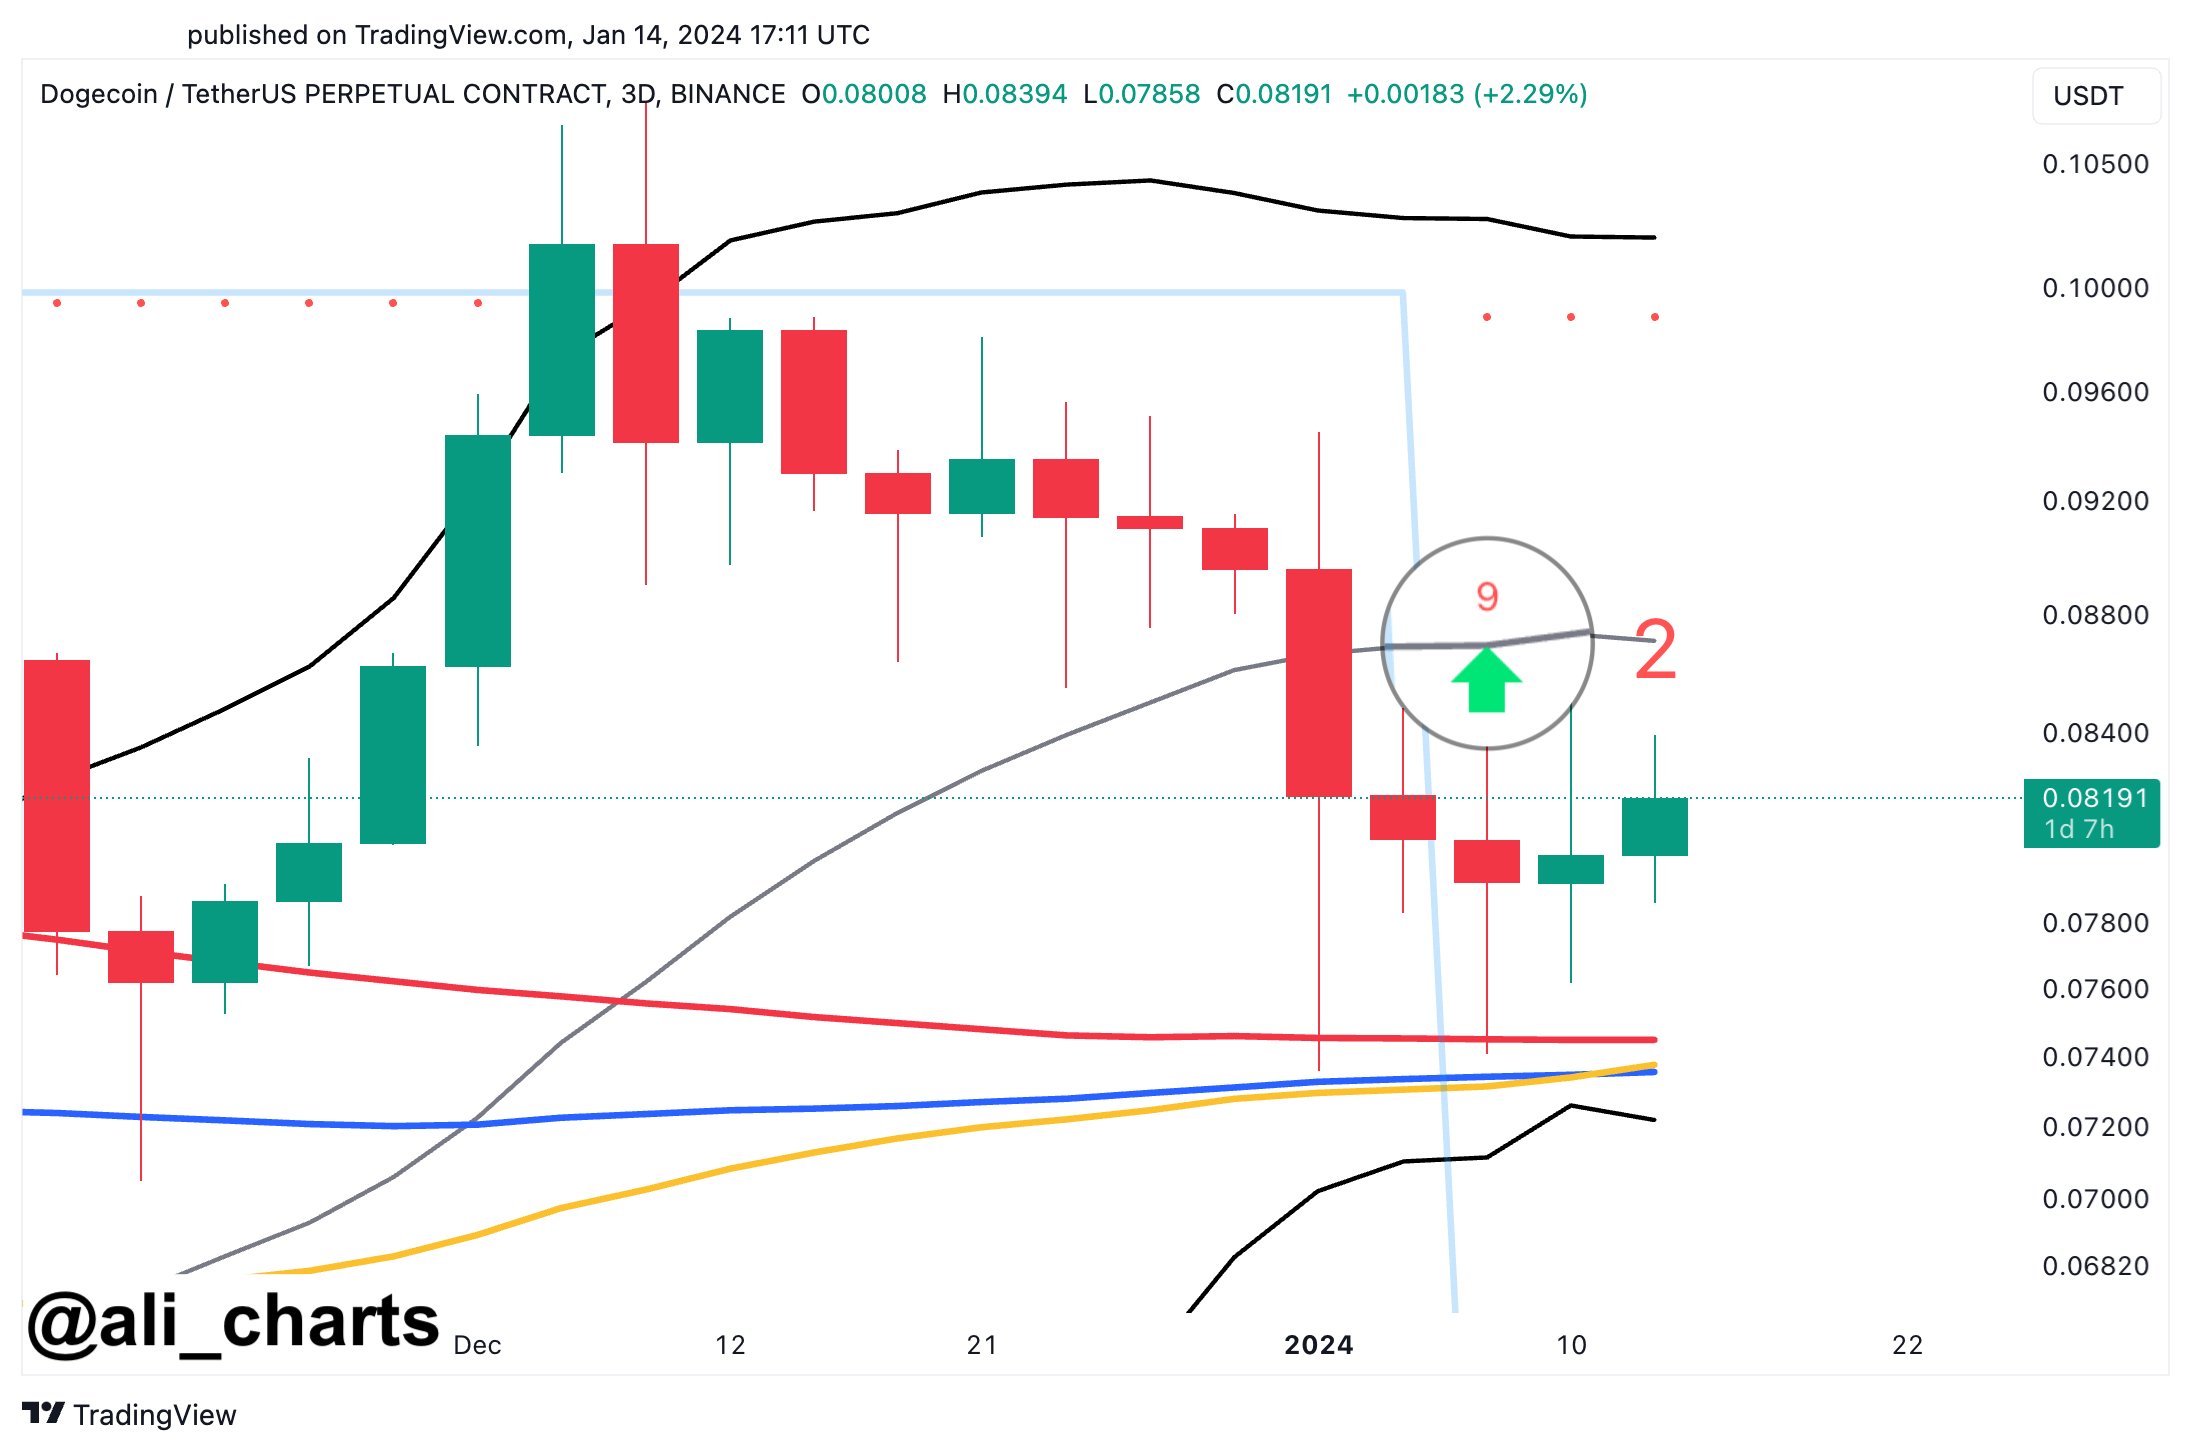
Despite Martinez’s optimistic outlook, Dogecoin faces several resistance levels that have impeded its recovery after a 21% price decline in the past two weeks.

The meme coin encounters a significant obstacle at the $0.1633 price level, as depicted in the DOGE/USD daily chart above. This level has acted as a barrier for the past 10 days, hindering further upward movement.

In its journey towards the $0.200 mark, DOGE may encounter additional hurdles at $0.1739, $0.1938, and $0.1998. These resistance levels must be overcome before the cryptocurrency can potentially retest its all-time high.

It is important to note that Bitcoin’s performance will likely influence Dogecoin’s price movement in the coming weeks. In addition, Dogecoin’s overall trajectory through the end of 2024 remains uncertain as it depends on the potential for a bullish breakout and various market factors.

Featured image from Shutterstock, chart from TradingView.com 

Dogecoin Whale Takes $52.3 Million In DOGE Off Binance, Sign Of Buying?

On-chain data shows a Dogecoin whale made a large withdrawal from Binance today, which may be bullish for the memecoin’s price.

A Large Amount Of Dogecoin Has Left The Binance Platform In The Past Day

According to data from the cryptocurrency transaction tracker service Whale Alert, a large transfer has been spotted on the Dogecoin blockchain during the past day.

In this move, the network has processed the movement of 304,588,737 DOGE, worth around $52.3 million when the transaction was executed. Given the large scale of the transfer, it’s likely that a whale entity was involved.

The whales are influential on the network due to the sheer number of tokens they carry in their wallets. As such, their moves can be worth keeping an eye on since they may cause noticeable fluctuations in the market.

How the market would be affected by the moves from these humongous entities depends on what they intend to do with those moves. Naturally, it’s impossible to say what an investor plans to do confidently.

The type of addresses involved in the transaction, however, can sometimes at least provide a hint about what the whale may have wanted to achieve with the move.

Below are the details of the latest Dogecoin whale transaction, which reveals its relevant addresses.

Dogecoin Whale Outflow

As is visible, this Dogecoin transaction was executed from a wallet connected to the cryptocurrency exchange Binance. The destination of the move appears to have been a couple of unknown addresses.

An unknown address refers to a wallet not affiliated with any centralized entity like an exchange (the sender in this transfer is a “known” wallet as it’s attached to a central entity in Binance). Generally, such addresses are the investors’ personal, self-custodial wallets.

Transfers where coins move in the direction of exchanges to self-custodial entities are known as “exchange outflows.” Usually, investors make such moves when they plan to hold onto their coins long-term, as it’s safer to do so outside of these platforms, where the platforms control the wallets.

Exchange outflows can also sometimes be an indication that fresh buying is going on, as some investors like to immediately withdraw their purchases of these platforms.

Given the relatively massive scale of the Dogecoin exchange outflow in the current case, it can naturally be bullish news for investors if the whale is indeed accumulating here.

However, the scenario also exists where the whale has withdrawn to sell through the peer-to-peer (P2P) mode. In this case, the effect on the asset could be bearish instead.

DOGE Price

At the time of writing, Dogecoin is floating around $0.176, down 16% over the past week.

Dogecoin Price Chart

Traders Not Showing Dogecoin FOMO, Good Sign For Rally?

On-chain data suggests traders haven’t been showing FOMO towards Dogecoin despite the latest rally, a sign that could be positive for its continuation.

Dogecoin Total Amount Of Holders Has Remained Flat Recently

According to data from the on-chain analytics firm Santiment, FOMO, which would normally be associated with tops, has been absent from the Dogecoin market recently.

The indicator of relevance here is the “Total Amount of Holders,” which, as its name suggests, keeps track of the total number of DOGE addresses that are carrying a non-zero balance right now.

When the value of this metric goes up, it can be because of a number of reasons. A major one would naturally be fresh adoption, as new investors coming into the sector would open up new addresses and add balance to them, thus raising the indicator’s value.

Other reasons can include existing users reconsolidating their holdings among multiple addresses (usually for a purpose like privacy) or old investors coming back to reinvest in the meme coin.

In general, whenever the metric shows this kind of trend, it means that some net adoption of the asset is taking place, which can be a positive sign in the long term.

On the other hand, a decline in the indicator implies some holders may have decided to exit from the cryptocurrency as they have completely cleared out their addresses.

Now, here is a chart that shows the trend in the Dogecoin Total Amount of Holders over the last few months:

Dogecoin Total Amount of Holders

As displayed in the above graph, the ‘Total Amount of Holders’ for Dogecoin has been flat for many weeks now, implying that the adoption of the meme coin has hit the brakes.

Interestingly, this sideways trajectory has come despite the fact that DOGE’s price has gone through some volatile price action during this period. Generally, events like rallies are attractive to traders, so a notable amount of them tend to jump into the asset during them.

It would appear that the traders have either not been paying attention to the recent DOGE rally or just not taking it seriously. In the past couple of weeks, the ‘Total Amount of Holders’ for the meme coin has gone up by only 0.21%, despite the fact that the price has rallied more than 40% in the same window.

Historically, when a large number of traders join the blockchain at once during price surges, it’s a sign that FOMO around the asset is spreading. Usually, the meme coin’s price tends to go against the expectations of the majority, so when there is widespread FOMO, a top can become likely to take place.

As there hasn’t been any such FOMO for Dogecoin recently, it’s possible that it could be a positive sign for the rally’s continuation. There is also another signal brewing, however, that may not be so constructive.

From the chart, it’s visible that the Mean Dollar Invested Age, a metric that keeps track of the average age of DOGE investments, has plunged recently, implying that the experienced hands have been on the move. When this signal formed earlier in the year, the coin’s price approached the top not too long after.

DOGE Price

Dogecoin had surpassed the $0.22 level earlier, but it seems the asset has gone through some drawdown as it’s now back under $0.21.

Dogecoin Price Chart

Dogecoin Could Hit $1 If History Repeats, Analyst Reveals When

An analyst has explained that Dogecoin may be able to hit $1 if history repeats for it. Here’s when exactly this could happen for DOGE.

Dogecoin Has Been Breaking Out Of A Parallel Channel Recently

In a new post on X, analyst Ali has discussed a potential outcome for Dogecoin based on the historical pattern. Below is the chart for the weekly price of the memecoin shared by the analyst, which reveals a similar-seeming pattern that the asset has followed over the years.

Dogecoin Price Chart

As Ali has highlighted in the chart, before both of its previous two major bull runs, Dogecoin’s weekly price consolidated inside a specific parallel channel for a notable amount of time.

The “parallel channel” here refers to a pattern in technical analysis (TA) made up of two parallel trendlines inside which the price of the asset consolidates. Parallel channels can be of different types, like ascending and descending ones, but in the context of the current discussion, channels parallel to the time axis are relevant.

The upper trendline in such a pattern is drawn by joining together tops, while the lower line connects bottoms. When the price retests either of these lines, a reversal is more probable.

This means that a retest of the upper line could break the uptrend and cause the asset to go through a drawdown. Similarly, the lower line may be a source of support and help the price reverse itself back up.

However, a break out of either of these lines can imply a continuation of the trend in that direction. The graph shows that when the weekly price of Dogecoin saw breakouts like this out of the respective consolidation channels the last two times, it went through bull rallies.

In the past couple of years, it would appear that DOGE has once again gone through a similar period of consolidation as those previous two, and recently, the coin has been breaking out.

Ali has marked a potential trajectory that Dogecoin could follow in the chart based on the precedent set by these last two bull runs. “This may sound wild, but if history is any guide, Dogecoin $DOGE could hit $1 by mid-April!” says the analyst.

From the current cryptocurrency price, such a run would suggest an increase of more than 488% for the memecoin in less than a month and a half. Obviously, a rally like this would be super impressive if it ends up playing out like this.

It remains to be seen what trajectory Dogecoin follows now that it has seemingly broken free of its long parallel consolidation channel.

DOGE Price

When writing, Dogecoin is trading around $0.17, up 36% in the past week.

Dogecoin Price Chart

Dogecoin Accumulation: DOGE Millionaires Have Shot Up By 76%

On-chain data shows the total number of Dogecoin millionaires has observed a steep increase over the past month, a sign of strong accumulation.

Dogecoin Millionaires Have Jumped 76% In Past Month

According to data from the market intelligence platform IntoTheBlock, the number of Dogecoin millionaires has been skyrocketing recently. “DOGE millionaires” here refer to the addresses that are carrying at least $1 million in their balance.

The below chart shows how the total number of such addresses has changed over the past month.

Dogecoin Millionaires

From the graph, it’s visible that the Dogecoin investors carrying between $1 million to $10 million worth of coins have seen their total count rapidly go up since the end of February.

This range would include the sharks as well as the smaller of the whales, so this trend would imply interest in the cryptocurrency has sharply risen among these large entities. Following the latest increase, the total count of addresses holding a balance in this range has crossed the 800 mark.

The largest of the investors in the market, those with more than $10 million in DOGE, have also seen their number grow in the same period, as the chart displays.

The population of these humongous whales has now crossed the 200 mark. This means that in all, there are now more than 1,000 millionaires on the Dogecoin network.

This corresponds to a growth of around 76% in the past 30 days, which is a pretty rapid increase. Since the indicator has caught pace, DOGE has also witnessed an impressive rally, which may not be a coincidence.

Naturally, if the number of these millionaires continues to rise into the near future, it would be a sign that big money interest in the memecoin is still furthering, which would be a positive sign for the rally.

DOGE Price Has Enjoyed A Sharp Rally Recently

Towards the end of last month, Dogecoin finally managed to break free of its long spell of consolidation and did so in quite the spectacular fashion as well. As the chart below shows, DOGE has observed a rapid rise in the past couple of weeks.

Dogecoin Price Chart

During this rally so far, Dogecoin has managed to reach a high beyond the $0.20 level. Since this peak, however, the coin has seen some notable drawdown, as it’s now trading around $0.15.

From the chart, it’s visible that the initial sharp crash in the memecoin had occurred at the same time as Bitcoin had plummeted following a breach of its previous all-time high price.

Unlike BTC, though, which has made some significant recovery already, DOGE is yet to close back in on its recent highs. Despite this significant pullback, though, the coin’s investors would still be carrying profits of more than 95% over the past month, showcasing just how strong its recent bullish momentum has been.

In terms of the market cap, Dogecoin is currently the nineth-largest asset in the sector, some distance behind eighth-placed Cardano (ADA).

Dogecoin Market Cap

While Dogecoin still has a comfortable gap to Shiba Inu (SHIB) in tenth, its rival is fast approaching it with a run of a whopping 131% in the past week.

Top Analyst Anticipates Dogecoin Surge To $0.10, But There’s A Catch

Elon Musk-backed meme coin Dogecoin (DOGE) has seen a significant price correction in recent days, falling over 14% in the past 30 days, due to the market’s waning sentiment surrounding the hype generated by the approval of Bitcoin Exchange Traded Funds (ETFs), and the lack of bullish catalysts.

After reaching an 11-month high of $0.1073 on December 11, 2023, DOGE witnessed a decline to the $0.0743 level. However, over the past 7 days, the meme coin has managed to break the downtrend, recording a 2% surge.

This positive movement has led a prominent crypto analyst to predict a potential upward movement towards the previously lost $0.10 mark. However, there is a crucial support cluster that the cryptocurrency must maintain for this anticipated rise to occur.

Rebound Opportunity For Dogecoin

Renowned crypto analyst Ali Martinez has provided insightful analysis on the prospects of Dogecoin following its recent price correction. Martinez has drawn attention to the TD Sequential indicator, a technical analysis tool used to identify potential trend reversals and price exhaustion points.

According to Martinez, the TD Sequential indicator has recently presented a buy signal on the 3-day chart of Dogecoin as seen in the chart below. 

Dogecoin

According to Martinez’s analysis, the TD Sequential indicator suggests a potential rebound opportunity for DOGE. However, he emphasizes the critical importance of a key support cluster centered around the $0.074 mark. Maintaining this support level is crucial for Dogecoin to realize its upward potential and regain positive momentum.

Key Levels To Watch 

In addition to this pivotal support, several other key levels should be closely monitored as they could significantly impact the future price action of the meme coin. 

The first noteworthy level is the support near $0.078. This level plays a vital role as a foundation for maintaining price stability. It represents a zone where buying pressure is expected to outweigh selling pressure, indicating a higher probability of DOGE sustaining its upward trajectory.

Another level of significance is the $0.075 level, which has recently demonstrated strong support for the token. Dogecoin has rebounded from this level and is currently trading just above it, reinforcing the importance of this price point in determining future price movements.

Conversely, resistance around $0.088 poses a significant barrier to DOGE’s continued upward movement. To sustain its positive trajectory and reach higher levels such as $0.09, the token must overcome this resistance. 

Subsequently, it would face further hurdles at the $0.940 and $0.9824 levels before attempting to regain the $0.10 mark.

Dogecoin

The future price movements of Dogecoin remain uncertain, and it is yet to be determined which side, whether bullish or bearish, will prevail. The outcome of this battle could significantly influence the mid-term direction of the token’s price.

Featured image from Shutterstock, chart from TradingView.com 

Dogecoin To See 24% Rally To $0.100 If This Holds: Analyst

An analyst has explained that Dogecoin could rally towards $0.10 based on a pattern forming in its price if a support cluster continues to hold.

Dogecoin Has Observed A Buy Signal On Its 3-Day Chart

As explained by analyst Ali in a post on X, a TD-Sequential buy signal recently appeared for DOGE on its 3-day price. The “Tom Demark (TD) Sequential” here refers to an indicator in technical analysis that helps pinpoint locations of probable tops and bottoms in any asset’s price.

This indicator is made up of two phases. The first is called the “setup” phase, and it’s nine-candles long. During this phase, nine candles of the same polarity are counted, and following the ninth, the asset could be assumed to have hit a point of reversal.

Whether the setup would indicate a buy or sell signal naturally depends on the prevailing price trend. If the price were going up during the setup (the candles were green), then the setup’s completion would indicate a potential point of selling. Similarly, the TD Sequential would mark a sell signal in the opposite case.

Once the setup is complete, the second phase of the indicator, called the “countdown,” begins. This phase is thirteen candles long, and once these candles are in, the asset could once again be considered to have reached a probable bottom or top.

Now, here is a chart shared by Ali that highlights the completion of a TD-Sequential setup phase for the 3-day price of Dogecoin:

Dogecoin TD Sequential Setup

The above graph shows that the Dogecoin 3-day price has recently finished a TD-Sequential setup with red candles. This would imply that the indicator has given a buy signal for the asset.

So far, since this setup has formed, DOGE has registered two green candles on this chart, implying that the meme coin’s price may have indeed witnessed a change of direction.

In the same chart, the analyst has also highlighted a support cluster for the coin, where some important lines have converged around the $0.074 level. Based on this and the TD-Sequential pattern that has formed, Ali notes, “as long as the $0.074 support cluster continues to hold, DOGE has a great chance of rebounding to $0.100 or higher!”

From the current spot price of the cryptocurrency, a potential rally to this $0.100 target would mean a surge of around 24% for the asset. If DOGE retests the $0.074 support level and rebounds to this high, the coin would see a rally of over 35%.

DOGE Price

Dogecoin opened 2024 with a deep plunge, and the memecoin has so far been unable to recover from it, as its price has mostly been stuck in consolidation. At present, DOGE is trading around the $0.0804 mark.

Dogecoin Price Chart

Dogecoin In Demand: Data Shows DOGE Adoption Is Accelerating

On-chain data suggests the Dogecoin adoption has been picking up recently as a large number of new addresses are popping up on the network.

Dogecoin Is Observing A High Number Of Daily New Addresses Currently

In a new post on X, analyst Ali talked about how the Dogecoin network activity has been looking like recently in terms of new address creation. A “new address” is one that has taken part in some kind of transaction activity for the first time.

Some of the new addresses that pop up on the network every day belong to the existing users, who may be creating additional addresses for privacy purposes or simply moving to a different wallet.

The rest of the new addresses, though, are being created by fresh investors entering into the market, so the daily total value of the new addresses can provide hints about how the adoption of the meme coin is coming along.

The below chart shows the trend in this metric for Dogecoin over the last couple of months:

Dogecoin Adoption

As displayed in the above graph, the daily number of new Dogecoin addresses started spiking last month and has since been consistently setting new highs as the metric continues in an overall upward trajectory. This would suggest that the network has been receiving a consistently high influx of new investors recently.

Adoption is always a constructive sign for any cryptocurrency, as fresh hands can help build a solid foundation that future uplifts in the price can sustainably grow off. Thus, it’s crucial for assets to continue to look attractive to new users, something that Dogecoin appears to have been doing fine recently.

Any positive effects on the price that come through adoption, though, generally only appear in the long term. Rather, depending on the nature of the adoption, it can in fact impart a negative influence on the cryptocurrency in the short-term.

This happens when too many new users join the blockchain in a short amount of time, only buying into the asset due to FOMO. Recently, the on-chain analytics firm Santiment also discussed this fast pace of address creation on the Dogecoin network, noting that Bitcoin (BTC) is also displaying a similar trend.

Dogecoin & Bitcoin

“Though network growth is a great sign long-term, this rapid rate of new wallets is a FOMO sign to be slightly cautious of,” explained the analytics firm in the post.

From the chart, it’s visible that Cardano (ADA) is the only asset among the top cryptocurrencies by market cap that’s not displaying any sort of address growth at all.

DOGE Price

Since the rally Dogecoin observed during the starting third of the month, the asset has gone rather stale, as its price has continued to move sideways around the $0.093 level during the last two weeks.

Dogecoin Price Chart

Solana’s BONK Climbs To 3rd Place In Dog Coin Market Cap, Leaving FLOKI Behind

In recent weeks, the Solana (SOL) blockchain has been making waves in the crypto world, with its native token SOL experiencing a remarkable uptrend of 46% over the past 30 days. Alongside this surge, Bonk Inu (BONK), the first Solana-based meme coin, has gained significant traction, solidifying its position as the third-largest dog coin by market capitalization, surpassing Floki Inu (FLOKI).

BONK Rockets To New Heights With 845% Surge In 30 Days

The staggering growth of Bonk Inu is evident in its recent performance, achieving an impressive 845% gain over the past 30 days. The meme coin’s remarkable ascent has propelled it to new yearly highs, while SOL experienced a slight pullback from its peak of $65 on December 2.

Despite the temporary setback for SOL, the bullish momentum and renewed interest in Bonk Inu have caught the attention of market participants. 

As of now, BONK is trading at $0.0000069712, outperforming the broader crypto market with a remarkable 22.4% uptrend in the past 24 hours, aligning with the positive sentiment surrounding Bitcoin (BTC) and the overall market.

BONK

With a market capitalization of approximately $430 million, Bonk Inu currently sits in third place among dog coins, trailing behind the likes of Shiba Inu (SHIB) and Dogecoin (DOGE), which boast market caps of $5 billion and $12 billion, respectively.

CoinGecko data reveals that BONK has witnessed a significant 24-hour trading volume of $65,235,205.16, indicating strong investor interest and active participation in the market.

BONK

The future trajectory of Bonk Inu’s uptrend and its potential for further gains remains uncertain. However, should BONK continue to attract investors, it has the potential to dethrone Pepecoin (PEPE) in terms of market capitalization. As of the latest update, PEPE has achieved a market cap of $592 million.

However, it is important to note that Bonk Inu still has a significant gap to bridge to catch up with the largest dog coins in the market in terms of market capitalization, namely SHIB and DOGE. SHIB and DOGE have demonstrated substantial gains and already possess staggering market capitalizations.

Dog Coins Make Strong Push For Year-End Gains

The altcoin SHIB, built on the Ethereum platform and known for its Shiba Inu mascot, continues to demonstrate consistent gains across various time frames. 

Notably, SHIB has seen a 14% increase over the past fourteen days and an 18% surge over the past thirty days. These positive trends have allowed the dog coin to achieve a slight year-to-date profit of 0.2% after experiencing a significant downturn in 2022.

Presently, SHIB is trading at $0.00000946, representing a decline of more than 89% from its all-time high (ATH) of $0.00008616, reached in October 2021.

Meanwhile, the meme coin DOGE, which has the backing of Elon Musk, is currently trading at $0.09058. It has witnessed an 18% rise over the past fourteen days and nearly 30% growth over the past thirty days, following a sustained upward trend that began on November 21. 

BONK

However, in contrast to SHIB’s price action, DOGE has experienced a 12% decline year-to-date and an 87% drop from its ATH of $0.731578 reached in May 2021.

It remains to be seen whether the dog coins will continue to experience further gains throughout the remainder of the year or if a healthy pullback will occur to surpass upper resistance levels for another upward movement.

Featured image from Shutterstock, chart from TradingView.com 

Dogecoin To Double Its Price If This Barrier Breaks, Analyst Predicts

An analyst has explained how Dogecoin breaking the $0.087 barrier could open the path to DOGE price levels nearly double the recent ones.

Dogecoin Has Three Important Lines Converging At $0.087 Right Now

In a new post on X, analyst Ali has discussed what the weekly chart of DOGE is looking like right now in terms of some important historical lines. In particular, the levels of interest here are the 100-week EMA, 200-week EMA, and 0.786 Fibonacci.

A “moving average” (MA) refers to an analytical tool that calculates the mean of any given quantity over a specific period of time, and as its name implies, it moves in time and changes its value as the quantity fluctuates.

This basic tool is quite useful as it smooths out the curve by removing local fluctuations, making a study of long-term trends easier to perform. In the context of the current topic, though, a normal MA isn’t of focus, but rather a modified form called the exponential moving average (EMA).

The EMA works like the usual MA, except it places a greater weight on the most recent readings of the quantity. What this means is that the older the reading, the less weightage it has in the metric, so the line’s changes reflect the latest price direction more strongly.

Now, here is a chart that shows the trend in the 100-week and 200-week EMAs for Dogecoin, as well as the weekly price curve of the meme coin:

Dogecoin Weekly

As is visible from the above graph, these two Dogecoin EMAs have approached each other recently and have converged into a narrow range around the $0.087 level.

In the past, these two EMAs of the cryptocurrency have posed resistance to the price and it appears that the weekly chart of Dogecoin has been struggling with them again, as it has been finding rejection here during the past three weeks.

These two lines aren’t the only ones converging near $0.087, however; it would appear that the 0.786 Fibonacci level is doing the same. The Fibonacci levels listed in the chart are some ratios derived from the famous Fibonacci series.

In this series, dividing any number (except for the first few) by its succeeding number always gives a ratio of about 0.618. The square root of this number is 0.786, which is the level the analyst has marked here.

Dogecoin thus has a major wall at $0.087, made up of the convergence of all these historically significant lines. “Breaking past this barrier could open the gates for DOGE to nearly double its price, aiming for a target of $0.14,” explains the analyst.

DOGE Price

Dogecoin has observed a surge back above the $0.080 mark during the past day, as the below chart shows. It now remains to be seen if the coin will go on to retest this $0.087 level that might be so crucial for the coin.

Dogecoin Price Chart