Dogecoin To $1: Analyst Thinks Dream Milestone Could Be Hit In Coming Weeks

An analyst has explained how a pattern forming in the Dogecoin price may suggest a rally to $1, if historical trend repeats this time as well.

Dogecoin 1-Week Price Appears To Be Forming A Classic Pattern

In a new post on X, analyst Ali has discussed how DOGE seems to have been showing a classic pattern in its weekly price once again. This trend involves a technical analysis (TA) pattern called the “Descending Triangle,” which, as its name suggests, is shaped like a triangle.

The pattern involves two trendlines between which the price of the asset consolidates; one of these is a line slopped downwards while the other is parallel to the time-axis. This property of the price converging downwards as it goes through the pattern is why it has descending in its name.

Like other TA consolidation patterns, the upper line of the Descending Triangle also provides resistance to the commodity, making tops more probable to form at it. Similarly, the lower line acts as a point of support and can help the price reverse back upwards.

A break out of either of these lines may result in a continuation of the trend in that direction. This means that a break above the triangle can be a bullish signal, while one below could suggest the dominance of bearish momentum.

Similar to the Descending Triangle, there is also an Ascending Triangle in TA, which works much like it, except for the fact that the parallel axis makes the upper line, connecting together tops, while the lower line ascends up as it joins higher lows.

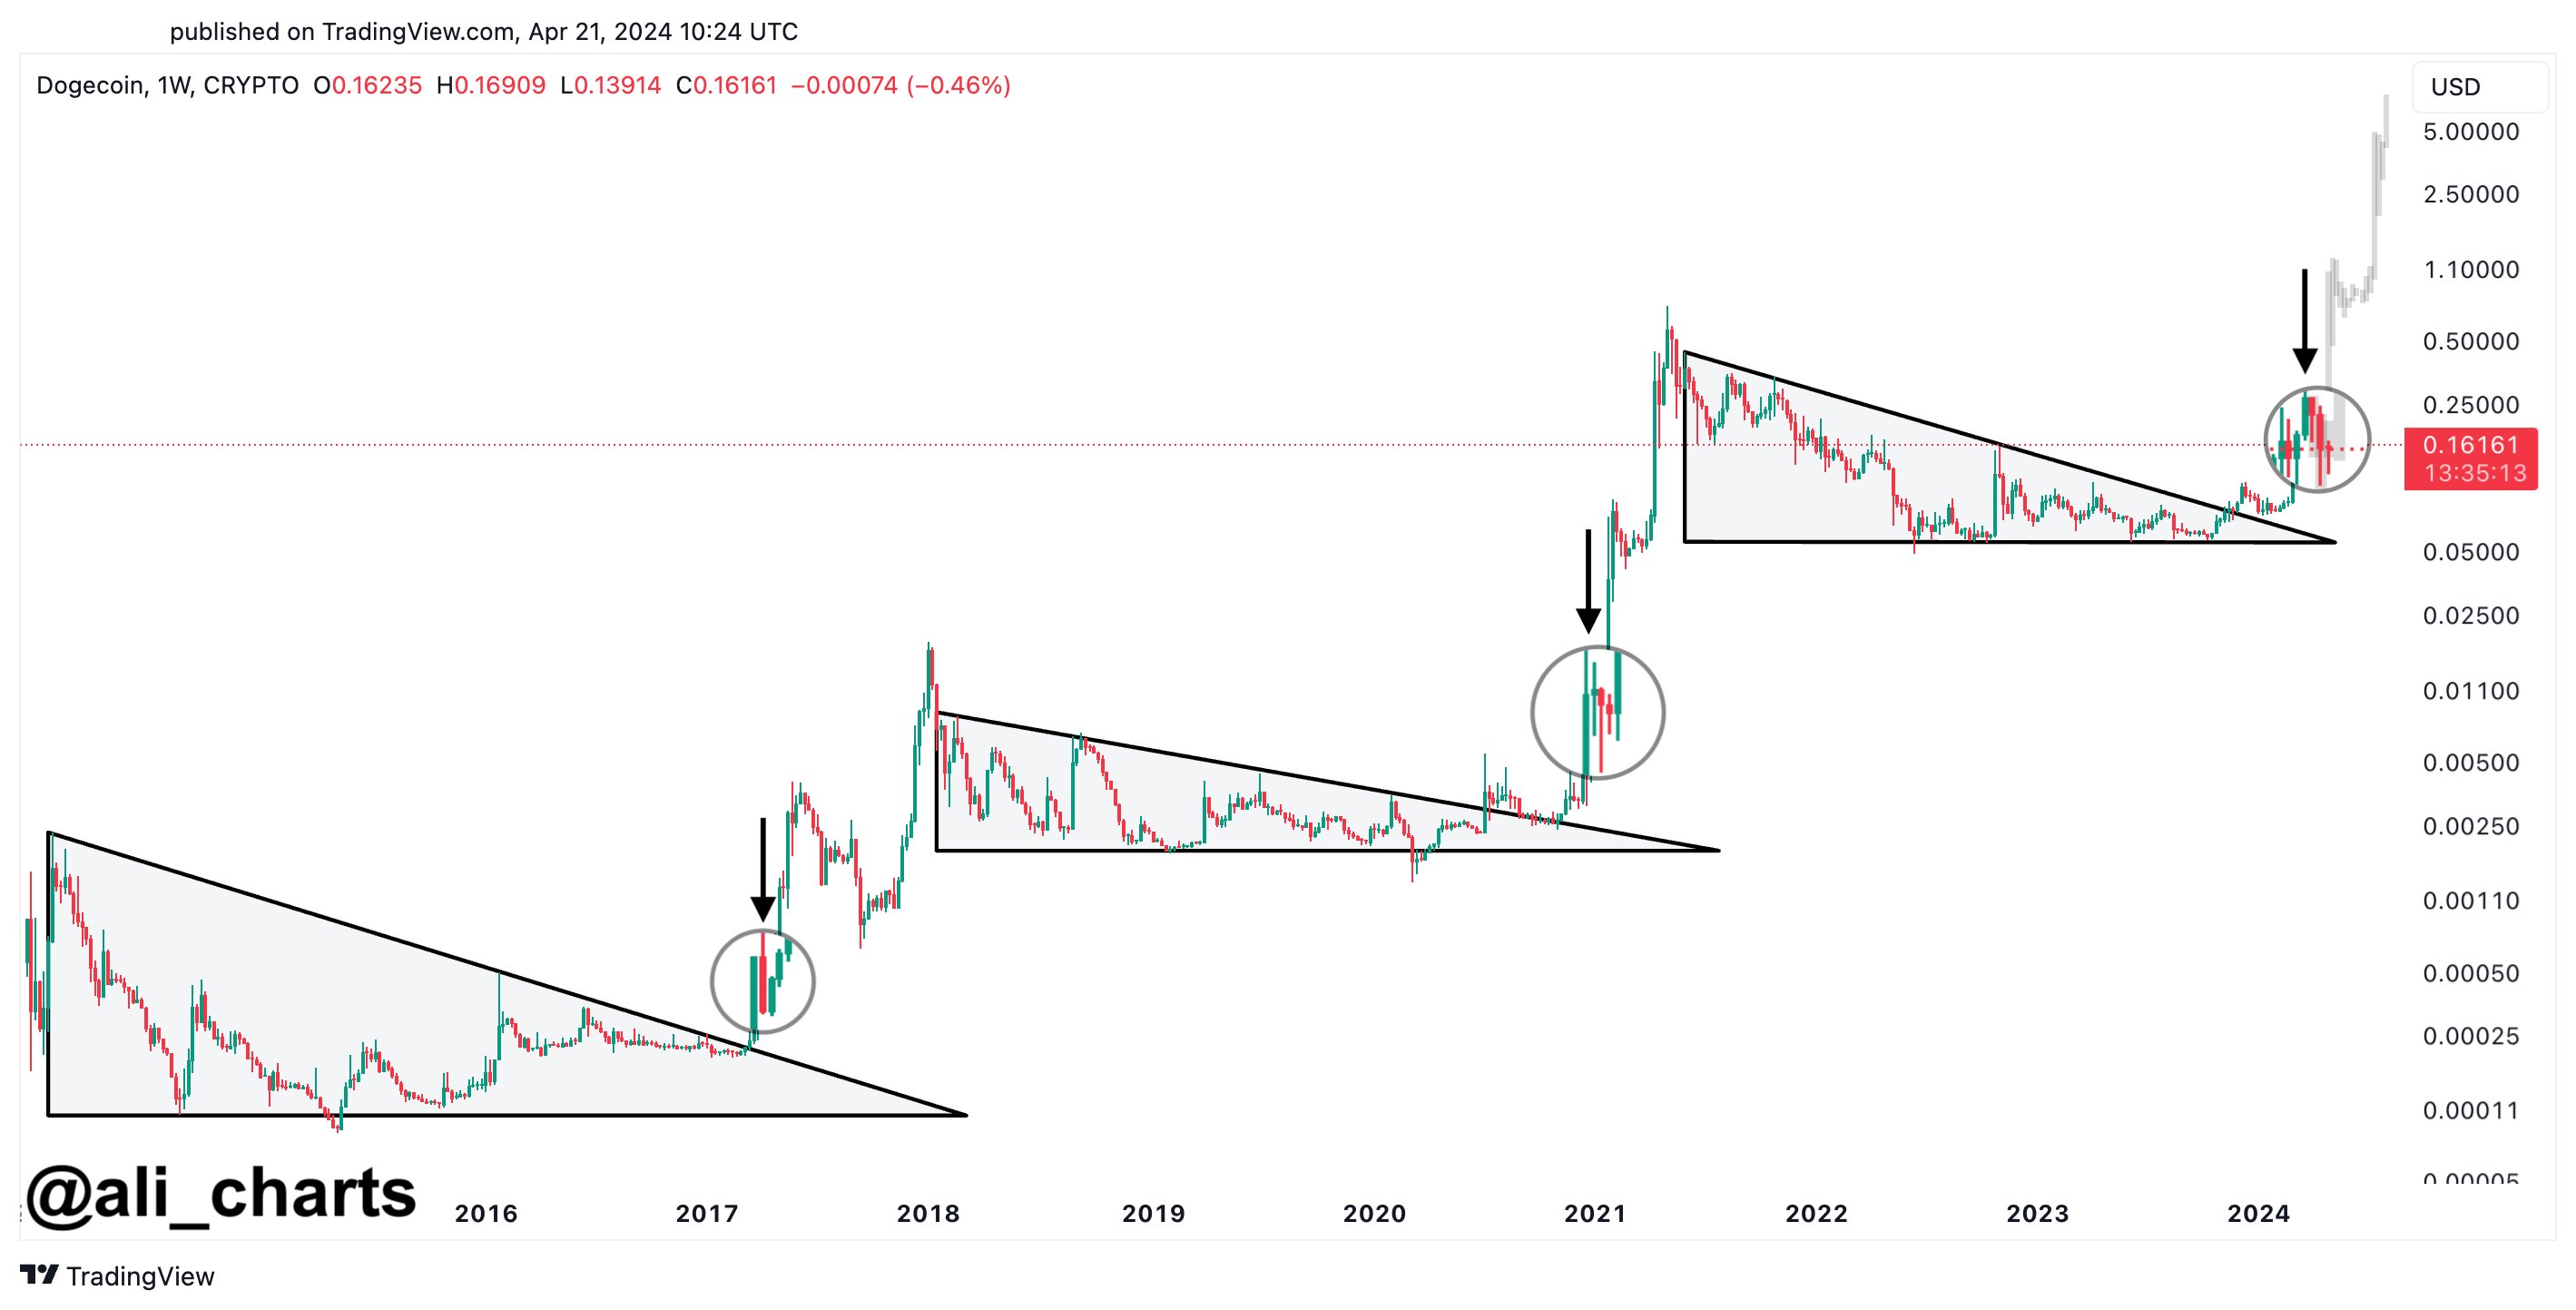
Now, here is the chart shared by Ali that highlights a pattern that DOGE’s 7-day price has been forming recently:

Dogecoin Descending Triangle

From the graph, it’s visible that the Dogecoin 1-week price had been trading inside a long Descending Triangle between 2021 and this year, but the meme coin found a break earlier and has since registered some notable uplift.

Recently, though, the cryptocurrency has reached a stage of sideways movement. This, however, may not entirely be a bad thing, as DOGE has also seen a similar trend of a Descending Triangle break followed by consolidation in the past as well.

As is visible in the chart, the previous two such formations led to Dogecoin witnessing some very significant growth. As such, the latest one may also prove to be bullish, if this historical pattern continues to hold.

“Based on past trends, we might just see DOGE rocket towards $1 in the coming weeks!” explains Ali. From the current spot price, such a potential rally would mean a growth of a whopping 525% for the coin.

DOGE Price

Dogecoin’s price action has been quite stale since the price plunge earlier in the month, as the asset’s price is still trading around $0.16.
Dogecoin Price Chart

Dogecoin Could Hit $1 If History Repeats, Analyst Reveals When

An analyst has explained that Dogecoin may be able to hit $1 if history repeats for it. Here’s when exactly this could happen for DOGE.

Dogecoin Has Been Breaking Out Of A Parallel Channel Recently

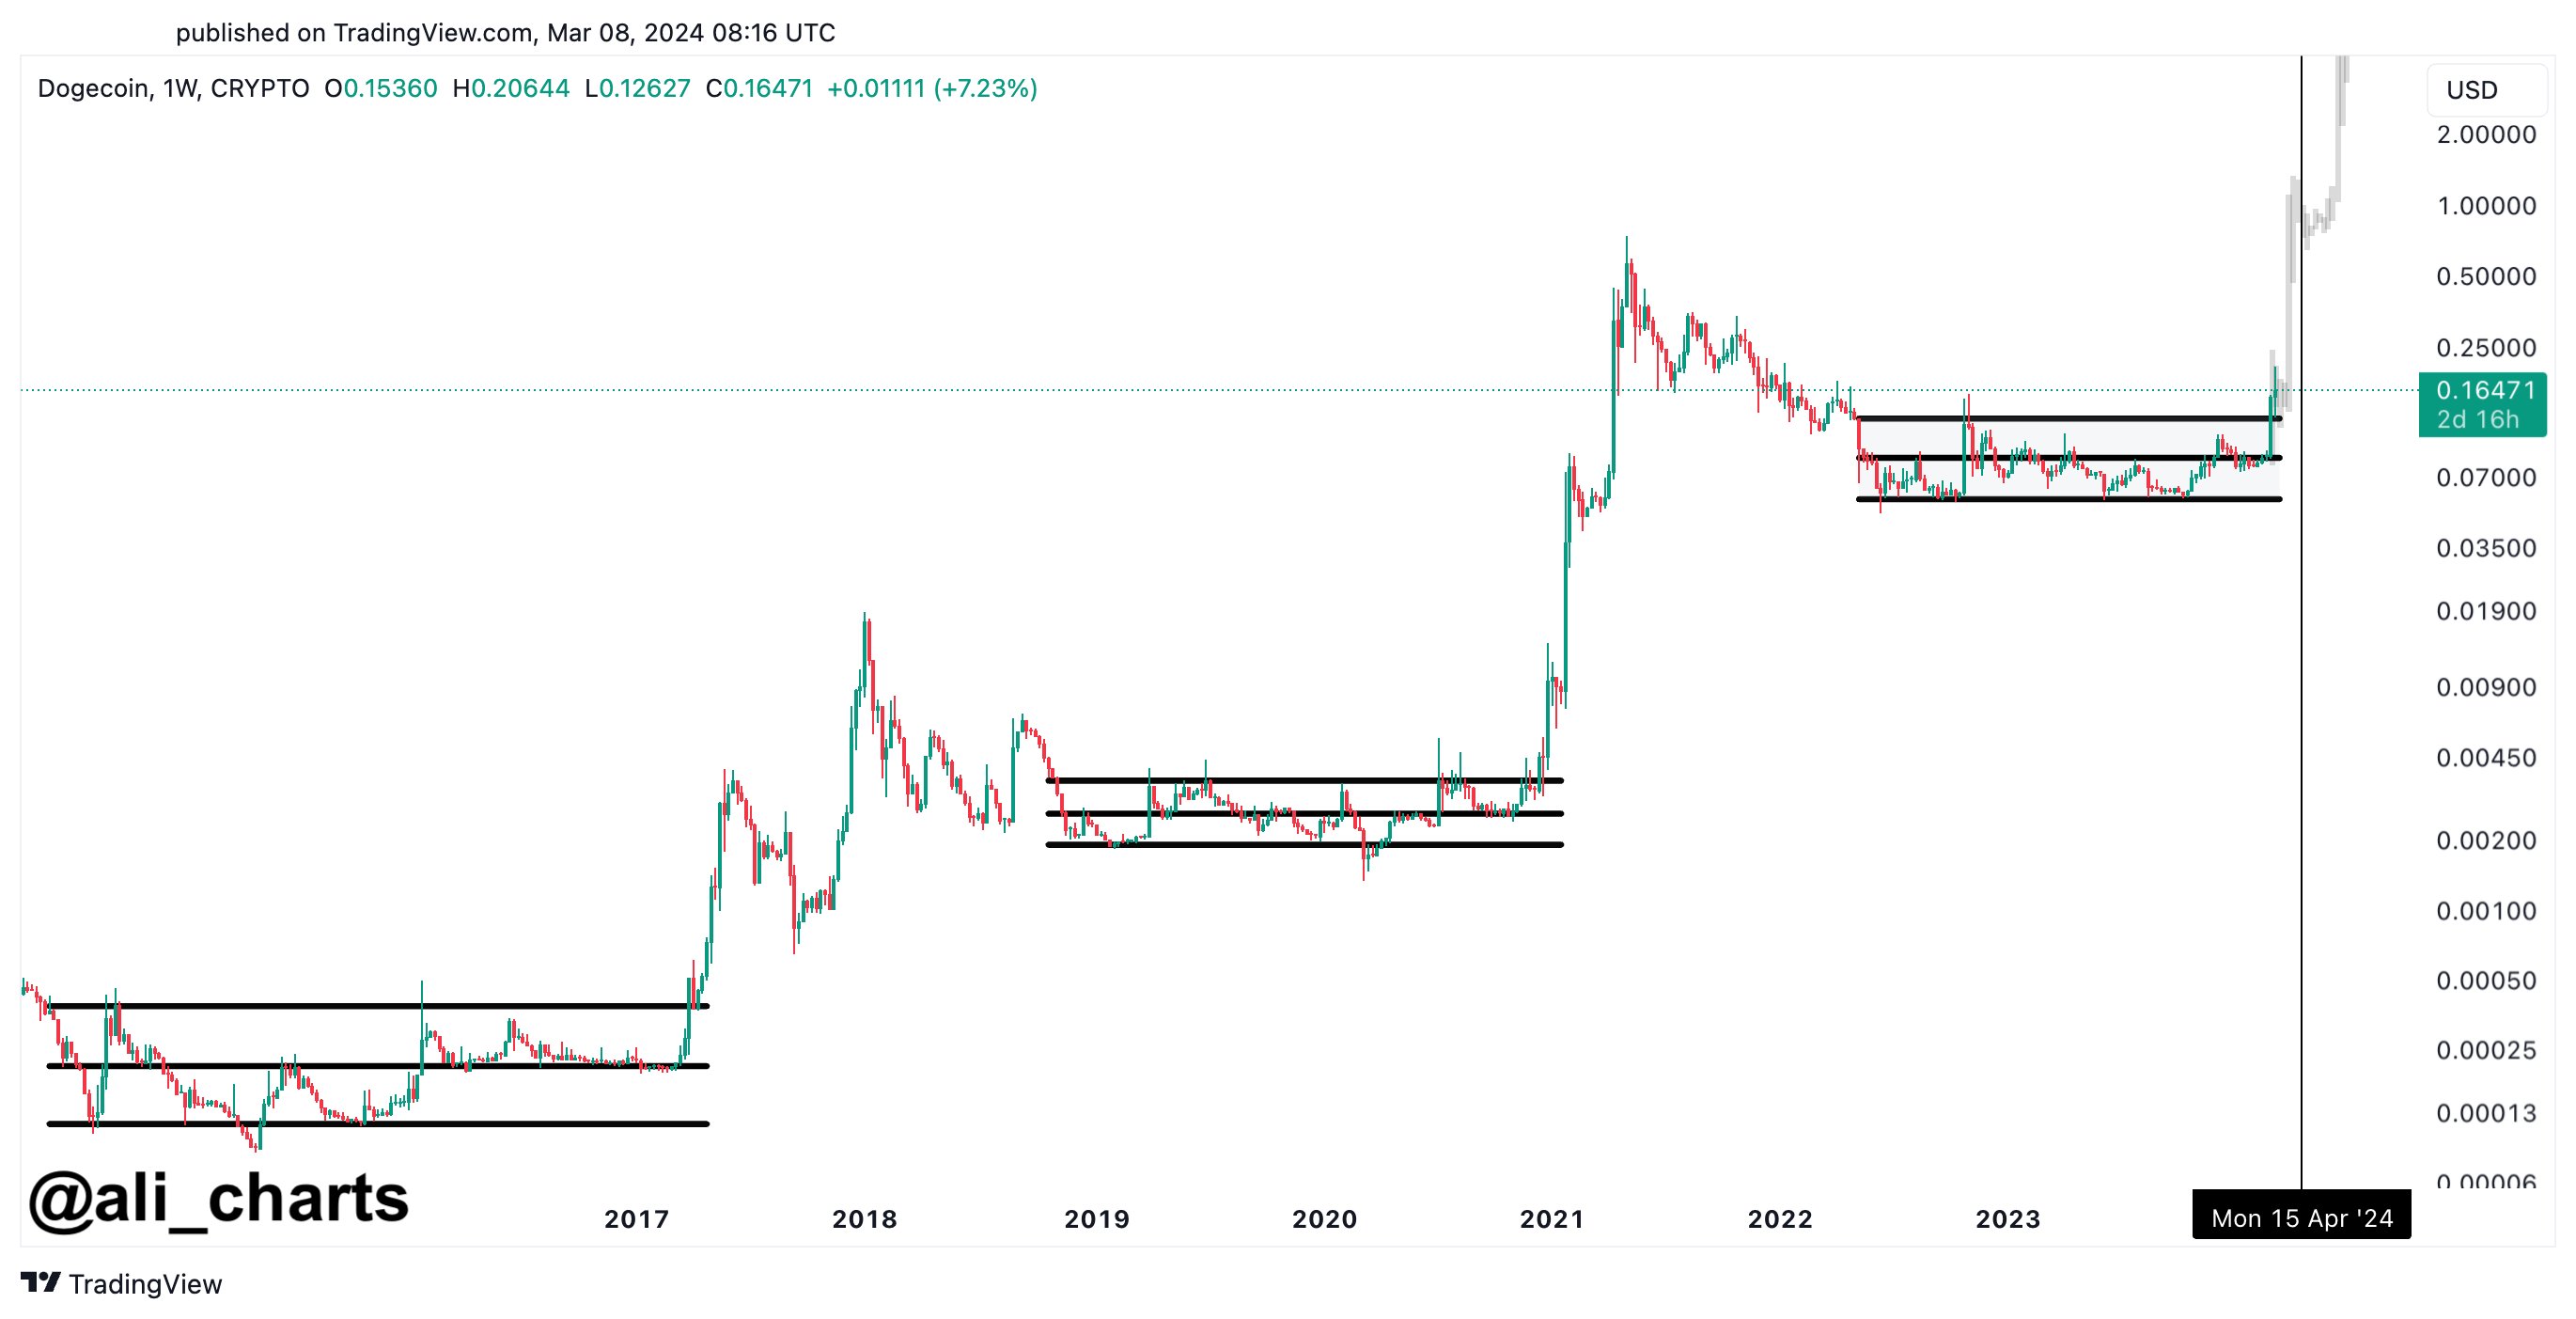
In a new post on X, analyst Ali has discussed a potential outcome for Dogecoin based on the historical pattern. Below is the chart for the weekly price of the memecoin shared by the analyst, which reveals a similar-seeming pattern that the asset has followed over the years.

Dogecoin Price Chart

As Ali has highlighted in the chart, before both of its previous two major bull runs, Dogecoin’s weekly price consolidated inside a specific parallel channel for a notable amount of time.

The “parallel channel” here refers to a pattern in technical analysis (TA) made up of two parallel trendlines inside which the price of the asset consolidates. Parallel channels can be of different types, like ascending and descending ones, but in the context of the current discussion, channels parallel to the time axis are relevant.

The upper trendline in such a pattern is drawn by joining together tops, while the lower line connects bottoms. When the price retests either of these lines, a reversal is more probable.

This means that a retest of the upper line could break the uptrend and cause the asset to go through a drawdown. Similarly, the lower line may be a source of support and help the price reverse itself back up.

However, a break out of either of these lines can imply a continuation of the trend in that direction. The graph shows that when the weekly price of Dogecoin saw breakouts like this out of the respective consolidation channels the last two times, it went through bull rallies.

In the past couple of years, it would appear that DOGE has once again gone through a similar period of consolidation as those previous two, and recently, the coin has been breaking out.

Ali has marked a potential trajectory that Dogecoin could follow in the chart based on the precedent set by these last two bull runs. “This may sound wild, but if history is any guide, Dogecoin $DOGE could hit $1 by mid-April!” says the analyst.

From the current cryptocurrency price, such a run would suggest an increase of more than 488% for the memecoin in less than a month and a half. Obviously, a rally like this would be super impressive if it ends up playing out like this.

It remains to be seen what trajectory Dogecoin follows now that it has seemingly broken free of its long parallel consolidation channel.

DOGE Price

When writing, Dogecoin is trading around $0.17, up 36% in the past week.

Dogecoin Price Chart