Buy Dogecoin Now? Analyst Believes DOGE Is Primed For A Surge

In an analysis shared via X, crypto analyst Ali Martinez elaborated on the ongoing price correction of Dogecoin (DOGE), positing that it is a consistent precursor to major bull runs, drawing on historical patterns to forecast future price movements.

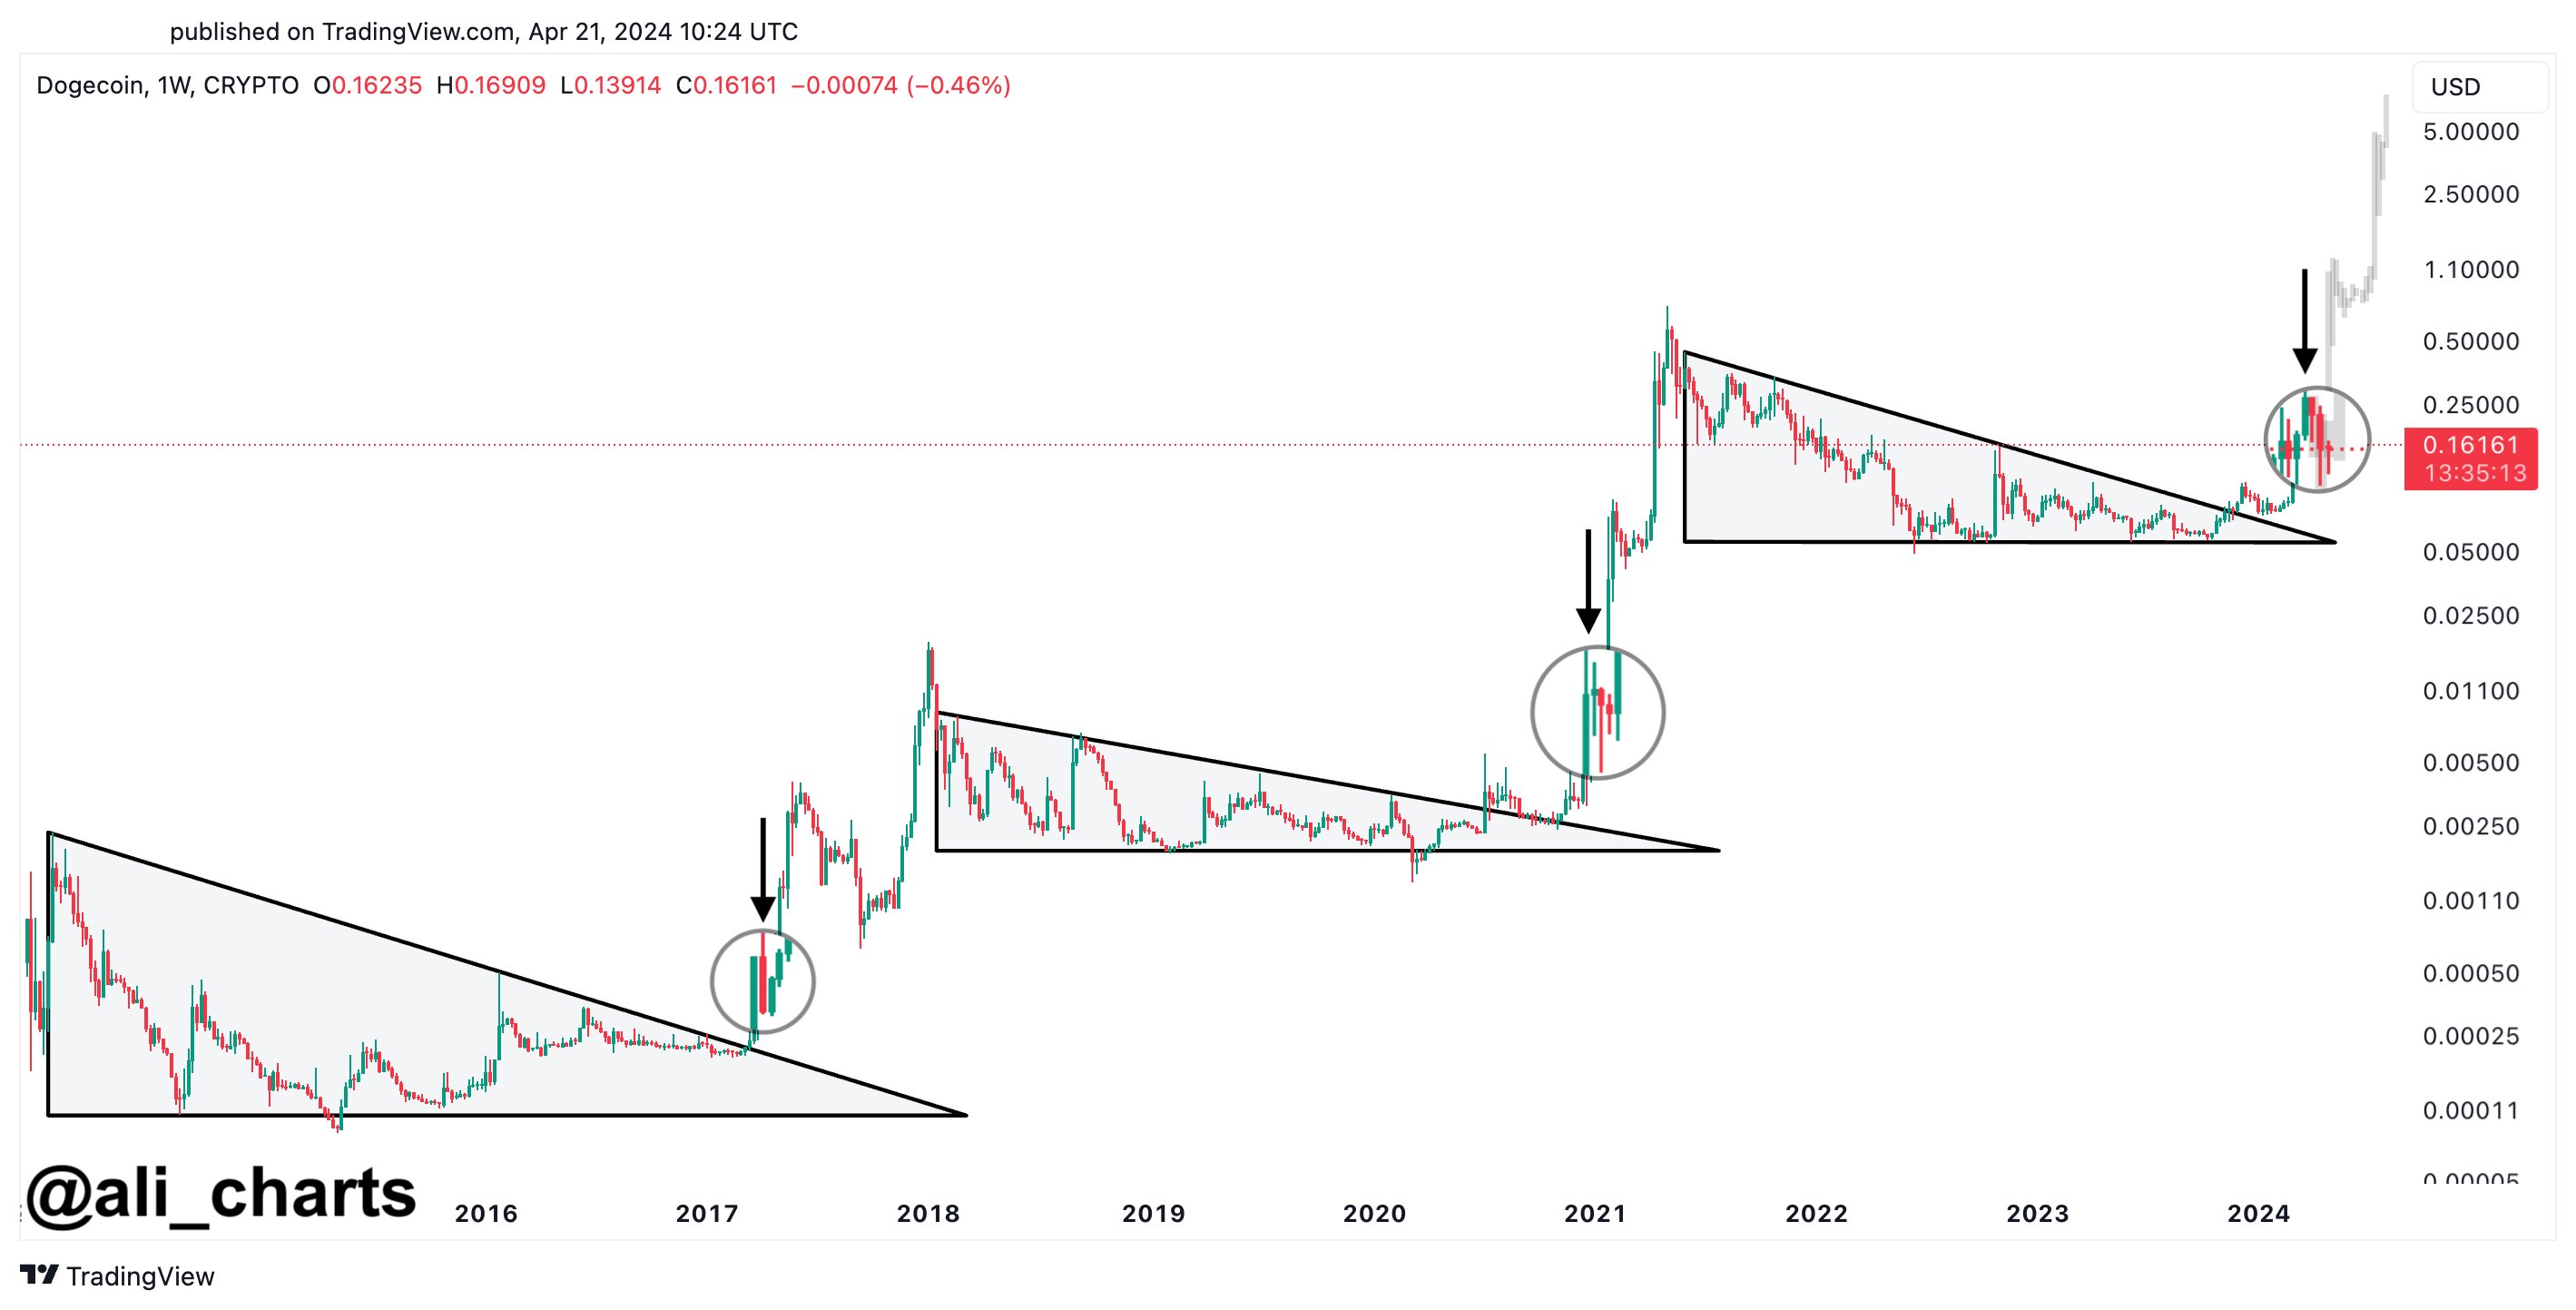
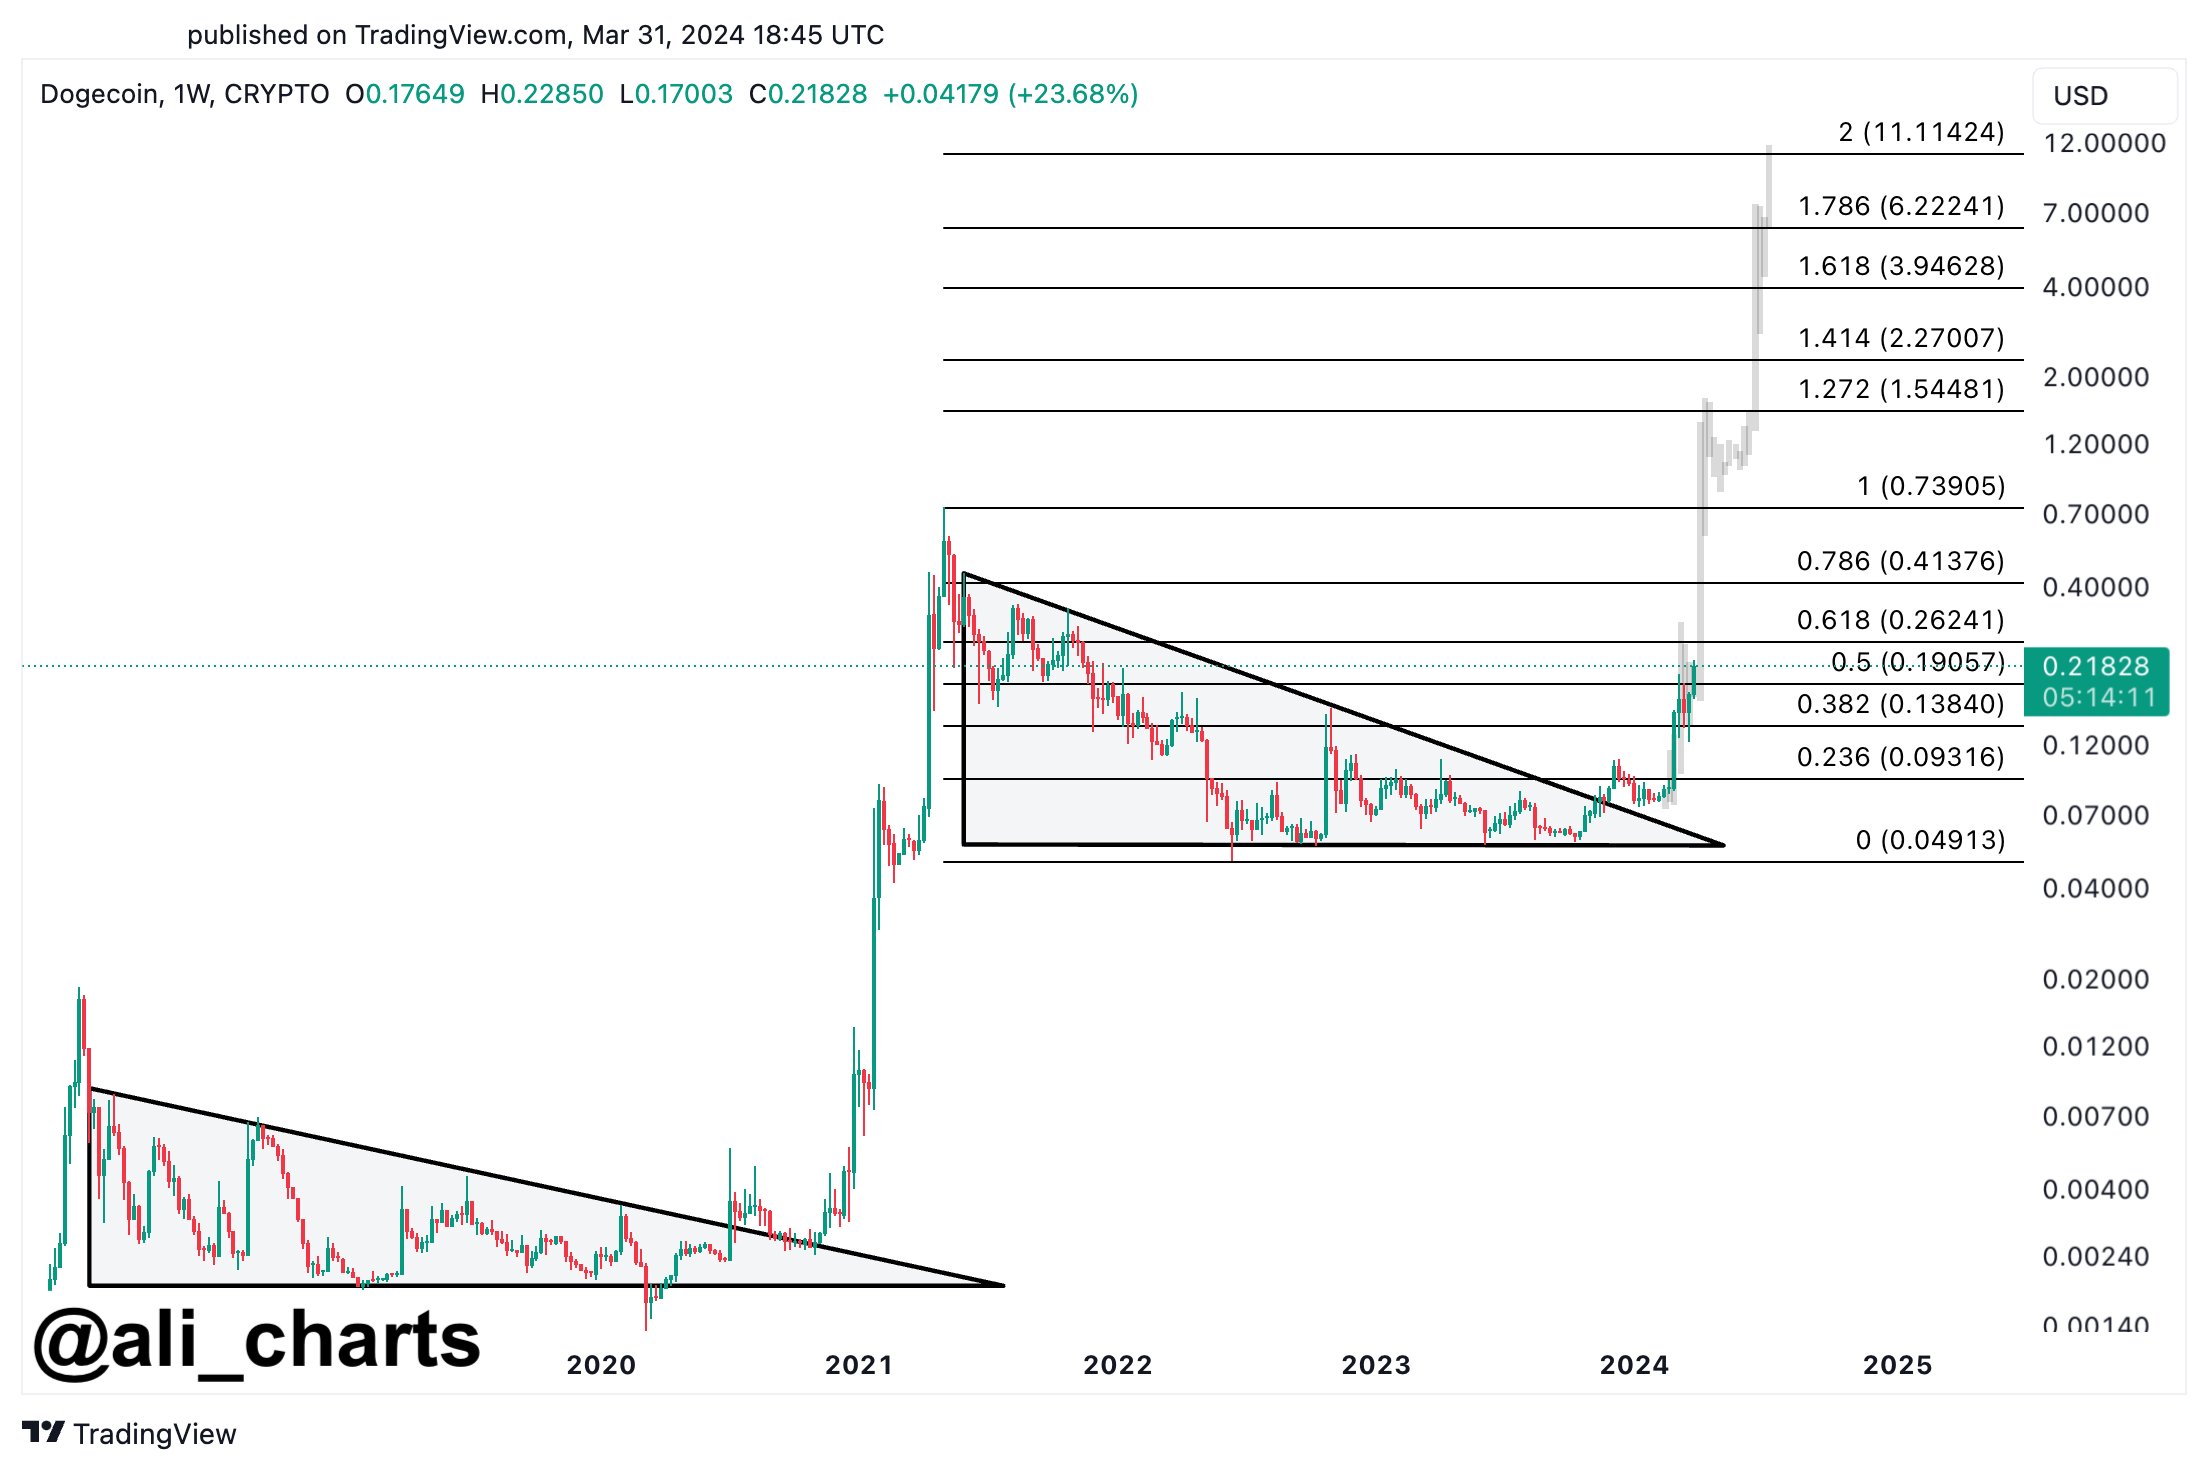
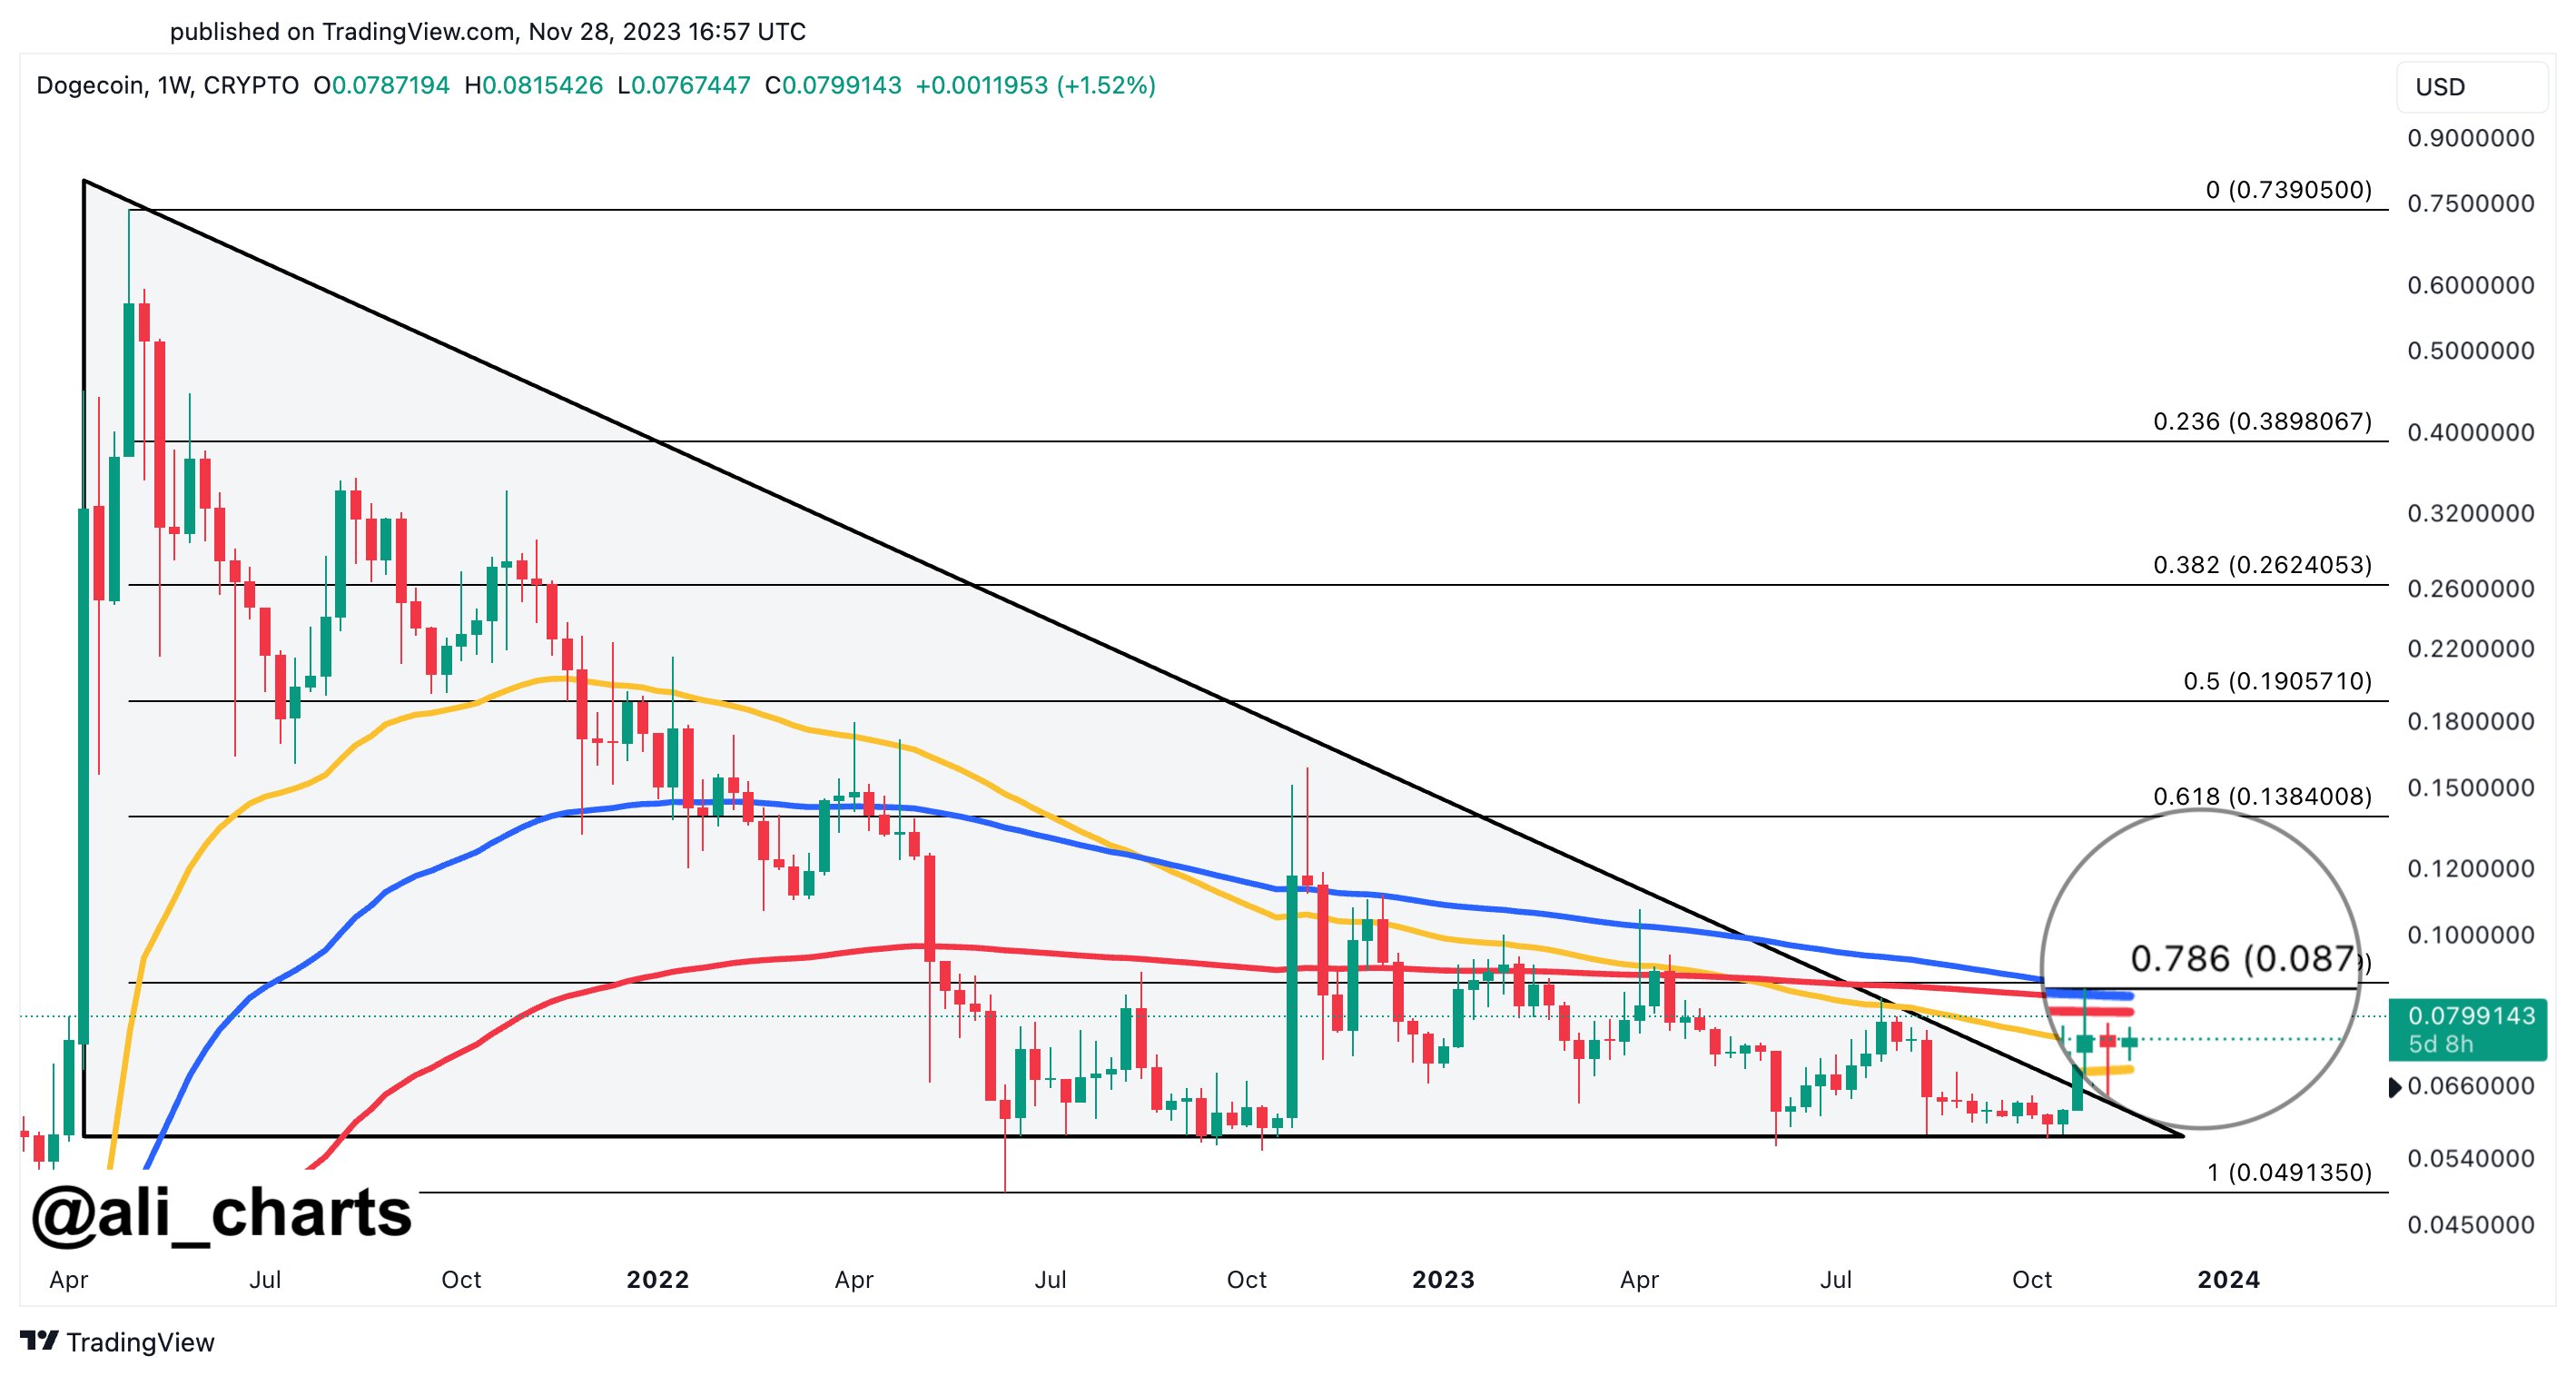
Martinez’s commentary centers on the chart pattern known as the “descending triangle.” This is a bearish formation that occurs when the price follows a downward trendline intersecting a flat support line. Typically, this pattern indicates a continuation of a downward trend, but in the context of Dogecoin, Martinez suggests it precedes significant bullish breakouts.

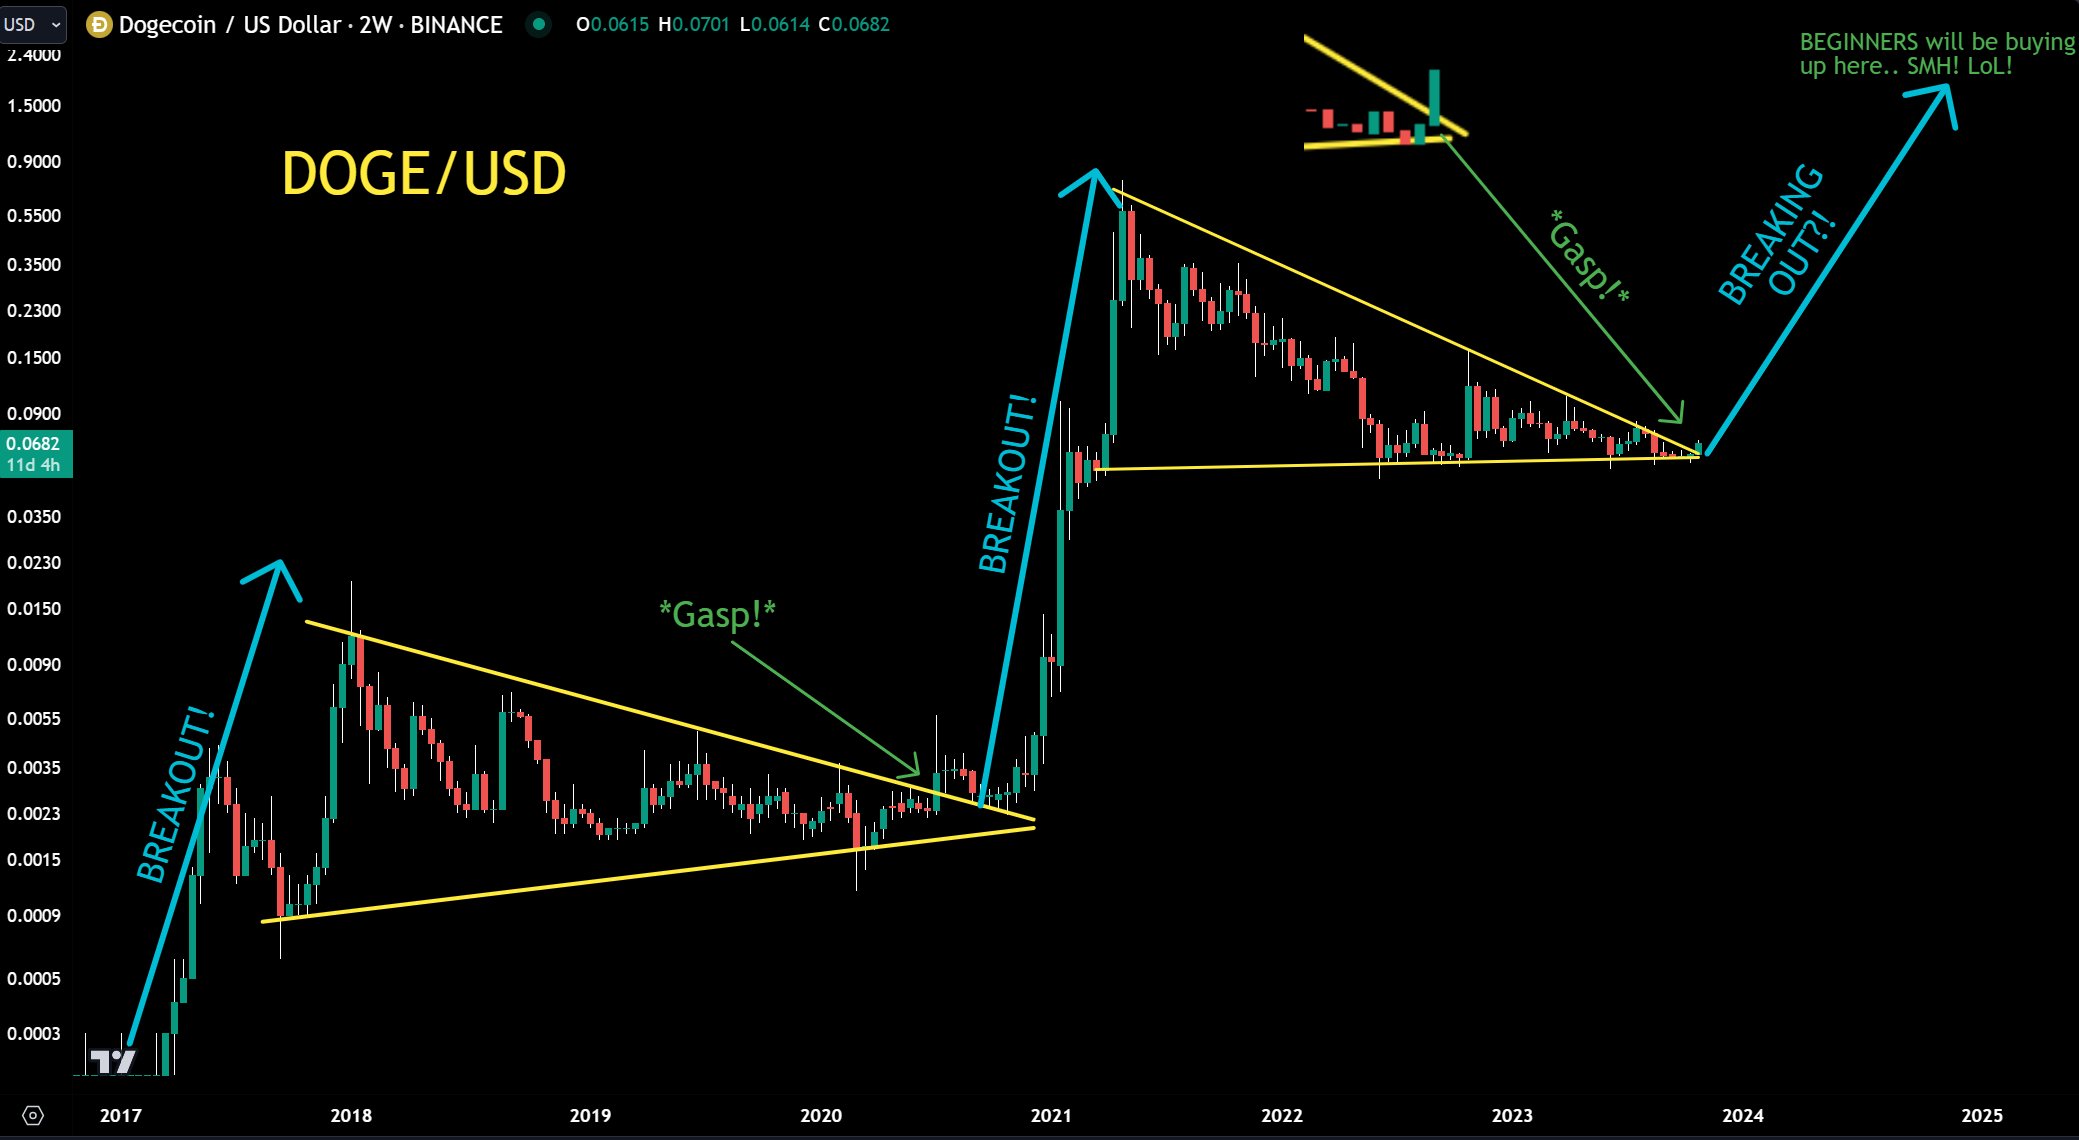
“The ongoing Dogecoin price correction is part of its usual behavior before massive bull runs! Let’s dive in,” Martinez shared. He explained the historical significance of this pattern in Dogecoin’s trading history: “In 2017, DOGE broke out of a descending triangle. Then, DOGE retraced by 40% before entering a 982% bull run!”

Martinez further analyzed more recent cycles to reinforce his observations, “In 2021, DOGE broke out of a descending triangle again. Then, DOGE retraced by 56% before skyrocketing by 12,197%!” According to Martinez, these retracements are not random but are characteristic of how Dogecoin has behaved in previous cycles, setting the stage for explosive gains.

The analyst drew parallels to the current market conditions: “Now, in 2024, DOGE has yet again broken out of a descending triangle! It is currently undergoing a 47% price correction, very similar to previous cycles, which could ignite the next DOGE bull run!” This assertion suggests that the current market downturn might be an opportune buying moment ahead of potential gains.

DOGE price analysis

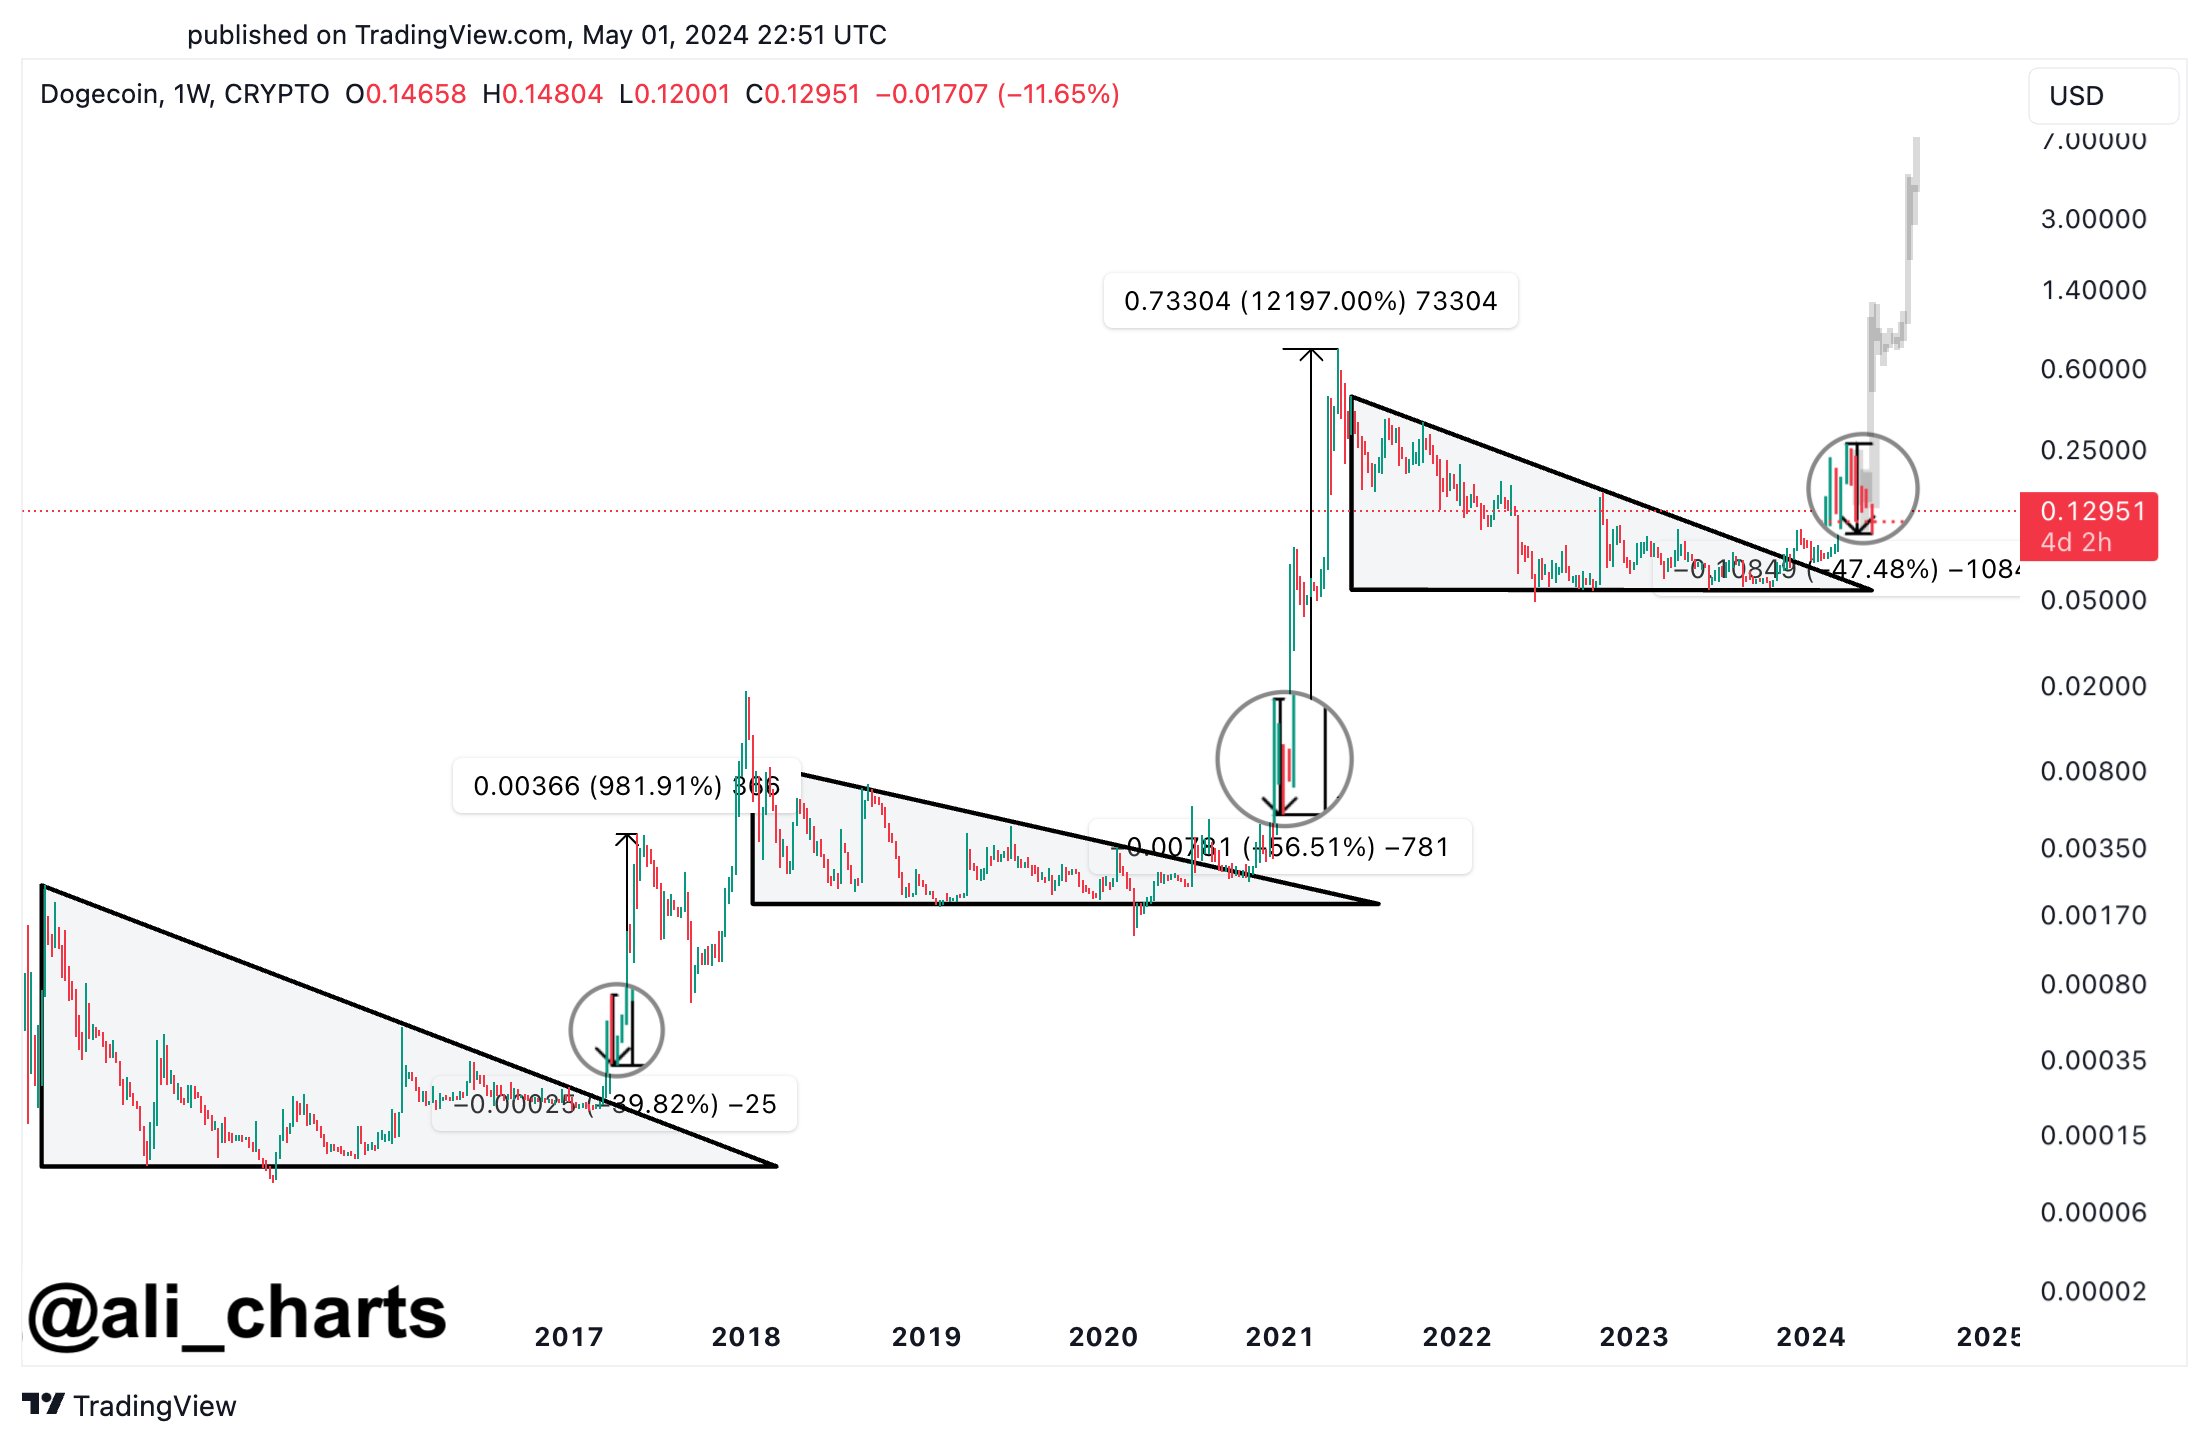
Martinez’s analysis underscores the cyclical nature of Dogecoin’s price movements, suggesting a pattern of sharp declines followed by dramatic recoveries. “Over the years, Dogecoin appears to mirror its previous bull cycles! All you need is a little bit of patience,” he concluded.

Short-Term Dogecoin Price Analysis

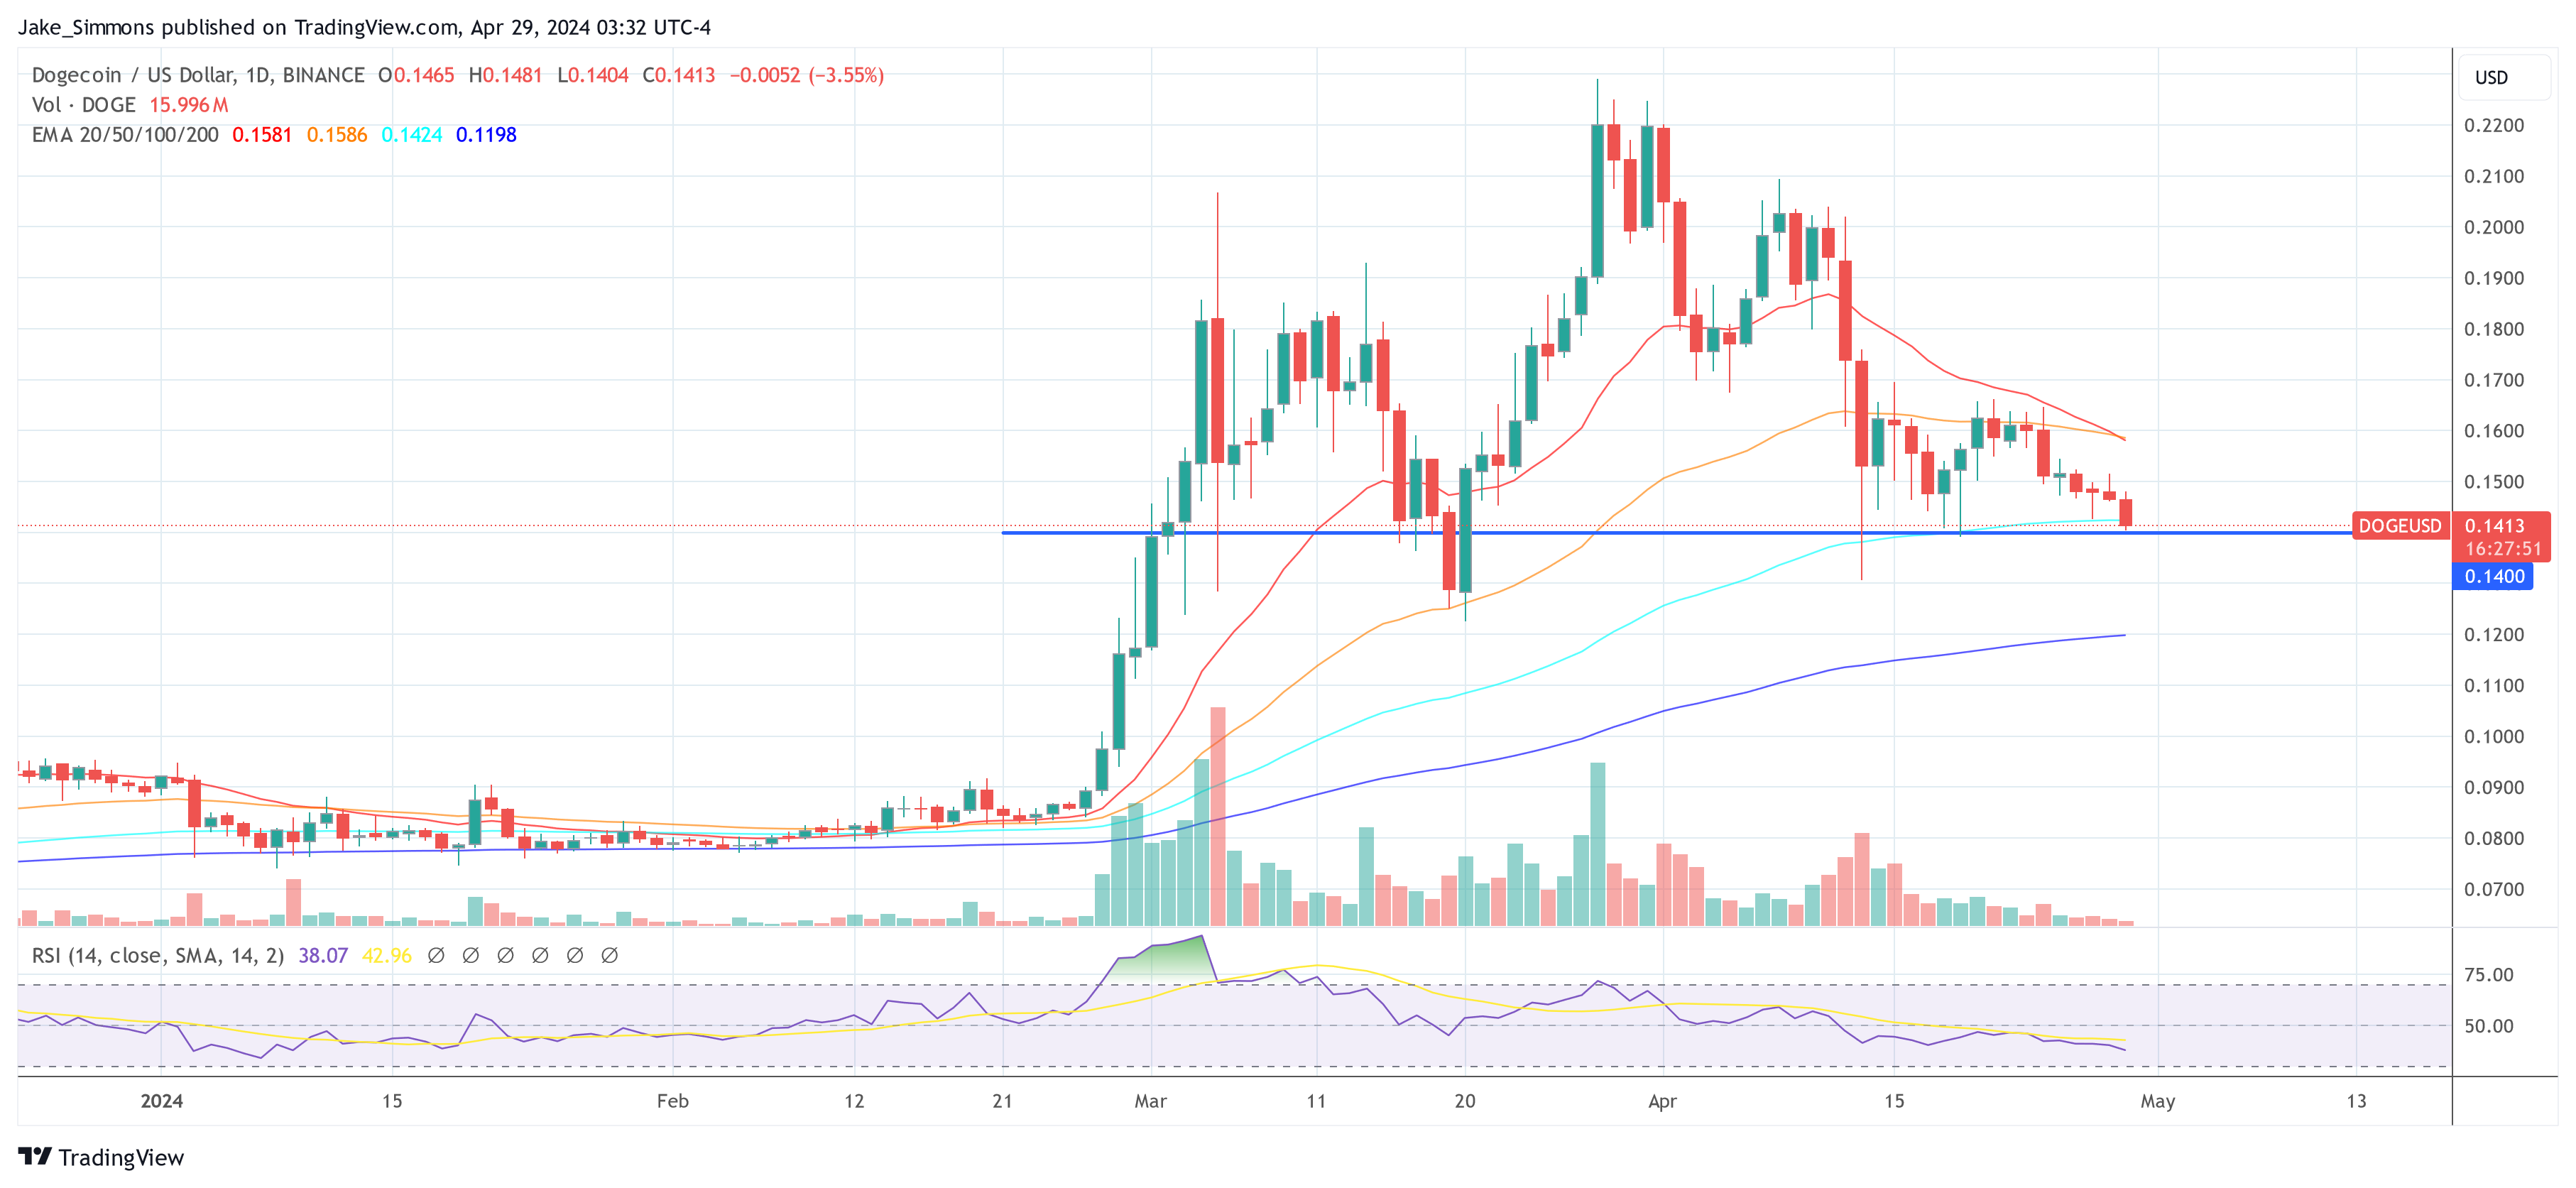
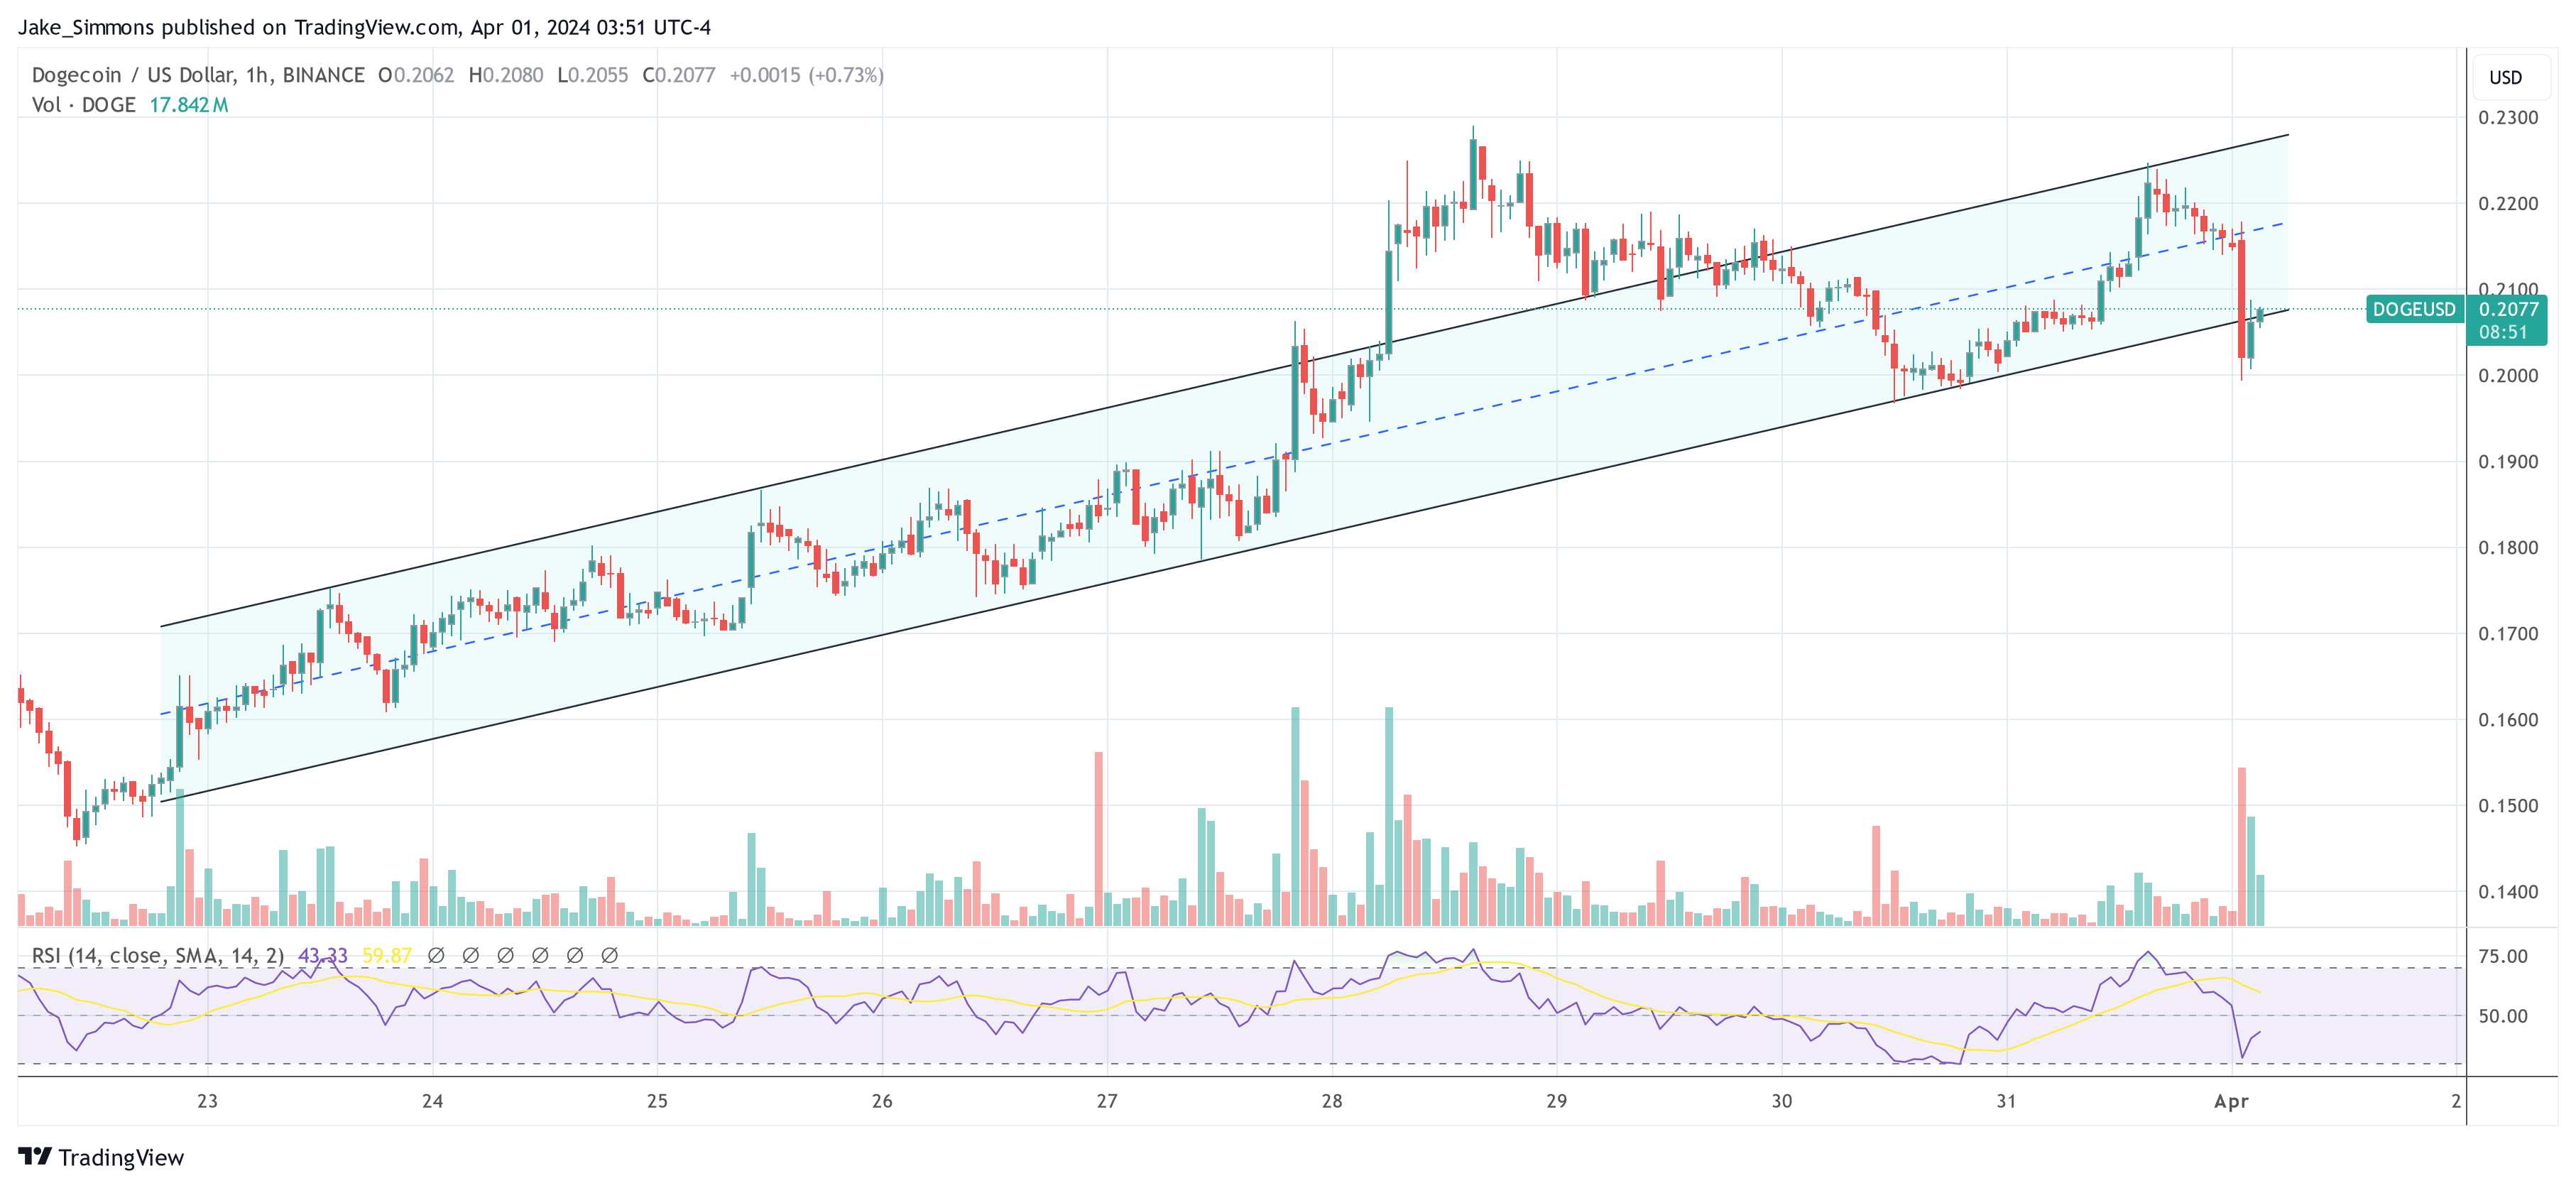
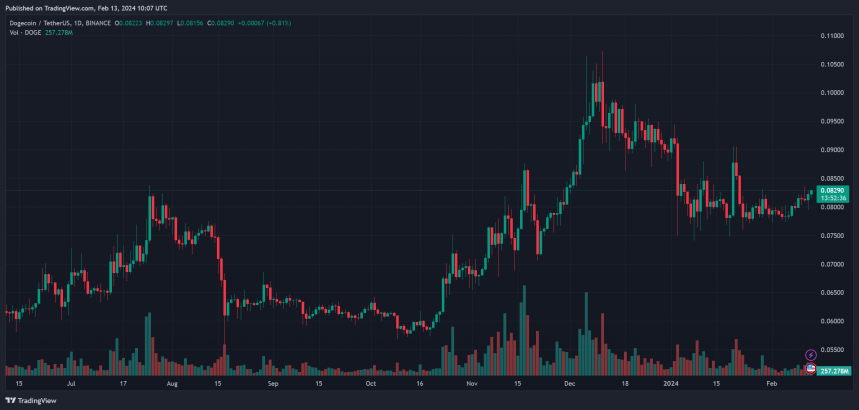
Amidst this optimistic prediction, the Dogecoin price is in a precarious scenario in the short-term. Since mid-April, DOGE has experienced significant technical resistance. Particularly, the DOGE price was consistently rejected at the 50-day EMA over multiple instances, indicating strong selling pressure at higher price levels.

Amid a broader market downturn, the trajectory was accentuated when Dogecoin’s price broke below the crucial 100-day EMA. This level, often watched by traders for signs of medium-term market direction, had previously offered support. The breach underscores a weakening market sentiment and could signal extended losses.

Dogecoin price

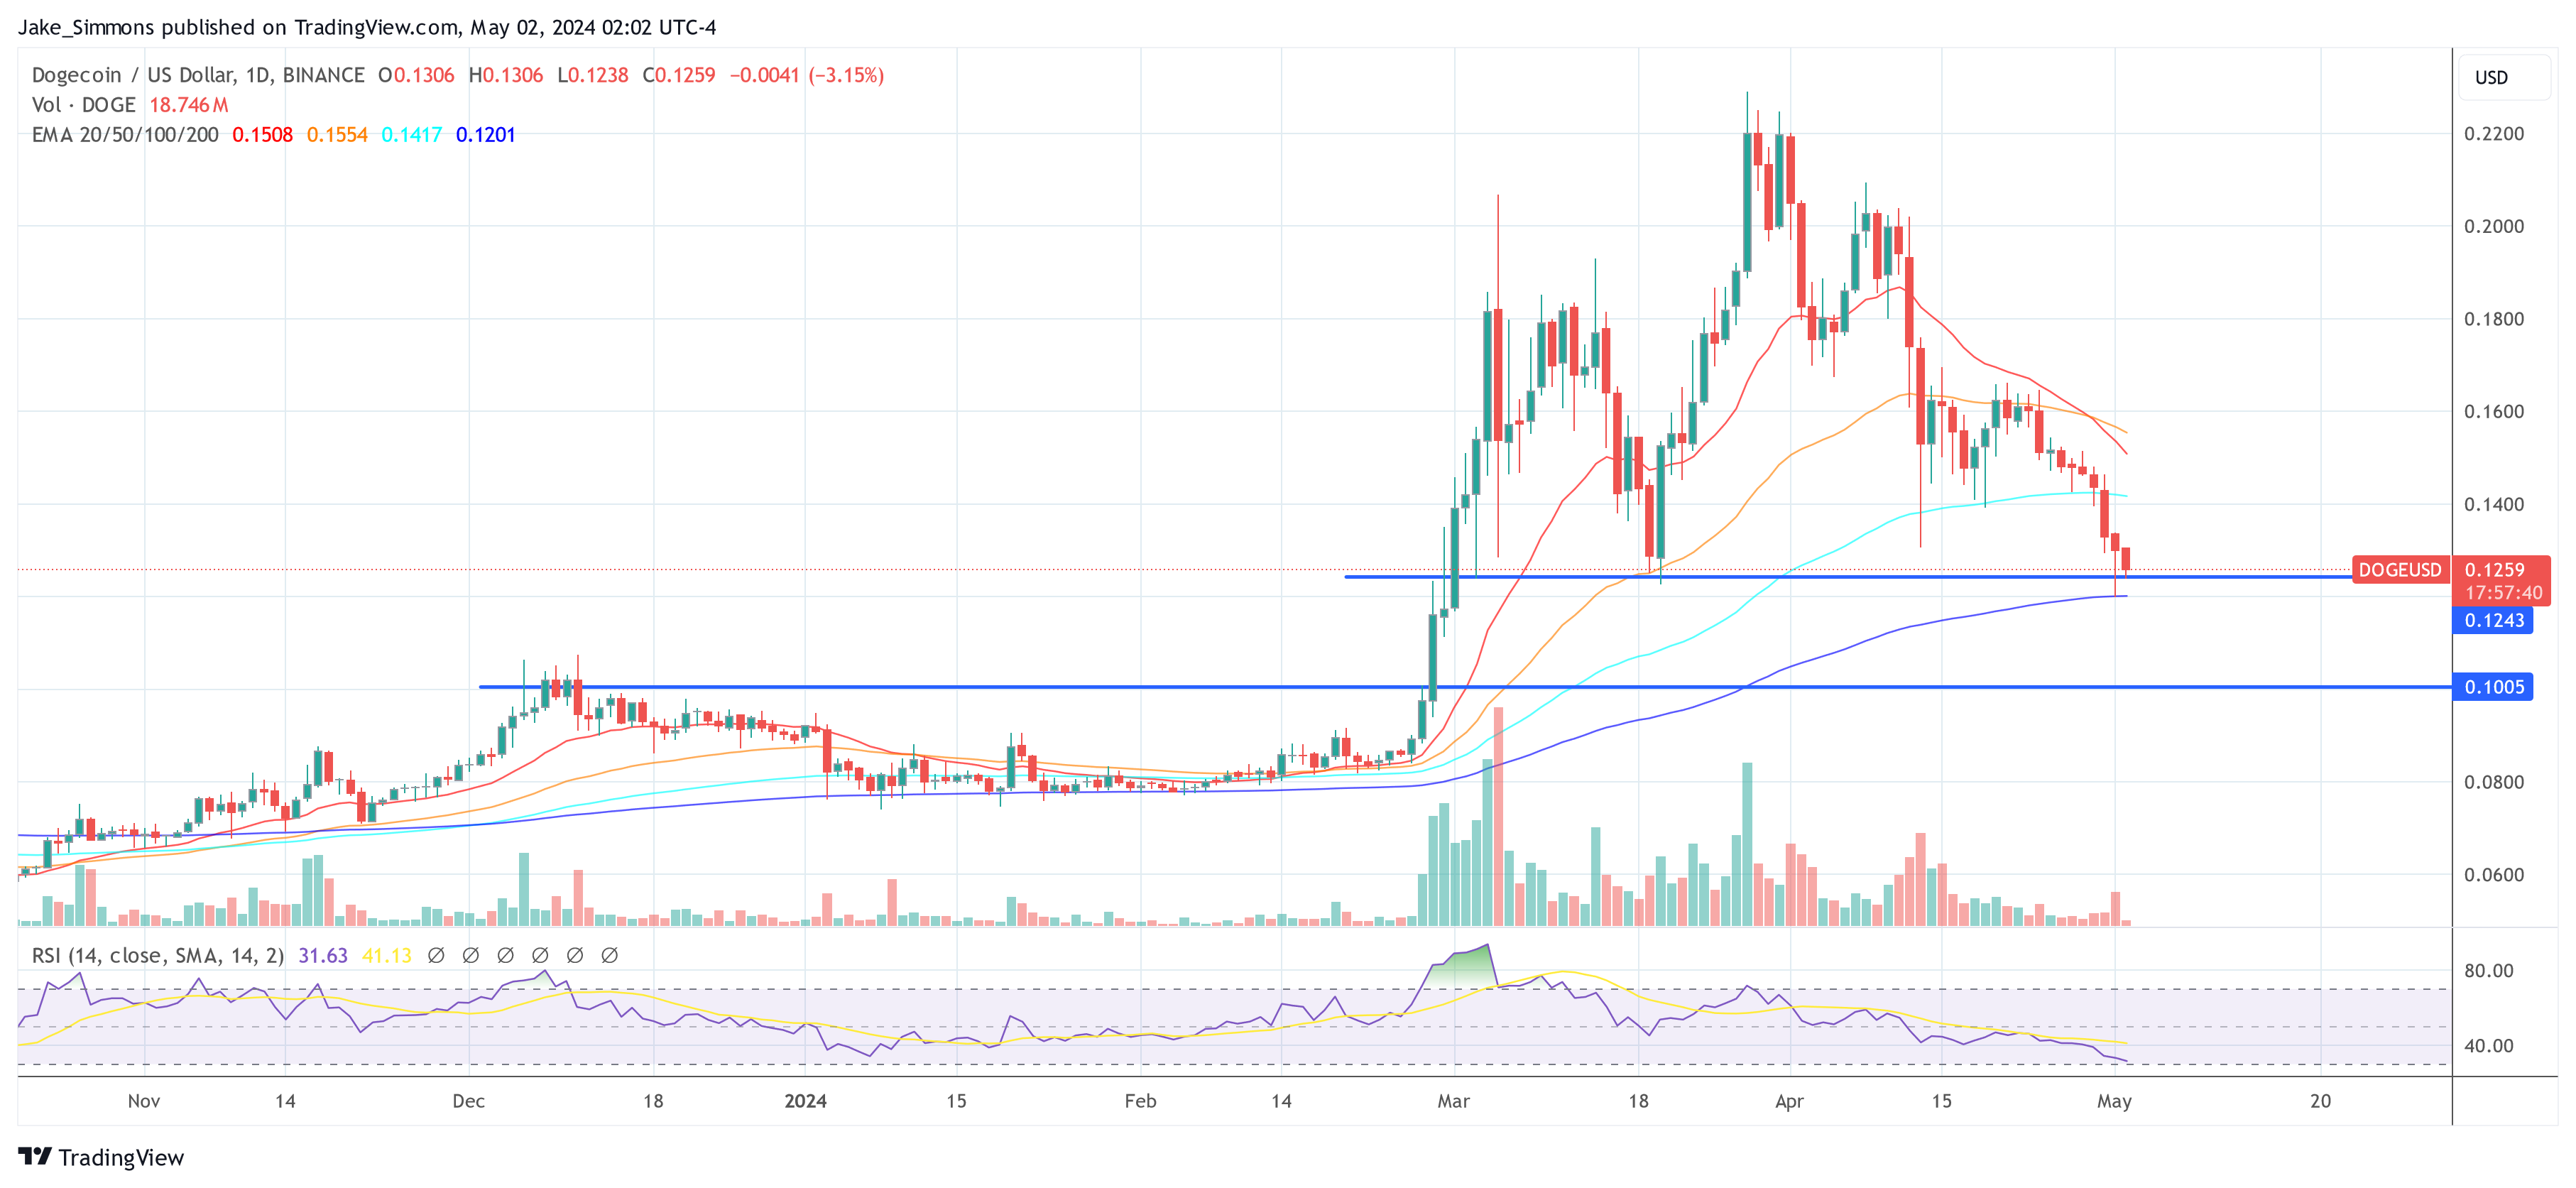
As of press time, Dogecoin’s price hovered near $0.1259 after narrowly holding above the 200-day EMA yesterday, a key psychological and technical barrier. This moving average is now a pivotal point for Dogecoin; its sustained breach on the daily chart could significantly alter the market structure, potentially triggering a slide towards the $0.1005 support level.

The Relative Strength Index (RSI) is at 31.63, edging close to the oversold territory but not conclusively signaling an imminent reversal. This indicates that while the market is nearing oversold conditions, the selling pressure has not fully abated. One last leg down might be necessary to get DOGE into “oversold” territory in order to mark a local bottom.

Alarm Bells Ring For Dogecoin: Bearish Signal Points To 40% Crash

Crypto analyst Josh Olszewicz is once again warning of a looming Dogecoin price crash. The analysis hinges on the Ichimoku Cloud, a comprehensive indicator that provides information on support/resistance levels, momentum, and trend direction. Olszewicz’s analysis points to two specific technical phenomena on the 1-day (1D) chart of DOGE against the US dollar (DOGE/USD). Via X, he remarked “1D DOGE: bearish TK cross + bearish Kumo breakout.

Bearish Signals For Dogecoin

The bearish TK cross refers to the bearish crossover between the Tenkan-Sen (conversion line) and the Kijun-Sen (baseline) within the Ichimoku Cloud system.

Dogecoin price analysis

The Tenkan-Sen, which is a faster-moving line typically calculated as the midpoint of the highest high and lowest low over the last nine periods, crossing below the Kijun-Sen, a slower line computed as the midpoint of the highest high and the lowest low over the past 26 periods, is considered a bearish signal.

It suggests that short-term prices are falling below the base level of prices over the last month, indicating potential further downward movement.

The Bearish Kumo breakout: The ‘Kumo’, which translates to ‘cloud’, is part of the Ichimoku Cloud indicator and is formed between two other lines: the Senkou Span A and the Senkou Span B. It represents a key area on the chart that can act as support or resistance.

In the context of Olszewicz’s analysis, a ‘bearish Kumo breakout’ implies that the price has broken through the cloud downwards. This breakout is seen as a confirmation of a bearish trend. The fact that the price is below the Kumo suggests that the overall market sentiment for DOGE is negative, with the Kumo now likely acting as resistance to any upward price movement.

The chart by Olszewicz shows DOGE trading at $0.15 with the cloud plotted behind the price action, appearing green above and red below the price lines. The cloud turning green represents a bullish future potential, but the price below both the cloud and the Tenkan-Sen/Kijun-Sen crossover indicates bearish current circumstances.

A 40% Price Crash Looming?

This gives weight to Olszewicz previous DOGE price analysis. As NewsBTC reported, the crypto analyst warned of a potential Head and Shoulders (H&S) formation on the DOGE/USD 12-hour chart which could be validated soon.

The formation is characterized by two shoulders flanking a distinctive head, with the neckline at approximately $0.14 being pivotal. Should Dogecoin’s price break below this critical support, the prophecy of the H&S pattern would likely manifest, potentially triggering a sell-off towards the $0.10 to $0.09 region.

This target area aligns with the 1.618 and 2.0 Fibonacci extension levels, suggesting a price crash of around 40% from the neckline. While the pattern has not yet been confirmed, with the price still above the crucial $0.14 support level, its presence serves as a cautionary signal to the market.

The technical confluence of the bearish TK cross and the bearish Kumo breakout in Olszewicz’s recent analysis only reinforces the possible bearish scenario that lies ahead for Dogecoin. Market participants are recommended to keep a close watch on the $0.14 level, as a decisive break below could validate the bearish outlook and set the stage for the anticipated decline.

At press time, DOGE traded at $0.1413.

Dogecoin price

Head And Shoulders Alert: Dogecoin Could See A Price Crash Soon

Crypto analysts are sounding the alarm on Dogecoin as a classic chart pattern, known for predicting bearish trends, has emerged. Technical analyst Josh Olszewicz, @CarpeNoctom, flagged a potential Head and Shoulders (H&S) formation on the DOGE/USD 12-hour chart on X, hinting at a possible significant price drop if the pattern validates.

The H&S pattern is a technical indicator traditionally viewed as a bearish signal within the trading community. The pattern is composed of three peaks, with the central peak (the head) being the highest and the two outside peaks (the shoulders) being lower and approximately equal in height. The line connecting the lowest points of the two troughs (the neckline) can be horizontal or sloped and represents a critical support level.

Dogecoin Must Hold $0.14

In the case of Dogecoin’s 12-hour chart, the price has completed the left shoulder and the head, with the right shoulder currently forming. The neckline of this H&S pattern is identified at approximately $0.14, as annotated by Olszewicz. This level is crucial; a decisive break below could confirm the bearish forecast suggested by the H&S formation.

Dogecoin head & shoulder pattern, 12-hour chart

Another technical detail present on the chart is the Fibonacci retracement levels, which are horizontal lines indicating where support and resistance are likely to occur. They are based on Fibonacci numbers, a sequence famous in mathematics and nature for its proportionality.

Here, the 0.5 Fibonacci level aligns with the left shoulder around $0.18, while the 0 level coincides with the peak at approximately $0.23. These levels are key to determining the potential support and resistance areas in the market.

Olszewicz has also highlighted a projected target area based on the H&S pattern’s typical behavior. This bearish target is identified using the height of the pattern from the head’s peak to the neckline, projected downward from the point of the neckline break. The target box, marked in green, shows a potential decline to $0.10 to $0.09, coinciding with the 1.618 and 2.0 Fibonacci extension levels. A fall to this level could lead to a price crash of 40%.

The importance of the H&S pattern lies in its reliability as a trend reversal signal. It validates when the price breaks below the neckline following the formation of the right shoulder. For traders and investors alike, this pattern serves as a cautionary tale to brace for potential downside risks.

As of the latest chart by Olszewicz, the neckline has not been breached, and the pattern has yet to be confirmed. It is critical for observers to watch the $0.14 level closely, as a break below it would likely activate a sell-off, fulfilling the H&S prophecy. However, until such a break occurs, the pattern remains a watchful indicator rather than a confirmed trend reversal.

In summary, Dogecoin’s price chart is showing signs that could concern bullish investors. If history is any guide, the emerging H&S pattern, closely watched by analysts like Olszewicz, suggests a possible downward move in Dogecoin’s value in the near future. However, only a decisive break below the neckline will validate this pattern, turning a watchful eye into a bearish outlook.

At press time, DOGE traded at $0.1509.

Dogecoin price

Dogecoin To $1: Analyst Thinks Dream Milestone Could Be Hit In Coming Weeks

An analyst has explained how a pattern forming in the Dogecoin price may suggest a rally to $1, if historical trend repeats this time as well.

Dogecoin 1-Week Price Appears To Be Forming A Classic Pattern

In a new post on X, analyst Ali has discussed how DOGE seems to have been showing a classic pattern in its weekly price once again. This trend involves a technical analysis (TA) pattern called the “Descending Triangle,” which, as its name suggests, is shaped like a triangle.

The pattern involves two trendlines between which the price of the asset consolidates; one of these is a line slopped downwards while the other is parallel to the time-axis. This property of the price converging downwards as it goes through the pattern is why it has descending in its name.

Like other TA consolidation patterns, the upper line of the Descending Triangle also provides resistance to the commodity, making tops more probable to form at it. Similarly, the lower line acts as a point of support and can help the price reverse back upwards.

A break out of either of these lines may result in a continuation of the trend in that direction. This means that a break above the triangle can be a bullish signal, while one below could suggest the dominance of bearish momentum.

Similar to the Descending Triangle, there is also an Ascending Triangle in TA, which works much like it, except for the fact that the parallel axis makes the upper line, connecting together tops, while the lower line ascends up as it joins higher lows.

Now, here is the chart shared by Ali that highlights a pattern that DOGE’s 7-day price has been forming recently:

Dogecoin Descending Triangle

From the graph, it’s visible that the Dogecoin 1-week price had been trading inside a long Descending Triangle between 2021 and this year, but the meme coin found a break earlier and has since registered some notable uplift.

Recently, though, the cryptocurrency has reached a stage of sideways movement. This, however, may not entirely be a bad thing, as DOGE has also seen a similar trend of a Descending Triangle break followed by consolidation in the past as well.

As is visible in the chart, the previous two such formations led to Dogecoin witnessing some very significant growth. As such, the latest one may also prove to be bullish, if this historical pattern continues to hold.

“Based on past trends, we might just see DOGE rocket towards $1 in the coming weeks!” explains Ali. From the current spot price, such a potential rally would mean a growth of a whopping 525% for the coin.

DOGE Price

Dogecoin’s price action has been quite stale since the price plunge earlier in the month, as the asset’s price is still trading around $0.16.

Dogecoin Price Chart

Dogecoin Price Poised For Massive 600% Rally In April: Crypto Analyst

Dogecoin, a frontrunner in the meme coin genre of crypto, is showing bullish signals on its technical charts that could indicate an impending rally, according to noted crypto analyst Ali Martinez. Via X, he stated:

I feel my fellow degens have been distracted with the new shiny memecoins, but Dogecoin remains the most important altcoin in this sector. From a technical perspective, DOGE seems to mirror the 2018-2021 pattern. If so, DOGE could be at the very beginning of a massive parabolic bull run!

Dogecoin price projection

The weekly DOGE/USD price chart presents a descending triangle pattern, typically bearish, that has emerged since its peak in May 2021. However, the price action of recent months has been decidedly bullish, with Dogecoin breaking above the triangle’s upper trendline already in November 2023. This move invalidated the bearish sentiment often associated with this pattern, signaling a strong shift in market dynamics.

With the monthly close for March, the Dogecoin price has crossed the significant 0.5 Fibonacci retracement level of the downtrend, situated at approximately $0.19057, hinting at further upside potential. At press time, DOGE traded at $0.2072 reflecting an 86% increase in March.

The Fibonacci retracement levels laid out on the chart are based on the swing high and low of the previous market cycles. If Dogecoin continues to adhere to the Fibonacci levels as it has historically, the immediate target would be the 0.618 level at $0.26241, followed by the 0.786 level at $0.41376 and the all-time high at $0.73905.

Extending into the price discovery, the Fibonacci extension levels are mapped out at $1.54481 (1.272 Fib level), $2.27007 (1.414 Fib level), and $3.94628 (1.618 Fib level), and $6.22241 (1.786 Fib level). These figures represent future areas of interest where the price might find resistance in the event of a continued upward trajectory.

Martinez’s analysis also includes a projection based on Dogecoin’s price action from the 2018-2021 bull market, represented by the light gray line on the chart. This projected trajectory is extrapolated from the past price pattern and suggests a parabolic rise for DOGE. Notably, the DOGE price could already skyrocket in April if history repeats.

According to Martinez’s projection, if Dogecoin follows the historical pattern, its price could potentially surge to nearly $1.5 by April, which would represent a 600% rally. This price target is further supported by the Fibonacci extension levels, with $1.54481 (1.272 Fib level) serving as a prospective hurdle.

Subsequently, the DOGE price could initially require a slowdown and remain stuck in a consolidation zone between the previous all-time high and the 1,272 Fib for several months. The rally could then continue according to Martinez’s projection.

In a similarly explosive move, DOGE could rise above $1.50 and then pulverize the Fib levels at $2.27007 (1.414 Fib level), $3.94628 (1.618 Fib level), and $6.22241 (1.786 Fib level) until the rally stalls again at just over $6.30. A final move could see Dogecoin break above $11.11 (2.0 Fib level) where it could find a cycle high, according to the analyst.

At press time, the DOGE price was at $0.2077.

Dogecoin price

Dogecoin To $100? Crypto Analyst Reveals The Key

Dogecoin has seen a number of bullish predictions over the last month, especially with the recovery of the crypto market. The latest in this long line of bullish predictions is that of one crypto analyst who goes by southofearth on TradingView. According to the analyst, the DOGE price will rally higher than expectations.

Dogecoin Price Maintains Previous Patterns

The analysis which was posted on the TradingView website shows the trajectory of the Dogecoin price since it was launched back in 2013. The chart highlights the performance of DOGE in the years leading up to each Bitcoin halving and how this can pinpoint its rally point.

Both times have seen the Dogecoin price put on a massive rally after each halving, suggesting that it is a bullish trigger for the meme coin. With the next Bitcoin halving expected to take place sometime in April, the DOGE price looks to be gearing up for another breakout.

The crypto analyst points out that DOGE is currently showing a similar pattern as it had in the previous years, although with a bit more volatility. But because it is mostly maintaining this pattern, the chances of it following the same patter of rallying are high.

They also explain that the markets are moving faster, and the 4-year cycle that investors are used to might be getting shorter. Given this, the bull market begins faster, although with longer bear markets. In this case, the analyst believes that the DOGE price could top out in October of 2024 instead of in 2025 as expected.

Dogecoin price chart from Tradingview.com

DOGE Price Targets For Bull Market

Southofearth also shared their price targets for Dogecoin going forward, with four targets in total. The first puts the price at $1, which looks to be the start of the breakout. From there, the next target is placed at 1005 from the first target at $2.

Then another jump to $14 is expected before running all the way to $27. According to the crypto analyst, $27 is the next all-time high price for DOGE going by what has happened to the coin in previous years.

However, it doesn’t end there, as the analyst predicted that the DOGE price could possibly rise to $100 and above. But for this to happen, there has to be “hyperbitcoinization happens due to dollar index breaking down,” the analyst explains.

If the crypto analyst is correct, then the DOGE price could see a 16,000% move from here. However, the possibility of this happening is very slim given that DOGE’s market cap is already at $20 billion, and such a move would make it larger than Ethereum.

Dogecoin price chart from Tradingview.com

Analyst Predicts Massive Rally For Dogecoin Price With A $1 Target, Here’s How

Dogecoin recently jumped to the $0.2 level for the first time since November 2021 amidst a month of exceptional bullish price action. Notably, DOGE is currently up by 128% this month and 97% in the past seven days, giving DOGE holders something to be happy about. According to a crypto analyst, this price surge is expected to continue and go parabolic to the $1 mark in this market cycle. 

Dogecoin Set To Perform Exceptionally Well

Current market dynamics and bullish sentiment have seen DOGE shooting up in market capitalization after an extended consolidation period. A recent surge past the $0.20 price level saw DOGE briefly overtaking Cardano and jumping up to the eighth position in market cap rankings. 

In a post shared on social media platform X, a crypto analyst known as Altcoin Sherpa, noted this recent surge as a sign of better things to come in this cycle. While the analyst didn’t give a particular price point, he noted that a $1 price per Dogecoin wouldn’t be too surprising.

Interestingly, the $1 level would mean a ride to uncharted territory for DOGE, as the crypto is yet to cross above $0.8. A surge to $1 would mean a 465% surge from the current price level and past its current all-time high of $0.74.

The analyst noted that he doesn’t expect DOGE to perform as well as other meme-inspired cryptocurrencies with lower market caps like WIF, PEPE, and BONK, but its deep liquidity provides more of a stable investment. He also noted that DOGE and SHIB will probably take turns leading gains among meme coins.

Meme Coins Continue To Shine

The meme coin market has grown significantly since the early days of DOGE’s creation, which started out as a joke. Since then, tons of meme coins have been created, but Dogecoin continues to solidify its position as the largest meme coin in terms of market cap, demonstrating signs of renewed enthusiasm every so often.

At the time of writing, DOGE is trading at $0.18. Data from Coinglass shows that the open interest on DOGE futures contracts is now at $1.62 billion, a 10% increase in the past 24 hours. 

Other meme coins are also witnessing strong interest. According to Santiment, SHIB, PEPE, FLOKI, and BONK have seen an increase of over 3,000% in trading volume in the past week. The on-chain analytics platform credits the increase in trading volume to surging prices and increased crowd interest.

SHIB, PEPE, FLOKI, and BONK are up by 277%, 256%, 204%, and 145% respectively in the past seven days, outperforming DOGE during the time frame. 

Dogecoin price chart from Tradingview.com

Dogecoin Open Interest Surges To Record $1.49 Billion

The Dogecoin open interest (OI) is surging after a week of remarkable price action. The meme coin which rose over 100% has continued to enjoy the attention of investors and traders alike, leading its open interest to reach a new all-time high.

Dogecoin Open Interest Taps Record $1.49 Billion

Data from Coinglass shows that there was an exponential growth in the Dogecoin open interest in the first five days of March. The open interest had closed out the month of February $870.22 million. However, only five days later, Dogecoin’s OI has risen to $1.49 billion. This rapid increase in less than one week translates to an over 70% increase in the open interest, reaching a brand new all-time high.

The increase did not come out of nowhere, as the DOGE price had begun to recover during this time. It closed out February at a price of $0.09, but by March 5, the price has already seen an 100% increase, briefly hitting $0.2 before correcting back downward to its current price of $0.18.

The open interest represents the interest in the meme coin as it is a total of all of the open derivatives positions in DOGE at any given time. This means that crypto traders are betting more on the price of Dogecoin and taking short and long positions in DOGE at an unprecedented rate.

Three exchanges currently control the vast majority of the DOGE OI, namely ByBit, Binance, and OKX. ByBit takes the lead, commanding $584.13 million of 3.25 billion DOGE OI. Binance takes the second position with $511.22 million or 2.85 billion DOGE, and OKX comes in third with $194.17 million or 1.08 billion DOGE.

DOGE Traders Caught In Tug-Of-War

Presently, the Dogecoin price seems undecided on where it is headed next, which has led to almost equal liquidations across the camps of bulls and bears. As mentioned above, the DOGE price had briefly touched $0.2, leading to liquidations across shorter. However, its downward correction has been just as detrimental to long traders.

Coinglass data shows that in the last 24 hours, DOGE traders have lost $33.92 million. Interestingly, long traders have actually lost more during this time as they account for $17.44 million in liquidations. While short traders have lost $16.32 million during the same time period.

On the shorter time frame, long traders are still suffering more losses with $2.26 million lost in the last four hours compared to $453,280 in short positions. However, while this shows bulls are taking a beating, it is also proof that bullish sentiment among traders when it comes to the DOGE price remains strong.

At the time of writing, DOGE’s price is siting $0.18 with a 7.49% increase in the last 24 hours, and an 85.98% increase in the last week.

Dogecoin price chart from Tradingview.com

Dogecoin Begins Massive Recovery Trend, But Can These Factors Drive A Rally To $0.2?

The Dogecoin price action in the past few days is showing signs of the crypto embarking on a bullish recovery. Particularly, DOGE has seen a strong uptick in trading volume in the last few days, fueled by an increase in activity from whale addresses. 

At the time of writing, DOGE spiked by over 6% in the past 24 hours to break over $0.09 for a brief moment. This spike in DOGE came despite the price of Bitcoin showcasing a weakening of bullish momentum at $52,000 and most cryptocurrencies sparking corrections, indicating a lingering bullish momentum among DOGE traders.

DOGE Recent Metrics Indicate Recovery Trend

Dogecoin mostly went through a lackluster price action throughout January, with the cryptocurrency ending the month at $0.07973, a negative 13% from its open price on January 1. The $0.079 price level acted as a major support, as DOGE started to rebound in early February after the formation of a double bottom. Consequently, DOGE technicals, transaction count, and price action pointed to a change in momentum and sentiment amongst traders.  

According to metrics from the on-chain analytics platform IntoTheBlock, the Dogecoin ecosystem has witnessed a lot of activity in the past month, processing more than 1 million transactions every day since the 30th of January. This increase in activity seems to have been reflected in the price of Dogecoin, with the cryptocurrency up by 11% since the beginning of February.

Dogecoin

At the time of writing, DOGE’s trading volume from Coinmarketcap is approximately $824 million, an increase of over 129% in the past 24 hours. The majority of the recent increase in activity can be attributed to whales of large investors. 

According to Dogecoin whale data, whale transactions greater than $100,000 now stand at $2.53 billion in the past seven days. Notably, this transaction count from large investors reached 1,570 in the past 24 hours with a total volume of 15.88 billion DOGE. This huge surge of activity seems to be providing the cryptocurrency with a big boost, fueling an impressive recovery that could see it crossing the $0.1 threshold once more and possibly reaching the $0.2 price level.

DOGE Price Action – Rally To $0.2?

Dogecoin has started showing signs of life again, fueled in large part by whale activity. The crypto recently surged to $0.09115 in the past 24 hours. Although still up by 1% in the same timeframe, DOGE has since corrected by 4.5% and is currently trading at $0.08702. 

A minor support is at the $0.08693 price level, with metrics and general market sentiment pointing to continued bullish price action in the short time. The first price level would be the return to $0.09. If Dogecoin manages to maintain a stronghold above this key milestone, it is expected to create a more bullish momentum among traders which could see it breaking past above $0.1 for the first time in three months. 

This breakthrough over $0.11 could mark an important milestone for Dogecoin’s price trajectory, as the next target would be $0.2. 

Dogecoin price chart from Tradingview.com

These Dogecoin Whale Transaction Stats Spell Trouble Despite Ongoing Crypto Rally

Dogecoin’s current metrics point to a confused path as the broader crypto market rallies after Bitcoin crossed the $50,000 level. Dogecoin has been posting some gains along with the rest of the crypto market, but behind the scenes, the meme coin’s transaction volume and whale transaction count have been discouraging. 

According to on-chain data first shared on social media platform X by crypto analyst Ali Martinez, Dogecoin has experienced a low transaction volume in the past few days, fueled by a drop in trading activity from large traders. 

Dogecoin’s Transaction Volume And Whale Activity Drops

According to the Santiment data shared by Ali Martinez, DOGE has been posting gains since February 6. Still, the whale transaction count and the total transaction volume have failed to rise.

Notably, this gain has dwindled compared to the other major cryptocurrencies. As a result, Chainlink (LINK), which has been on a bullish run, was able to displace DOGE out of the top 10 in terms of market cap rankings.

This decline in whale activity indicates the current sentiment among large traders. Similarly, data from IntoTheBlock has reiterated a decline from this cohort of traders, as the number of daily transactions greater than $100,000 has failed to rise above 200 in the past few days. For comparison, daily transactions above $100,000 steadied above 1,000 throughout January.

When activity drops, but prices rise, it’s usually a sign that a rally isn’t sustainable. This decline in activity suggests that fewer people are using Dogecoin for payments and transfers. Instead, Dogecoin seems to be catching up in the hype of the crypto market rally. 

What Does This Mean for The Dogecoin Price Outlook?

Whales are known for their ability to move markets so that less activity could signal lower enthusiasm. As a result, Dogecoin’s decreasing transaction volume and whale activity could signal some trouble for the meme cryptocurrency’s value in the coming weeks, primarily as it relies heavily on hype and popularity to drive up its market price.

At the time of writing, DOGE seems to be particularly facing resistance at the $0.083 price level. However, the decreased volume doesn’t necessarily mean Dogecoin is doomed, as the whale transaction count could pick back up shortly. 

dogecoin doge dogeusdt

The Dogecoin Foundation recently announced an ambitious 2024 roadmap in a recent blog post outlining the vision for the meme coin’s future. The renewed dedication to improving Dogecoin’s underlying technology, increasing its utility and mainstream adoption gives a glimmer of optimism. 

At the time of writing, DOGE is trading at $0.08235, up by 2.39% in the past 24 hours. Failure to break out of the resistance at $0.083 could mean a reversal to the $0.0816 level.

Cover image from Dall-E, chart from Tradingview

Dogecoin On The Verge Of Breakout: Crypto Analyst Says Get Ready For DOGE To Pop

Dogecoin (DOGE) is getting ready to “pop,” as this crypto analyst predicts that the next move to the upside could see the meme coin break a critical resistance level. DOGE’s price has, in recent times, lived off the hype regarding several use cases that could be added for it soon. However, it remains to be seen if these narratives can propel the meme coin to hit new highs. 

Dogecoin Could Rise To $0.083 Soon

Crypto analyst Muro Crypto hinted in an X (formerly Twitter) post that another bounce by DOGE from its current support level might give it another push to break its current resistance levels. From the accompanying chart that he shared, one could see that the analyst was predicting that another move to the upside could see DOGE rise to as high as $0.083. 

In a previous X post, Muro had shared his belief that DOGE was going to pop soon enough. Not long after, the meme coin saw a move to the upside. However, that momentum didn’t last for long, as the analyst noted, with the meme coin dropping back to its entry point, halfway to the $0.83 target. 

It is worth mentioning that DOGE has recovered and risen above the $0.80 psychological level, something which could mean that it was gearing up for a further move to the upside. Mark Cuban revealed that his Dallas Mavericks team still receives Dogecoin as a payment method, which has partly contributed to this most recent price surge. 

The meme coin has also recently rallied on the back of speculations that the X platform could include DOGE as a payment method in its X Payments, which is expected to go live this year. The fondness that Elon Musk, who happens to own X, has for the meme coin is the primary driver behind this narrative. 

Dogecoin price chart from Tradingview.com (DOGE crypto analyst)

Another Factor That Could Spark A Surge In DOGE’s Price

Crypto analyst Ali Martinez revealed in an X post that the Dogecoin network has been witnessing a “remarkable surge in growth.” New addresses on the network are said to have increased by a remarkable 1,1000% over the past week. Specifically, he highlighted how a record-breaking 247,240 new DOGE addresses were created on January 29 alone. 

The analyst noted how a sustained uptrend in the network’s expansion “could soon reflect positively” on DOGE’s price. Usually, such a development means that more users are acquiring the meme coin, with an increased demand for the meme coin likely to spark a surge in its price. 

At the time of writing, DOGE is trading at around $0.081, up in the last 24 hours, according to data from CoinMarketCap. 

Dogecoin To See 24% Rally To $0.100 If This Holds: Analyst

An analyst has explained that Dogecoin could rally towards $0.10 based on a pattern forming in its price if a support cluster continues to hold.

Dogecoin Has Observed A Buy Signal On Its 3-Day Chart

As explained by analyst Ali in a post on X, a TD-Sequential buy signal recently appeared for DOGE on its 3-day price. The “Tom Demark (TD) Sequential” here refers to an indicator in technical analysis that helps pinpoint locations of probable tops and bottoms in any asset’s price.

This indicator is made up of two phases. The first is called the “setup” phase, and it’s nine-candles long. During this phase, nine candles of the same polarity are counted, and following the ninth, the asset could be assumed to have hit a point of reversal.

Whether the setup would indicate a buy or sell signal naturally depends on the prevailing price trend. If the price were going up during the setup (the candles were green), then the setup’s completion would indicate a potential point of selling. Similarly, the TD Sequential would mark a sell signal in the opposite case.

Once the setup is complete, the second phase of the indicator, called the “countdown,” begins. This phase is thirteen candles long, and once these candles are in, the asset could once again be considered to have reached a probable bottom or top.

Now, here is a chart shared by Ali that highlights the completion of a TD-Sequential setup phase for the 3-day price of Dogecoin:

Dogecoin TD Sequential Setup

The above graph shows that the Dogecoin 3-day price has recently finished a TD-Sequential setup with red candles. This would imply that the indicator has given a buy signal for the asset.

So far, since this setup has formed, DOGE has registered two green candles on this chart, implying that the meme coin’s price may have indeed witnessed a change of direction.

In the same chart, the analyst has also highlighted a support cluster for the coin, where some important lines have converged around the $0.074 level. Based on this and the TD-Sequential pattern that has formed, Ali notes, “as long as the $0.074 support cluster continues to hold, DOGE has a great chance of rebounding to $0.100 or higher!”

From the current spot price of the cryptocurrency, a potential rally to this $0.100 target would mean a surge of around 24% for the asset. If DOGE retests the $0.074 support level and rebounds to this high, the coin would see a rally of over 35%.

DOGE Price

Dogecoin opened 2024 with a deep plunge, and the memecoin has so far been unable to recover from it, as its price has mostly been stuck in consolidation. At present, DOGE is trading around the $0.0804 mark.

Dogecoin Price Chart

Crypto Analyst Predicts 800% Rally As Dogecoin Enters Buy Zone

Compared to other meme coins and large caps in the crypto space, the Dogecoin performance has been quite lackluster, to say the least. Even as Bitcoin sets an out toward its previous highs, Dogecoin price has been muted. Bit this could change soon as one analyst sees a reversal coming.

Dogecoin Price Has Entered The Buy Zone

Since falling back below the $0.09 level, the dogecoin bulls have struggled to maintain control of the price. With bearish and selling pressure mounting, the best-case scenario was that the meme coin would once again enter an accumulation zone that could help provide support.

According to a crypto analyst who goes by CryptoCheck on TradingView, the DOGE price may have finally entered this buy zone. The analyst analyzes the DOGE price on different time frames such as the four-hour and the weekly frame, coming up with a rather bullish narrative for the coin.

On the 4-hour timeframe, the meme coin showed a lot of strength as a recovery rocked the crypto market. Then moving on to the weekly timeframe, the analyst points out that Dogecoin is currently flashing a buy signal for investors to get back in. This buy signal comes between the $0.078 and $0.084 levels.

Now, the levels highlighted for buying here coincide with the analysis from crypto analyst Skew who explained that the risk-reward above $0.087 is higher for investors who are looking to get in on the asset. These levels could present the best buying opportunity before the next leg-up.

Dogecoin price chart from Tradingview.com

DOGE Price Could Fly 800%

CryptoCheck’s analyst also predicts a lot of potential upside for the Dogecoin price. They point out that DOGE has gone from a joke to a prominent crypto and this is thanks to the community which has continued to support its growth and development.

Given the chart position, there is a lot of upside potential for the meme coin going forward in 2024. Some of the developments that could propel this price surge include the fact that Elon Musk’s X is getting ready to launch a peer-to-peer payments platform this year. As always, expectations are that Dogecoin could play a huge role in this.

However, while the analyst sees a lot of potential in the future of the altcoin, they explains that DOGE is still quite bearish in the short term. “The price needs to establish support before going higher, and the downward trend means that support hasn’t been found at the current levels,” CryptoCheck explains.

Dogecoin To Double Its Price If This Barrier Breaks, Analyst Predicts

An analyst has explained how Dogecoin breaking the $0.087 barrier could open the path to DOGE price levels nearly double the recent ones.

Dogecoin Has Three Important Lines Converging At $0.087 Right Now

In a new post on X, analyst Ali has discussed what the weekly chart of DOGE is looking like right now in terms of some important historical lines. In particular, the levels of interest here are the 100-week EMA, 200-week EMA, and 0.786 Fibonacci.

A “moving average” (MA) refers to an analytical tool that calculates the mean of any given quantity over a specific period of time, and as its name implies, it moves in time and changes its value as the quantity fluctuates.

This basic tool is quite useful as it smooths out the curve by removing local fluctuations, making a study of long-term trends easier to perform. In the context of the current topic, though, a normal MA isn’t of focus, but rather a modified form called the exponential moving average (EMA).

The EMA works like the usual MA, except it places a greater weight on the most recent readings of the quantity. What this means is that the older the reading, the less weightage it has in the metric, so the line’s changes reflect the latest price direction more strongly.

Now, here is a chart that shows the trend in the 100-week and 200-week EMAs for Dogecoin, as well as the weekly price curve of the meme coin:

Dogecoin Weekly

As is visible from the above graph, these two Dogecoin EMAs have approached each other recently and have converged into a narrow range around the $0.087 level.

In the past, these two EMAs of the cryptocurrency have posed resistance to the price and it appears that the weekly chart of Dogecoin has been struggling with them again, as it has been finding rejection here during the past three weeks.

These two lines aren’t the only ones converging near $0.087, however; it would appear that the 0.786 Fibonacci level is doing the same. The Fibonacci levels listed in the chart are some ratios derived from the famous Fibonacci series.

In this series, dividing any number (except for the first few) by its succeeding number always gives a ratio of about 0.618. The square root of this number is 0.786, which is the level the analyst has marked here.

Dogecoin thus has a major wall at $0.087, made up of the convergence of all these historically significant lines. “Breaking past this barrier could open the gates for DOGE to nearly double its price, aiming for a target of $0.14,” explains the analyst.

DOGE Price

Dogecoin has observed a surge back above the $0.080 mark during the past day, as the below chart shows. It now remains to be seen if the coin will go on to retest this $0.087 level that might be so crucial for the coin.

Dogecoin Price Chart

Dogecoin Price Poised For Epic Surge To $1.5: Crypto Analyst

In a recent analysis shared by renowned crypto analyst, Jaydee, Dogecoin (DOGE) appears to be setting the stage for a potentially significant price rally. The chart showcases a series of technical indicators and patterns that hint towards a bullish trajectory for the meme coin, with a projected price target above $1.5.

In a tweet accompanying the chart, Jaydee remarked: “Dogecoin – meme (shitcoin) with a beautiful chart structure! Will DOGE have that confirmed breakout?! Last time it broke out from a multi-year triangle, it 380x in price! Similar structure compared to the 2020-2021 breakout!”

Dogecoin Price Prints Historic Buy Signal

The chart provided by Jaydee displays the DOGE/USD trading pair with a bi-weekly time frame. Dogecoin’s price history, as highlighted in the chart, reveals two significant breakout points.

Dogecoin price

The first breakout took place in 2017, where the price surged from below $0.003 in March 2017 to a peak of $0.0193 in January 2018. The second notable breakout occurred around the end of 2020 till April 2021, skyrocketing the DOGE price from about $0.035 to an all-time high close to $0.76.

Over the past few two years, from April 2021 till recently, Dogecoin’s price has been forming a symmetrical triangle pattern again. This is a classic continuation pattern, and given DOGE’s past bullish momentum, a breakout from this triangle to the upside seems plausible.

Remarkably, DOGE’s 380x price rise was also preceded by a multi-year triangular formation. At the end of 2020, DOGE broke out of the formation, but first experienced a successful retest of the trendline and a short sideways phase of around three months before the massive rally.

Jaydee’s analysis indicates that the DOGE price has begun its breakout from this symmetrical triangle with this week’s candle, hinting at a continuation of its previous bullish trend. If history repeats itself, DOGE could first experience another minor pullback, followed by a short sideways phase, before the ascent towards the current all-time high begins.

By extrapolating from past performance and the present chart structure, Jaydee’s analysis proposes that a confirmed breakout could see DOGE aiming for the $1.5 price range sometime in 2024, as detailed with the blue arrow in the chart.

The chart humorously remarks that “BEGINNERS will be buying up here.. SMH! LOL!”, suggesting that novice traders might be lured into buying at the peak. While it’s a lighthearted note, it’s also a cautionary tale for traders to conduct their due diligence and not follow the herd mentality.

While the 2-week chart in Jaydee’s analysis has already posted a bullish breakout signal, the 1-day chart still looks somewhat different. The price is still below the trendline (black), at which Dogecoin has been rejected several times since December last year. However, DOGE has crossed the 0.236 Fibonacci retracement level at $0.0692 and is now approaching the trendline again.

Dogecoin price