Dogecoin To $1: Analyst Thinks Dream Milestone Could Be Hit In Coming Weeks

An analyst has explained how a pattern forming in the Dogecoin price may suggest a rally to $1, if historical trend repeats this time as well.

Dogecoin 1-Week Price Appears To Be Forming A Classic Pattern

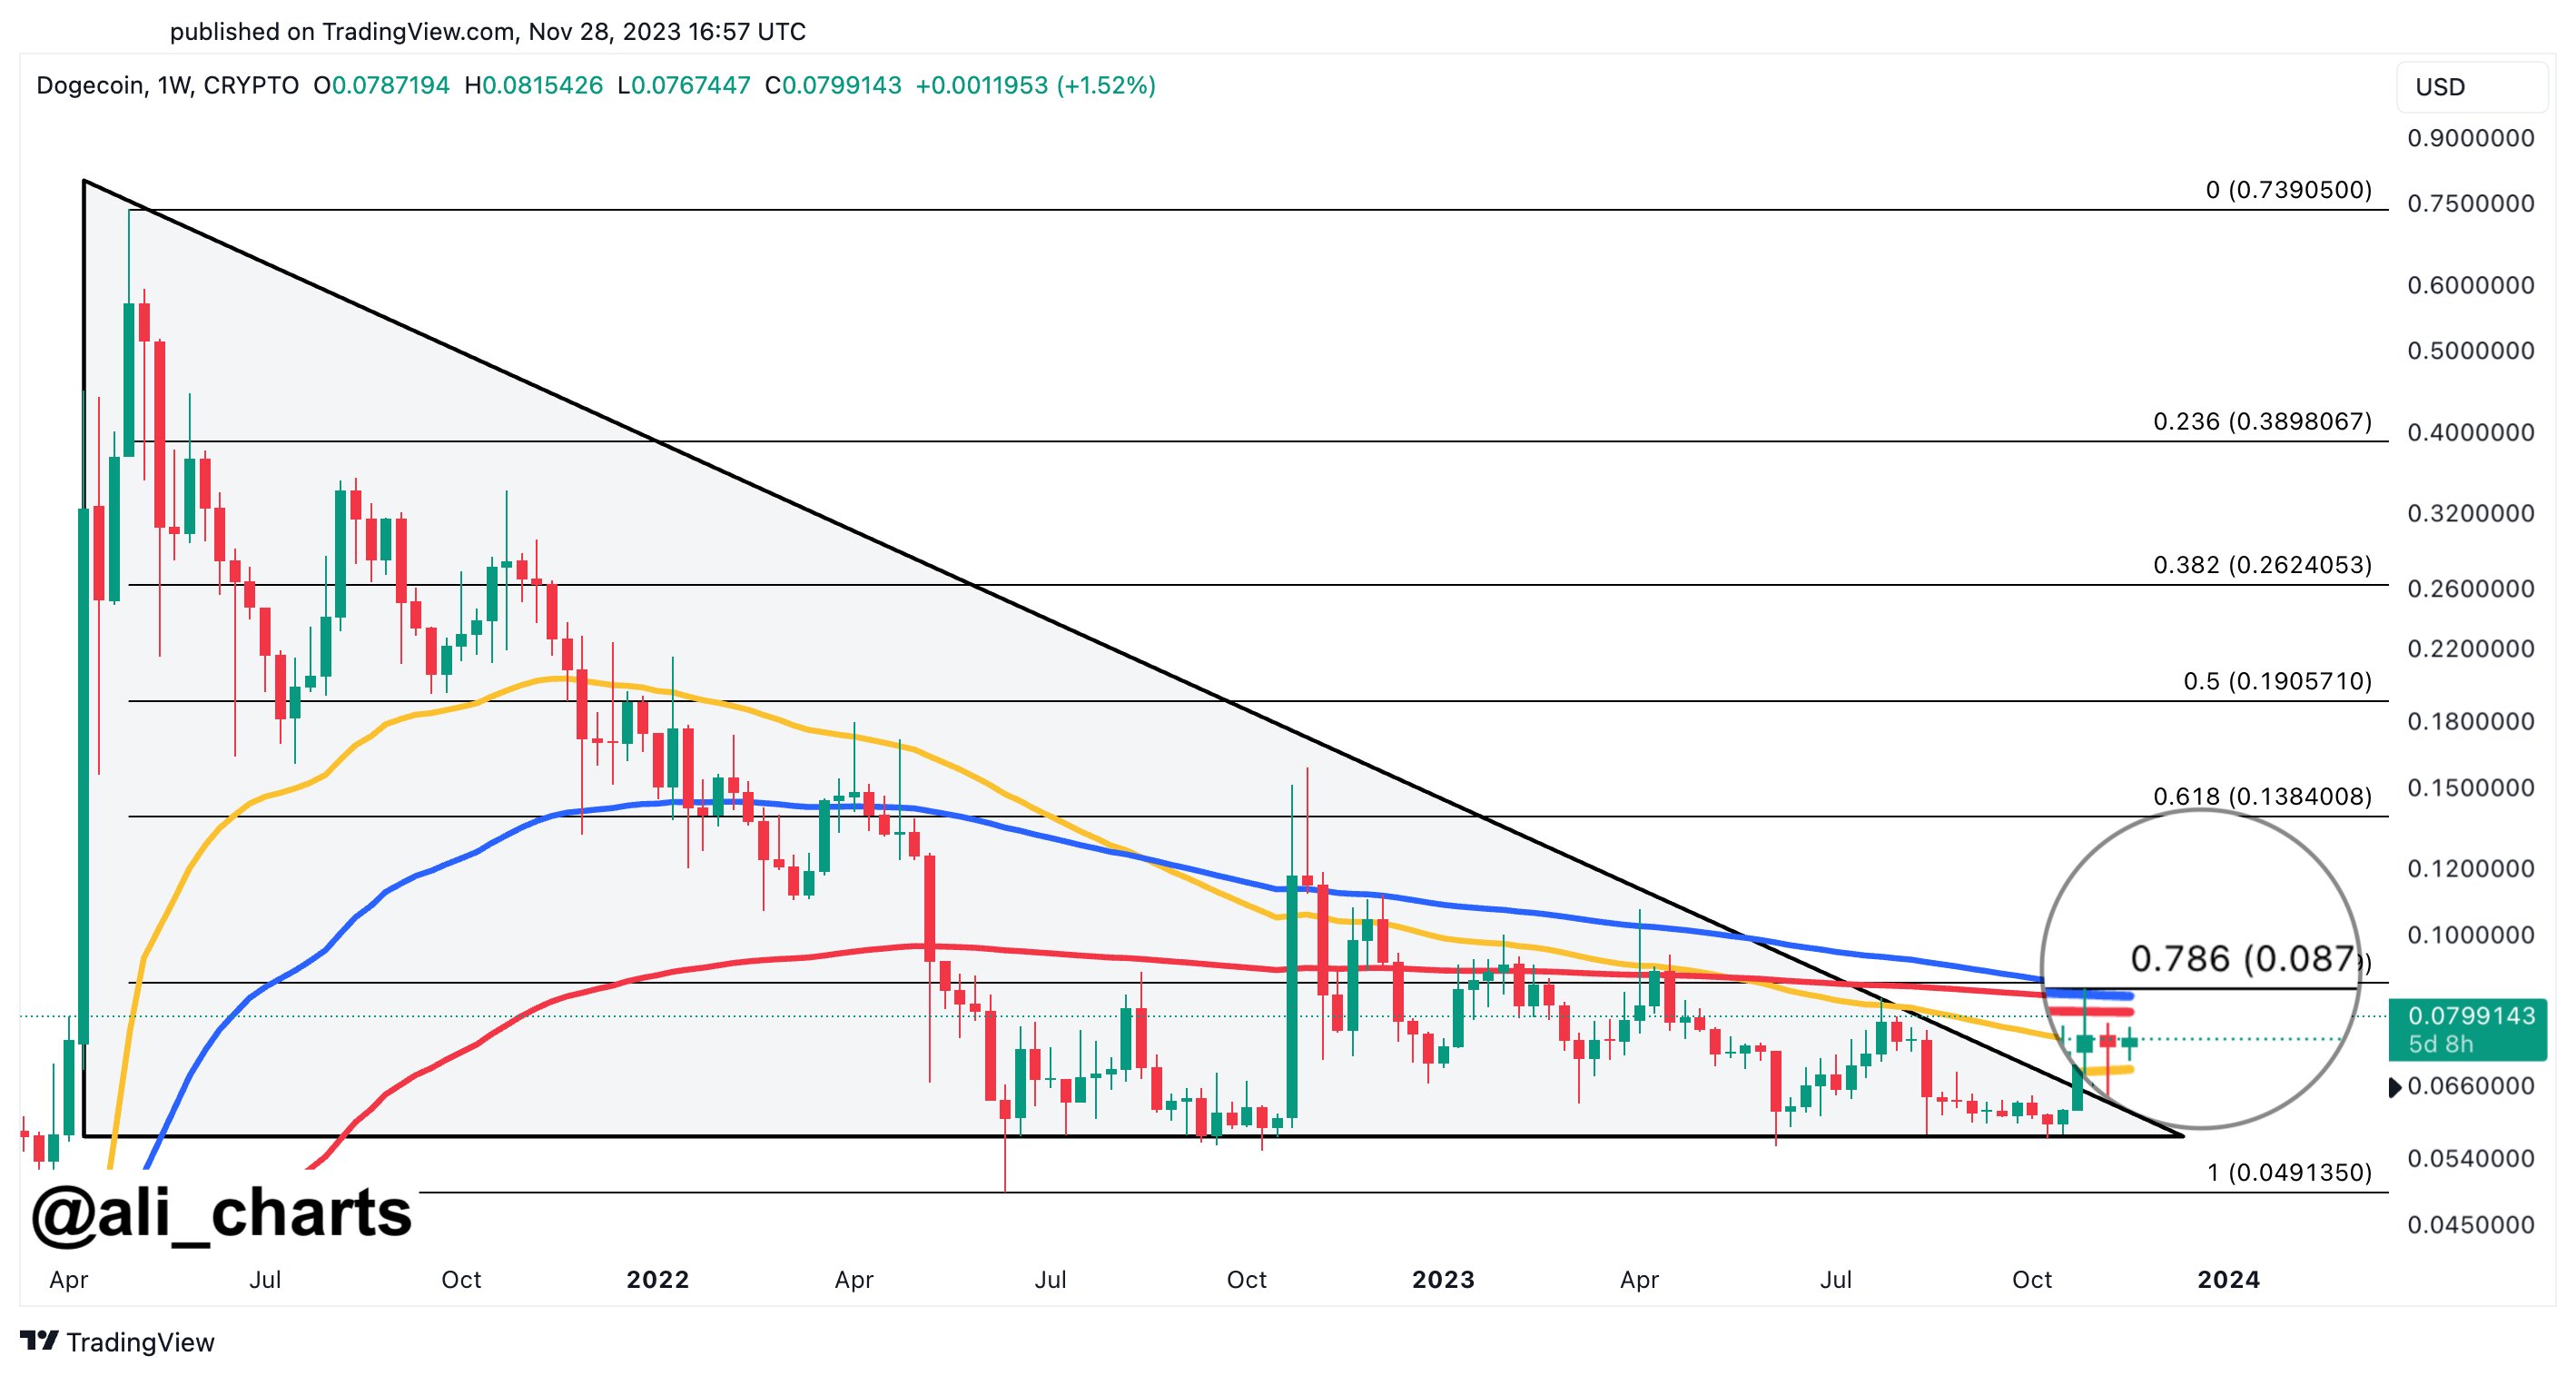
In a new post on X, analyst Ali has discussed how DOGE seems to have been showing a classic pattern in its weekly price once again. This trend involves a technical analysis (TA) pattern called the “Descending Triangle,” which, as its name suggests, is shaped like a triangle.

The pattern involves two trendlines between which the price of the asset consolidates; one of these is a line slopped downwards while the other is parallel to the time-axis. This property of the price converging downwards as it goes through the pattern is why it has descending in its name.

Like other TA consolidation patterns, the upper line of the Descending Triangle also provides resistance to the commodity, making tops more probable to form at it. Similarly, the lower line acts as a point of support and can help the price reverse back upwards.

A break out of either of these lines may result in a continuation of the trend in that direction. This means that a break above the triangle can be a bullish signal, while one below could suggest the dominance of bearish momentum.

Similar to the Descending Triangle, there is also an Ascending Triangle in TA, which works much like it, except for the fact that the parallel axis makes the upper line, connecting together tops, while the lower line ascends up as it joins higher lows.

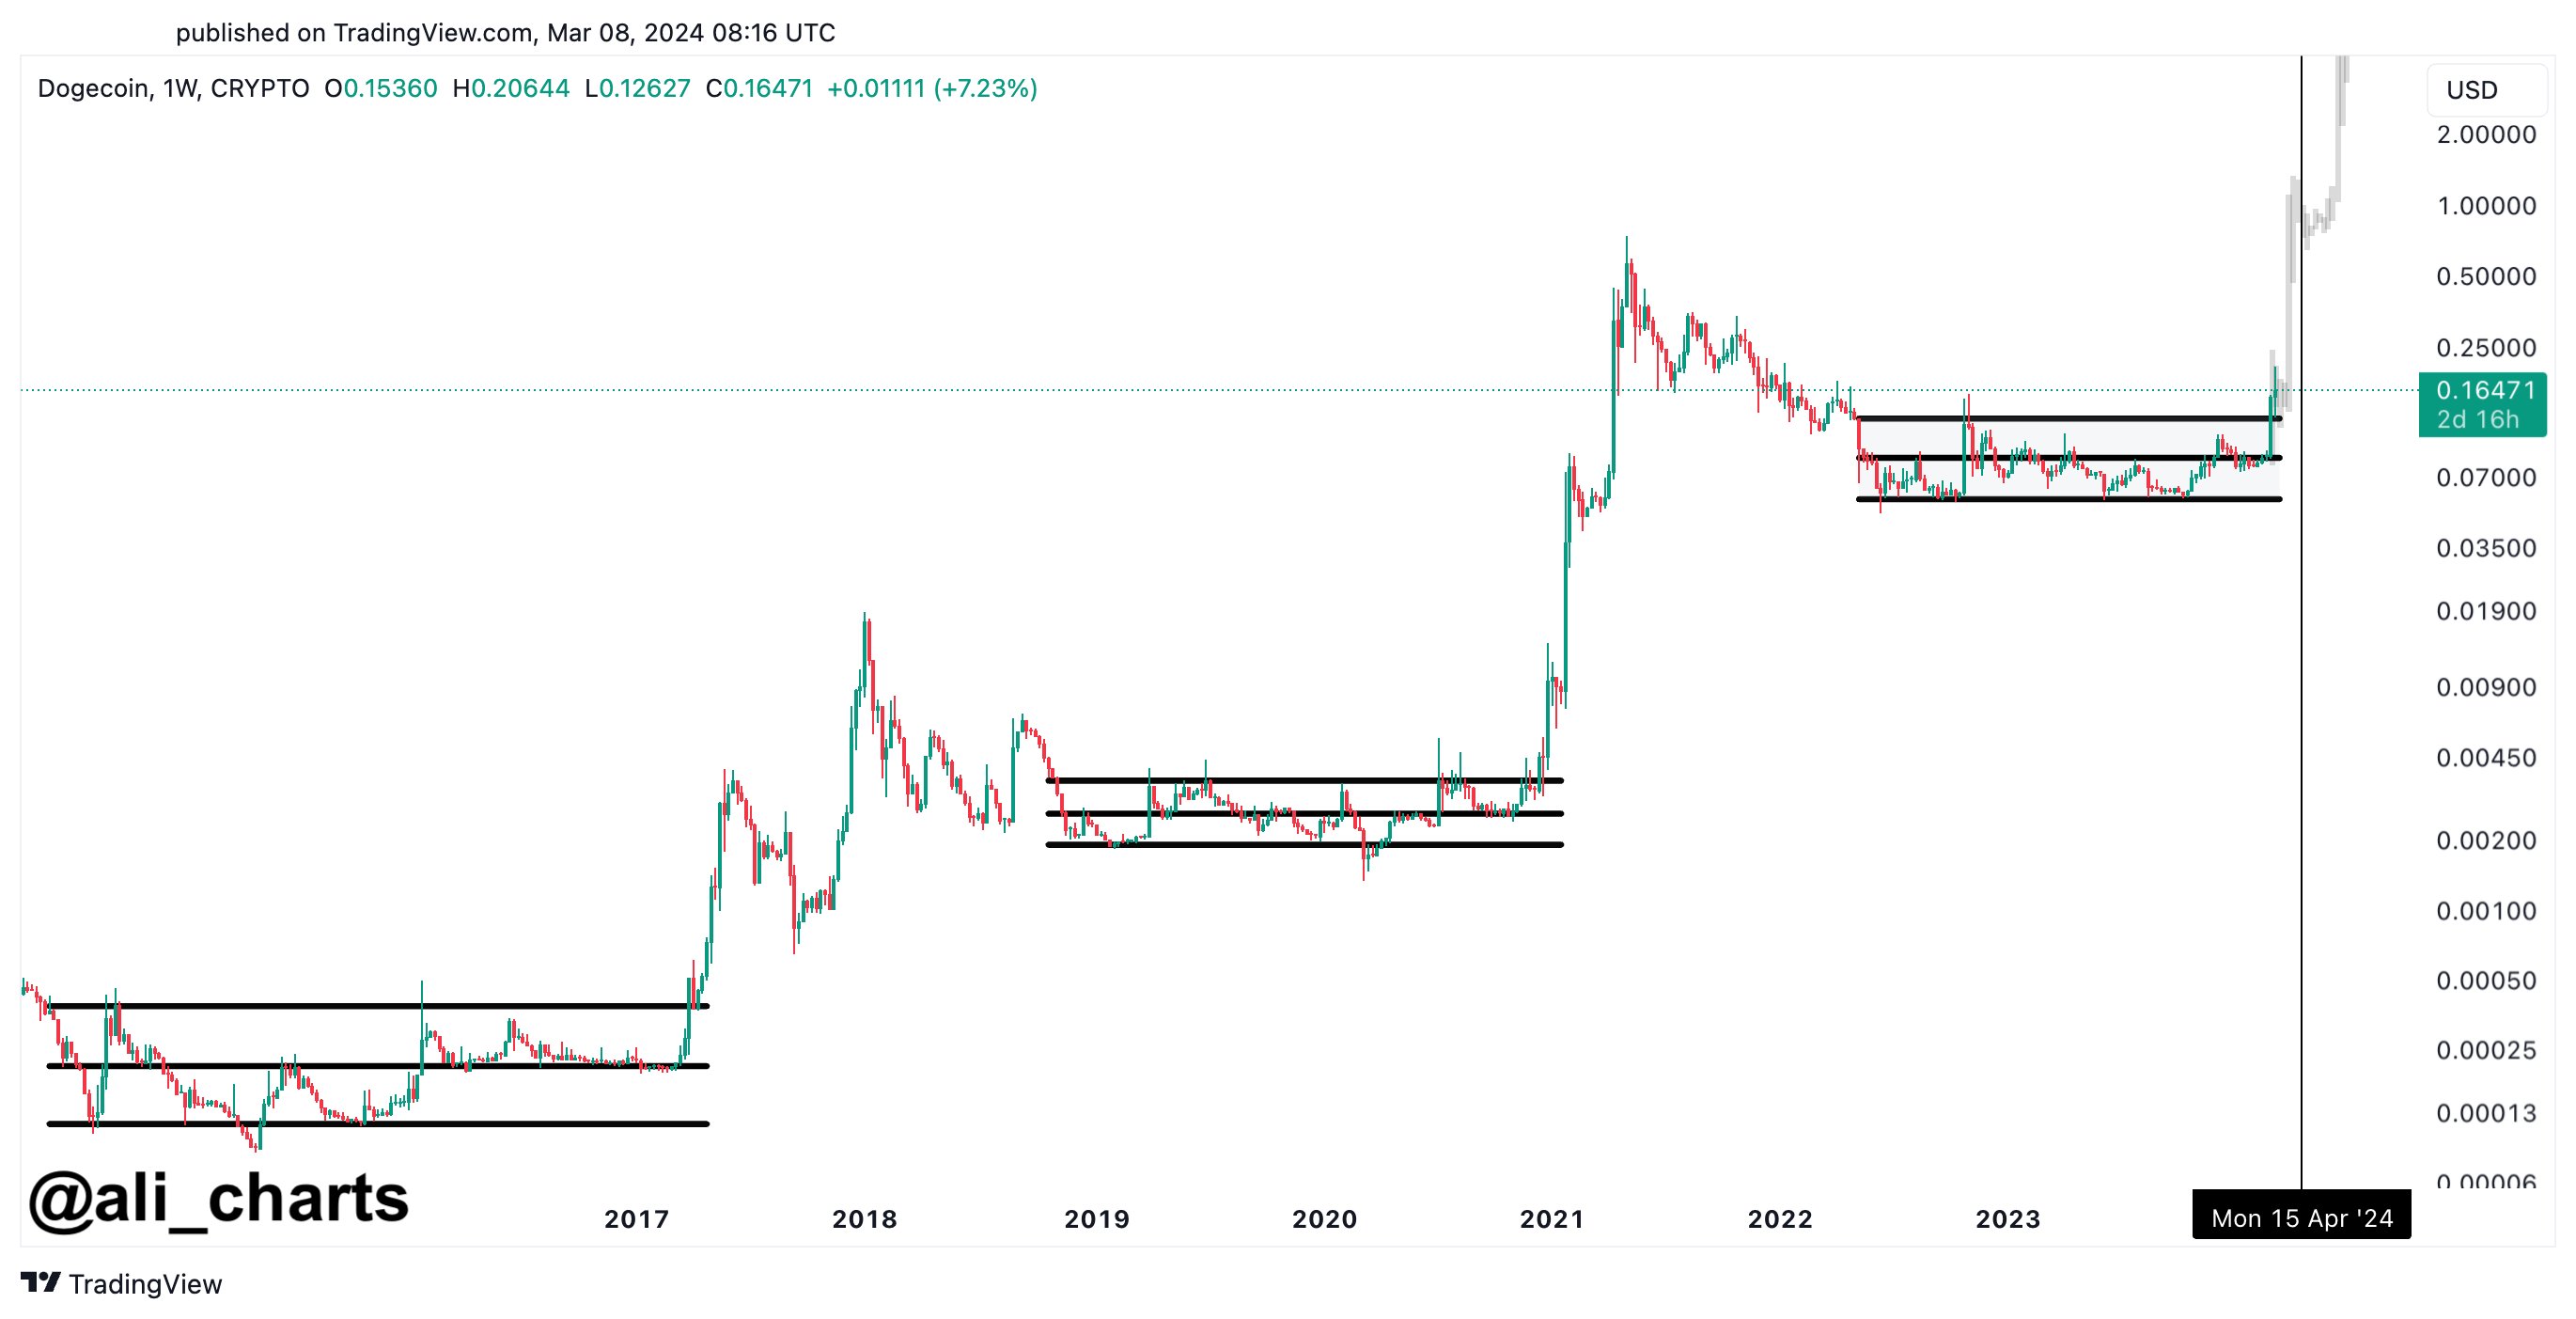
Now, here is the chart shared by Ali that highlights a pattern that DOGE’s 7-day price has been forming recently:

Dogecoin Descending Triangle

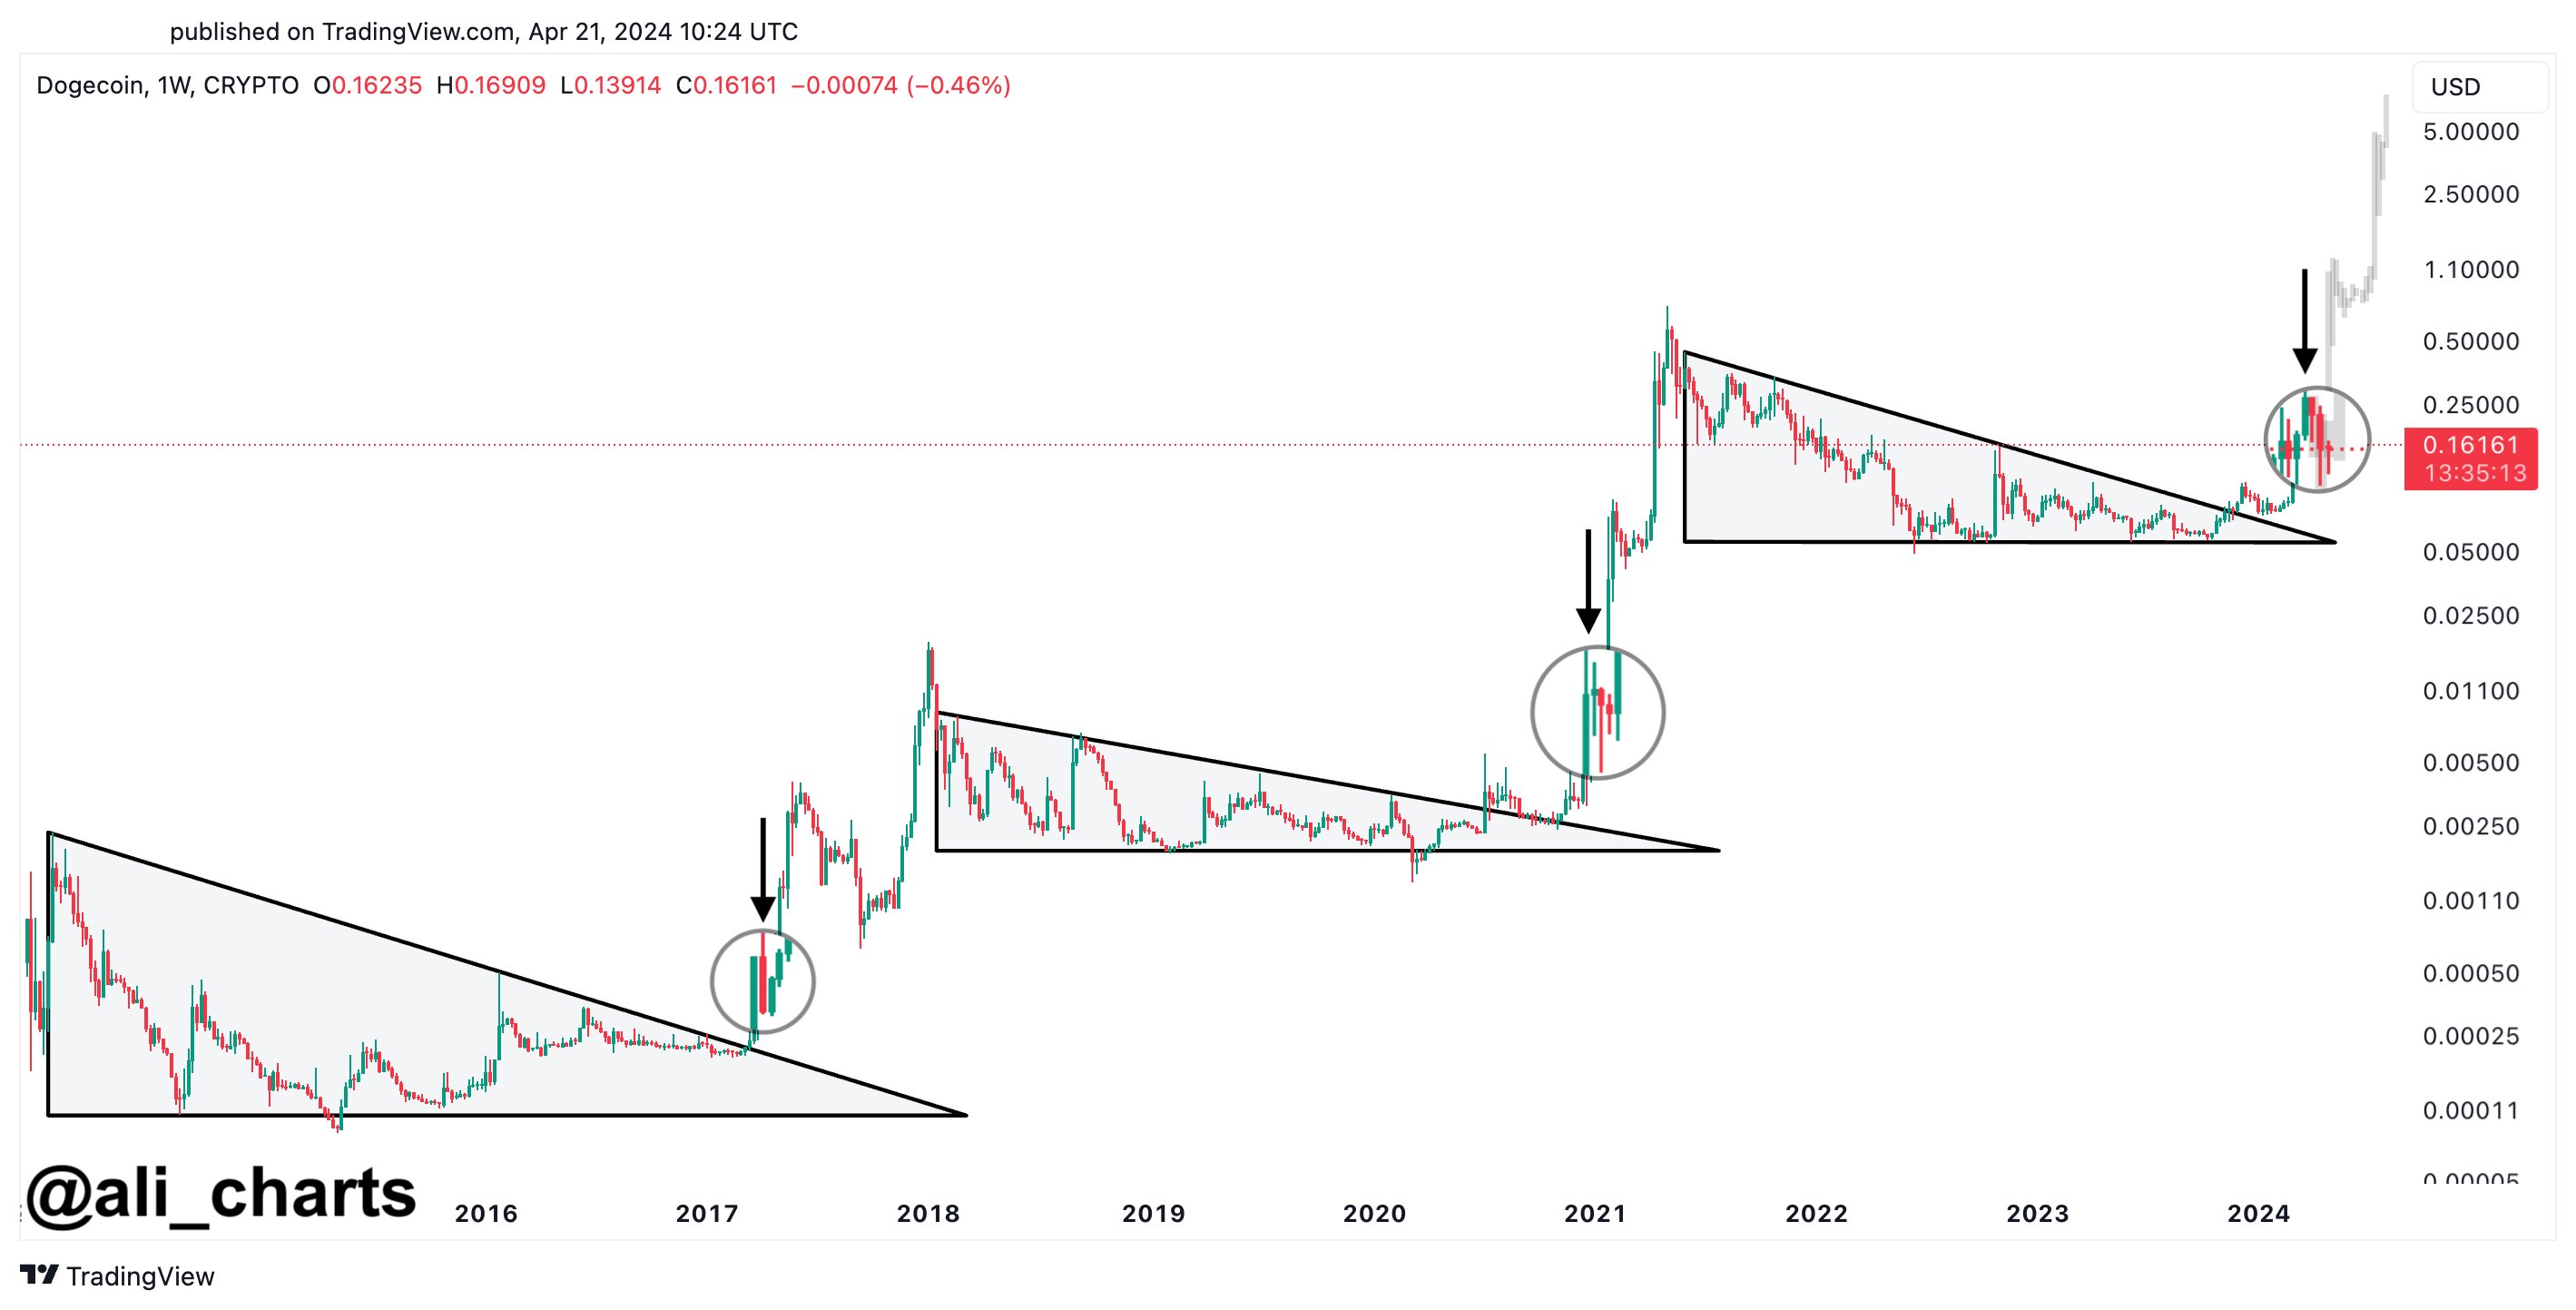
From the graph, it’s visible that the Dogecoin 1-week price had been trading inside a long Descending Triangle between 2021 and this year, but the meme coin found a break earlier and has since registered some notable uplift.

Recently, though, the cryptocurrency has reached a stage of sideways movement. This, however, may not entirely be a bad thing, as DOGE has also seen a similar trend of a Descending Triangle break followed by consolidation in the past as well.

As is visible in the chart, the previous two such formations led to Dogecoin witnessing some very significant growth. As such, the latest one may also prove to be bullish, if this historical pattern continues to hold.

“Based on past trends, we might just see DOGE rocket towards $1 in the coming weeks!” explains Ali. From the current spot price, such a potential rally would mean a growth of a whopping 525% for the coin.

DOGE Price

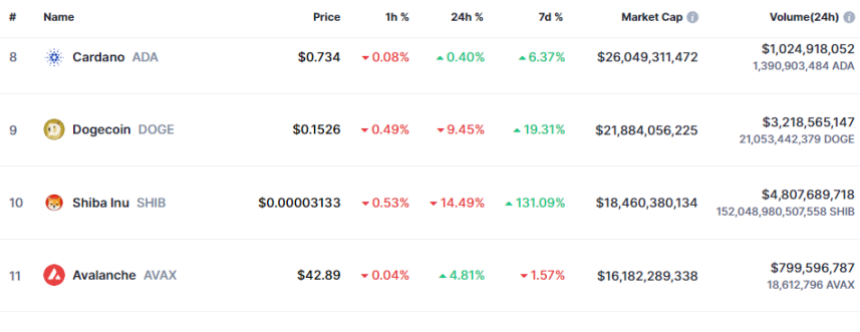
Dogecoin’s price action has been quite stale since the price plunge earlier in the month, as the asset’s price is still trading around $0.16.

Dogecoin Price Chart

Dogecoin Slows Down: What Needs To Happen For New DOGE Highs?

The market intelligence platform IntoTheBlock has pointed out what may need to happen before Dogecoin can continue its uptrend and reach new highs.

Dogecoin Has Notable On-Chain Resistance Near $0.20

In a new post on X, IntoTheBlock has discussed the recent trend in the price of DOGE and what it would take for the memecoin to register a new high for the year.

According to the analytics firm, Dogecoin must solidly break above the level where on-chain resistance is currently the strongest. In on-chain analysis, a level’s potential to act as resistance or support is based on the number of coins that were last bought at it.

Below is a chart that shows this investor cost basis distribution for DOGE at price ranges near the cryptocurrency’s current spot value.

Dogecoin Resistance

Here, the size of the dot represents the number of coins acquired within the corresponding price range. In terms of the levels ahead, the prices around $0.20 have held the cost basis of the most number of tokens out of the ranges listed.

To be more particular, about 32,000 addresses bought 3.78 billion DOGE around this mark. Since this price is above the current spot value of the asset, all of these investors would be holding at a loss.

Generally, the cost basis is a special level for investors, and as such, they are prone to reacting when the asset retests. Investors holding at a loss may tend to show a selling reaction when such a reaction happens.

This is because investors like these may fear that the cryptocurrency will dip again shortly, so exiting at the break-even mark might not sound like a bad idea, as they would at least be able to avoid any losses in the future.

Of course, if only a few investors are involved, any such reaction from the market wouldn’t be relevant to the Dogecoin price. However, if a large number of investors show this reaction, the asset may very well feel some visible fluctuations.

This is why the strength of an on-chain level’s ability to act as resistance or support lies in the number of coins acquired there. More coins mean a potentially larger reaction once the level is retested.

As the $0.20 level holds the cost basis of a notable number of investors, it’s possible that it could act as a source of major resistance when Dogecoin retests it next. IntoTheBlock says that, for DOGE to continue its recent rend, it would have to break past this barrier solidly.

DOGE Price

Dogecoin has experienced a drawdown over the last couple of days, which has taken its price to $0.188.

Dogecoin Price Chart

Traders Not Showing Dogecoin FOMO, Good Sign For Rally?

On-chain data suggests traders haven’t been showing FOMO towards Dogecoin despite the latest rally, a sign that could be positive for its continuation.

Dogecoin Total Amount Of Holders Has Remained Flat Recently

According to data from the on-chain analytics firm Santiment, FOMO, which would normally be associated with tops, has been absent from the Dogecoin market recently.

The indicator of relevance here is the “Total Amount of Holders,” which, as its name suggests, keeps track of the total number of DOGE addresses that are carrying a non-zero balance right now.

When the value of this metric goes up, it can be because of a number of reasons. A major one would naturally be fresh adoption, as new investors coming into the sector would open up new addresses and add balance to them, thus raising the indicator’s value.

Other reasons can include existing users reconsolidating their holdings among multiple addresses (usually for a purpose like privacy) or old investors coming back to reinvest in the meme coin.

In general, whenever the metric shows this kind of trend, it means that some net adoption of the asset is taking place, which can be a positive sign in the long term.

On the other hand, a decline in the indicator implies some holders may have decided to exit from the cryptocurrency as they have completely cleared out their addresses.

Now, here is a chart that shows the trend in the Dogecoin Total Amount of Holders over the last few months:

Dogecoin Total Amount of Holders

As displayed in the above graph, the ‘Total Amount of Holders’ for Dogecoin has been flat for many weeks now, implying that the adoption of the meme coin has hit the brakes.

Interestingly, this sideways trajectory has come despite the fact that DOGE’s price has gone through some volatile price action during this period. Generally, events like rallies are attractive to traders, so a notable amount of them tend to jump into the asset during them.

It would appear that the traders have either not been paying attention to the recent DOGE rally or just not taking it seriously. In the past couple of weeks, the ‘Total Amount of Holders’ for the meme coin has gone up by only 0.21%, despite the fact that the price has rallied more than 40% in the same window.

Historically, when a large number of traders join the blockchain at once during price surges, it’s a sign that FOMO around the asset is spreading. Usually, the meme coin’s price tends to go against the expectations of the majority, so when there is widespread FOMO, a top can become likely to take place.

As there hasn’t been any such FOMO for Dogecoin recently, it’s possible that it could be a positive sign for the rally’s continuation. There is also another signal brewing, however, that may not be so constructive.

From the chart, it’s visible that the Mean Dollar Invested Age, a metric that keeps track of the average age of DOGE investments, has plunged recently, implying that the experienced hands have been on the move. When this signal formed earlier in the year, the coin’s price approached the top not too long after.

DOGE Price

Dogecoin had surpassed the $0.22 level earlier, but it seems the asset has gone through some drawdown as it’s now back under $0.21.

Dogecoin Price Chart

Dogecoin Soars 17% To Break $0.21 As Volume Explodes

Dogecoin has jumped 17% in the past 24 hours to break past the $0.21 barrier as on-chain data shows a significant increase in volume for the memecoin.

Dogecoin Beats Market With 17% Rally In The Last Day

Most of the top cryptocurrencies have seen flat returns in the last 24 hours, but Dogecoin has gone its own way as the original meme coin has enjoyed a strong rally.

The below chart shows what the asset’s performance has looked like during the last few days:

Dogecoin Price Chart

In this latest rally, Dogecoin has surged more than 17% in the last 24 hours and has cleared the $0.21 level. Among the top 100 cryptocurrencies by market cap, only Bitcoin Cash (BCH) has registered comparable profits in the same period.

DOGE still beats BCH in the 1-week timeframe, however, as the memecoin has managed returns of more than 40% in this period, while the Bitcoin hard-fork has seen 33%.

The reason behind these two assets in particular seeing a strong performance may lie in the fact that Coinbase plans to add futures products for them starting the 1st of April. Litecoin (LTC) is also set to see a listing on the same day, but its performance has been much weaker than the other two.

In terms of market cap, Dogecoin is currently the eighth-largest coin in the sector, as the table below shows:

Dogecoin Market Cap

From the table, it’s apparent that the gap to USD Coin (USDC) in seventh isn’t too much right now, so if Dogecoin can keep up its surge, it’s possible that it may be able to flip the stablecoin.

DOGE Transaction Volume Has Observed A Sharp Increase Recently

Something that would confirm that widespread speculation around Dogecoin is ripe for a rally currently would be its Transaction Volume. As a user on X pointed out using data from the on-chain analytics firm Santiment, DOGE’s Transaction Volume has shot up recently.

The “Transaction Volume” keeps track of the total amount of tokens (in USD) for a given cryptocurrency that has observed some movement on the blockchain in the past 24 hours.

When the value of this metric is high, it means that the users are transacting large amounts on the network right now. Such a trend implies the trading interest around the asset is high currently.

On the other hand, low values of the indicator can be a sign that the general interest in the cryptocurrency, both as an asset and a network, is low at the moment.

Now, here is a chart that shows the trend in the Dogecoin Transaction Volume over the past year:

Dogecoin Transaction Volume

As is visible in the chart, the Dogecoin Transaction Volume has experienced quite a boost recently, and what has accompanied this rise has been the latest rally.

A rising volume can often be a positive sign for the sustainability of any rally, as it means that interest in the asset is going up, and thus, more fuel is potentially coming in.

Something to keep in mind, though, is that selling and buying alike affect this indicator, so a mass selloff would also register as a spike in the metric. Thus, while high volumes are usually a requirement for rallies to continue (as without interest, the run can easily die down), they alone can’t predict a further rise, as the nature of this activity can be hard to ascertain.

Dogecoin Could Hit $1 If History Repeats, Analyst Reveals When

An analyst has explained that Dogecoin may be able to hit $1 if history repeats for it. Here’s when exactly this could happen for DOGE.

Dogecoin Has Been Breaking Out Of A Parallel Channel Recently

In a new post on X, analyst Ali has discussed a potential outcome for Dogecoin based on the historical pattern. Below is the chart for the weekly price of the memecoin shared by the analyst, which reveals a similar-seeming pattern that the asset has followed over the years.

Dogecoin Price Chart

As Ali has highlighted in the chart, before both of its previous two major bull runs, Dogecoin’s weekly price consolidated inside a specific parallel channel for a notable amount of time.

The “parallel channel” here refers to a pattern in technical analysis (TA) made up of two parallel trendlines inside which the price of the asset consolidates. Parallel channels can be of different types, like ascending and descending ones, but in the context of the current discussion, channels parallel to the time axis are relevant.

The upper trendline in such a pattern is drawn by joining together tops, while the lower line connects bottoms. When the price retests either of these lines, a reversal is more probable.

This means that a retest of the upper line could break the uptrend and cause the asset to go through a drawdown. Similarly, the lower line may be a source of support and help the price reverse itself back up.

However, a break out of either of these lines can imply a continuation of the trend in that direction. The graph shows that when the weekly price of Dogecoin saw breakouts like this out of the respective consolidation channels the last two times, it went through bull rallies.

In the past couple of years, it would appear that DOGE has once again gone through a similar period of consolidation as those previous two, and recently, the coin has been breaking out.

Ali has marked a potential trajectory that Dogecoin could follow in the chart based on the precedent set by these last two bull runs. “This may sound wild, but if history is any guide, Dogecoin $DOGE could hit $1 by mid-April!” says the analyst.

From the current cryptocurrency price, such a run would suggest an increase of more than 488% for the memecoin in less than a month and a half. Obviously, a rally like this would be super impressive if it ends up playing out like this.

It remains to be seen what trajectory Dogecoin follows now that it has seemingly broken free of its long parallel consolidation channel.

DOGE Price

When writing, Dogecoin is trading around $0.17, up 36% in the past week.

Dogecoin Price Chart

Dogecoin Accumulation: DOGE Millionaires Have Shot Up By 76%

On-chain data shows the total number of Dogecoin millionaires has observed a steep increase over the past month, a sign of strong accumulation.

Dogecoin Millionaires Have Jumped 76% In Past Month

According to data from the market intelligence platform IntoTheBlock, the number of Dogecoin millionaires has been skyrocketing recently. “DOGE millionaires” here refer to the addresses that are carrying at least $1 million in their balance.

The below chart shows how the total number of such addresses has changed over the past month.

Dogecoin Millionaires

From the graph, it’s visible that the Dogecoin investors carrying between $1 million to $10 million worth of coins have seen their total count rapidly go up since the end of February.

This range would include the sharks as well as the smaller of the whales, so this trend would imply interest in the cryptocurrency has sharply risen among these large entities. Following the latest increase, the total count of addresses holding a balance in this range has crossed the 800 mark.

The largest of the investors in the market, those with more than $10 million in DOGE, have also seen their number grow in the same period, as the chart displays.

The population of these humongous whales has now crossed the 200 mark. This means that in all, there are now more than 1,000 millionaires on the Dogecoin network.

This corresponds to a growth of around 76% in the past 30 days, which is a pretty rapid increase. Since the indicator has caught pace, DOGE has also witnessed an impressive rally, which may not be a coincidence.

Naturally, if the number of these millionaires continues to rise into the near future, it would be a sign that big money interest in the memecoin is still furthering, which would be a positive sign for the rally.

DOGE Price Has Enjoyed A Sharp Rally Recently

Towards the end of last month, Dogecoin finally managed to break free of its long spell of consolidation and did so in quite the spectacular fashion as well. As the chart below shows, DOGE has observed a rapid rise in the past couple of weeks.

Dogecoin Price Chart

During this rally so far, Dogecoin has managed to reach a high beyond the $0.20 level. Since this peak, however, the coin has seen some notable drawdown, as it’s now trading around $0.15.

From the chart, it’s visible that the initial sharp crash in the memecoin had occurred at the same time as Bitcoin had plummeted following a breach of its previous all-time high price.

Unlike BTC, though, which has made some significant recovery already, DOGE is yet to close back in on its recent highs. Despite this significant pullback, though, the coin’s investors would still be carrying profits of more than 95% over the past month, showcasing just how strong its recent bullish momentum has been.

In terms of the market cap, Dogecoin is currently the nineth-largest asset in the sector, some distance behind eighth-placed Cardano (ADA).

Dogecoin Market Cap

While Dogecoin still has a comfortable gap to Shiba Inu (SHIB) in tenth, its rival is fast approaching it with a run of a whopping 131% in the past week.

Dogecoin To See 24% Rally To $0.100 If This Holds: Analyst

An analyst has explained that Dogecoin could rally towards $0.10 based on a pattern forming in its price if a support cluster continues to hold.

Dogecoin Has Observed A Buy Signal On Its 3-Day Chart

As explained by analyst Ali in a post on X, a TD-Sequential buy signal recently appeared for DOGE on its 3-day price. The “Tom Demark (TD) Sequential” here refers to an indicator in technical analysis that helps pinpoint locations of probable tops and bottoms in any asset’s price.

This indicator is made up of two phases. The first is called the “setup” phase, and it’s nine-candles long. During this phase, nine candles of the same polarity are counted, and following the ninth, the asset could be assumed to have hit a point of reversal.

Whether the setup would indicate a buy or sell signal naturally depends on the prevailing price trend. If the price were going up during the setup (the candles were green), then the setup’s completion would indicate a potential point of selling. Similarly, the TD Sequential would mark a sell signal in the opposite case.

Once the setup is complete, the second phase of the indicator, called the “countdown,” begins. This phase is thirteen candles long, and once these candles are in, the asset could once again be considered to have reached a probable bottom or top.

Now, here is a chart shared by Ali that highlights the completion of a TD-Sequential setup phase for the 3-day price of Dogecoin:

Dogecoin TD Sequential Setup

The above graph shows that the Dogecoin 3-day price has recently finished a TD-Sequential setup with red candles. This would imply that the indicator has given a buy signal for the asset.

So far, since this setup has formed, DOGE has registered two green candles on this chart, implying that the meme coin’s price may have indeed witnessed a change of direction.

In the same chart, the analyst has also highlighted a support cluster for the coin, where some important lines have converged around the $0.074 level. Based on this and the TD-Sequential pattern that has formed, Ali notes, “as long as the $0.074 support cluster continues to hold, DOGE has a great chance of rebounding to $0.100 or higher!”

From the current spot price of the cryptocurrency, a potential rally to this $0.100 target would mean a surge of around 24% for the asset. If DOGE retests the $0.074 support level and rebounds to this high, the coin would see a rally of over 35%.

DOGE Price

Dogecoin opened 2024 with a deep plunge, and the memecoin has so far been unable to recover from it, as its price has mostly been stuck in consolidation. At present, DOGE is trading around the $0.0804 mark.

Dogecoin Price Chart

Dogecoin To Double Its Price If This Barrier Breaks, Analyst Predicts

An analyst has explained how Dogecoin breaking the $0.087 barrier could open the path to DOGE price levels nearly double the recent ones.

Dogecoin Has Three Important Lines Converging At $0.087 Right Now

In a new post on X, analyst Ali has discussed what the weekly chart of DOGE is looking like right now in terms of some important historical lines. In particular, the levels of interest here are the 100-week EMA, 200-week EMA, and 0.786 Fibonacci.

A “moving average” (MA) refers to an analytical tool that calculates the mean of any given quantity over a specific period of time, and as its name implies, it moves in time and changes its value as the quantity fluctuates.

This basic tool is quite useful as it smooths out the curve by removing local fluctuations, making a study of long-term trends easier to perform. In the context of the current topic, though, a normal MA isn’t of focus, but rather a modified form called the exponential moving average (EMA).

The EMA works like the usual MA, except it places a greater weight on the most recent readings of the quantity. What this means is that the older the reading, the less weightage it has in the metric, so the line’s changes reflect the latest price direction more strongly.

Now, here is a chart that shows the trend in the 100-week and 200-week EMAs for Dogecoin, as well as the weekly price curve of the meme coin:

Dogecoin Weekly

As is visible from the above graph, these two Dogecoin EMAs have approached each other recently and have converged into a narrow range around the $0.087 level.

In the past, these two EMAs of the cryptocurrency have posed resistance to the price and it appears that the weekly chart of Dogecoin has been struggling with them again, as it has been finding rejection here during the past three weeks.

These two lines aren’t the only ones converging near $0.087, however; it would appear that the 0.786 Fibonacci level is doing the same. The Fibonacci levels listed in the chart are some ratios derived from the famous Fibonacci series.

In this series, dividing any number (except for the first few) by its succeeding number always gives a ratio of about 0.618. The square root of this number is 0.786, which is the level the analyst has marked here.

Dogecoin thus has a major wall at $0.087, made up of the convergence of all these historically significant lines. “Breaking past this barrier could open the gates for DOGE to nearly double its price, aiming for a target of $0.14,” explains the analyst.

DOGE Price

Dogecoin has observed a surge back above the $0.080 mark during the past day, as the below chart shows. It now remains to be seen if the coin will go on to retest this $0.087 level that might be so crucial for the coin.

Dogecoin Price Chart

Dogecoin Jumps 10%, But This Signal Could Bring Rally To A Stop

Dogecoin has seen a rise of about 10% during the past day, but longs are piling up on the futures market, which may be something to keep an eye on.

Dogecoin Funding Rate Attains Highly Positive Values After Rally

As explained by the on-chain analytics firm Santiment, DOGE traders are betting on the price rise to continue as long positions are being opened on the futures market.

The indicator of interest here is the “Binance funding rate,” which keeps track of the periodic fee that Dogecoin futures contract holders on Binance are exchanging with each other right now.

When the value of this metric is positive, it means the long investors are paying a premium to the short ones in order to hold onto their current positions. Such a trend implies the majority of the market holds a bullish sentiment.

On the other hand, negative values imply a bearish mentality is the dominant force in the sector as the DOGE short traders are outweighing the longs at the moment.

Now, here is a chart that shows the trend in the Dogecoin Binance funding rate over the past month:

Dogecoin Funding Rate

As displayed in the above graph, the Dogecoin funding rate on Binance has turned highly positive recently as the latest rise in the meme coin’s price has taken place.

This implies that speculators have jumped onto the opportunity and are betting on the price rise to continue. Since the longs have started piling up in this latest futures mania, the asset has only continued to trend up, suggesting that the bets of these traders have paid off so far.

However, if history is anything to go by, the market being heavily long dominated has generally not ended well for DOGE. From the chart, it’s visible that similar spikes in the Binance funding rate coincided with local tops in the cryptocurrency during the last few weeks.

The reason why such a pattern may exist is that as the futures market accumulates long positions, the chances of a long squeeze taking place become significant.

A “squeeze” refers to an event where a sudden swing in the price unleashes a cascade of liquidations on the sector. This cascade of liquidations only makes the swing sharper, thus extending the rally/crash (depending on which side of the market is taking the brunt).

When longs are much more in number, such a waterfall of liquidations is naturally easier on their side as compared to the shorts. Thus, while Dogecoin is riding on some sharp momentum right now, any pullback might result in a long squeeze, which could lead to the asset registering a notable drawdown.

DOGE Price

Following the latest rally, Dogecoin has surged towards the $0.087 level for the first time since April.

Dogecoin Price Chart

Dogecoin In Tight Zone: Why A Rally Will Happen If DOGE Clears $0.076

An analyst has explained how the next major Dogecoin resistance hurdle would be at $0.084 if the memecoin manages to clear $0.076.

Dogecoin Is Currently Sandwiched Between Major Support And Resistance Levels

In a new post on X, analyst Ali has discussed what the on-chain support and resistance levels are looking like for Dogecoin right now. A price level is said to be an on-chain support or resistance level on the basis of whether a large number of investors share their cost basis at it or not.

Cost basis” here naturally refers to the average price at which a holder acquired their DOGE. When the spot price is below the cost basis of an investor, they are naturally in a state of loss, while it being above implies they are enjoying positive returns.

The below chart shows what the distribution of Dogecoin investors looks like currently on the basis of the price range that their cost basis lies.

Dogecoin Cost Basis

For any investor, their cost basis is an important psychological level and they may be prone to making some moves whenever the spot price retests it. Thus, if a large number of holders share their cost basis close together inside a particular range, the market could potentially see a sizeable reaction when the asset’s price ventures into the range.

Generally, whenever this retest happens from above (that is, the investors had been in profits before this), the meme coin’s price could feel some degree of support.

The reason behind this is that the holders may tend to believe that if this same level had been profitable earlier, it might be so again in the future, so they participate in some accumulation.

The opposite is the case whenever the Dogecoin price retests the cost basis of a large amount of investors from below. These investors would be tempted to exit at their break-even so the cryptocurrency could face resistance.

From the above graph, it’s visible that the DOGE levels above and below the current price both host the acquisition points of a large number of addresses. In particular, the $0.071 to $0.073 range has the cost basis of almost 200,000 holders, while the $0.074 to $0.076 range has 124,000 addresses.

“Note that support outstrips resistance in strength, hinting at the potential for an upward breakout,” says Ali. If Dogecoin can manage to clear this range of significant resistance off the back of this strong support, the next price level where it will face a hurdle would be around $0.084.

The in-between levels all have a relatively low amount of investors, so at least in theory, the memecoin shouldn’t have too hard a time mowing through them. Especially considering that, once the $0.076 level is through, the block that’s providing resistance right now would turn into a support boundary.

DOGE Price

Dogecoin is currently battling against the resistance offered by the aforementioned range as its price is floating around $0.075.

Dogecoin Price Chart