DOT Price (Polkadot) Reaches Key Juncture, Is This Bulls Trap or Correction?

Polkadot (DOT) is correcting gains from the $7.5 resistance against the US Dollar. The price could start another increase if it stays above the $6.75 support.

  • DOT gained pace and tested the $7.5 resistance level against the US Dollar.
  • The price is trading above the $7.00 zone and the 100 simple moving average (4 hours).
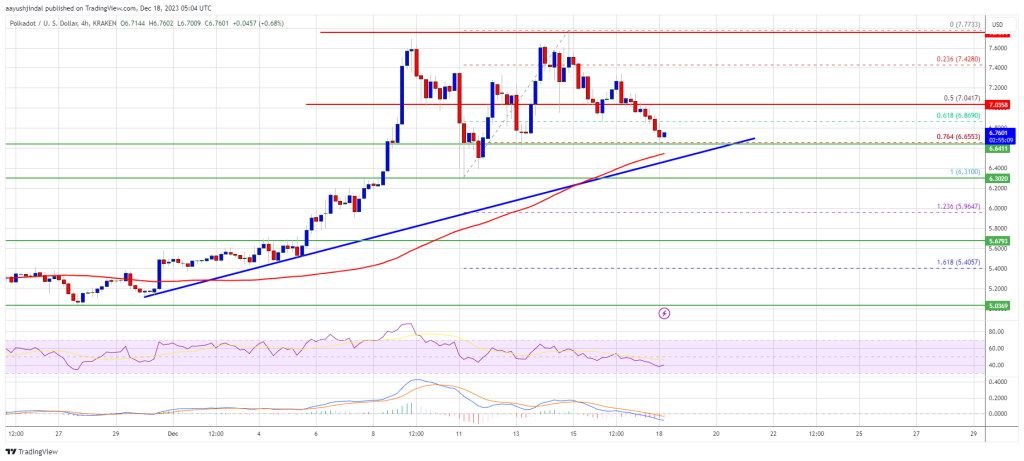
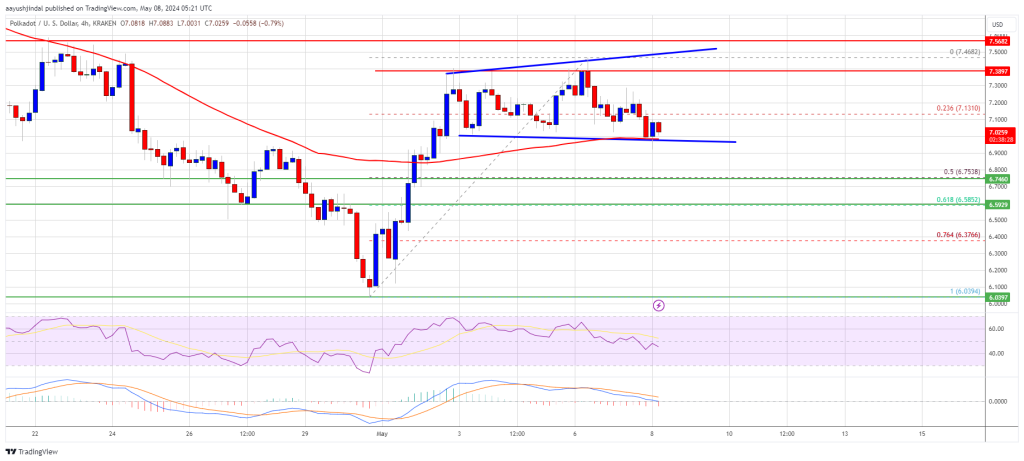
  • There is a short-term expanding triangle forming with resistance at $7.50 on the 4-hour chart of the DOT/USD pair (data source from Kraken).
  • The pair could continue to decline if it fails to stay above the $6.75 support.

Polkadot Price Holds Support

After forming a base above the $6.00 level, DOT price started a decent increase. It broke many hurdles near $6.75 and even spiked above $7.25. A high was formed at $7.46 and the price is now correcting gains, like Ethereum and Bitcoin.

There was a move below the $7.25 support zone. The price declined below the 23.6% Fib retracement level of the upward move from the $6.03 swing low to the $7.46 high.

DOT is now trading above the $7.00 zone and the 100 simple moving average (4 hours). Immediate resistance is near the $7.25 level. The next major resistance is near $7.50. There is also a short-term expanding triangle forming with resistance at $7.50 on the 4-hour chart of the DOT/USD pair.

DOT Price (Polkadot)

Source: DOTUSD on TradingView.com

A successful break above $7.50 could start another strong rally. In the stated case, the price could easily rally toward $8.00 in the near term. The next major resistance is seen near the $8.80 zone.

More Downsides in DOT?

If DOT price fails to start a fresh increase above $7.25, it could continue to move down. The first key support is near the $7.00 level and the 100 simple moving average (4 hours).

The next major support is near the $6.75 level or the 50% Fib retracement level of the upward move from the $6.03 swing low to the $7.46 high, below which the price might decline to $6.50. Any more losses may perhaps open the doors for a move toward the $6.10 support zone or $6.00.

Technical Indicators

4-Hours MACD – The MACD for DOT/USD is now losing momentum in the bearish zone.

4-Hours RSI (Relative Strength Index) – The RSI for DOT/USD is now below the 50 level.

Major Support Levels – $7.00, $6.75 and $6.50.

Major Resistance Levels – $7.25, $7.50, and $8.00.
DOT Price (Polkadot) Approaches Key Level: Should Traders Brace for Sharp Drop?

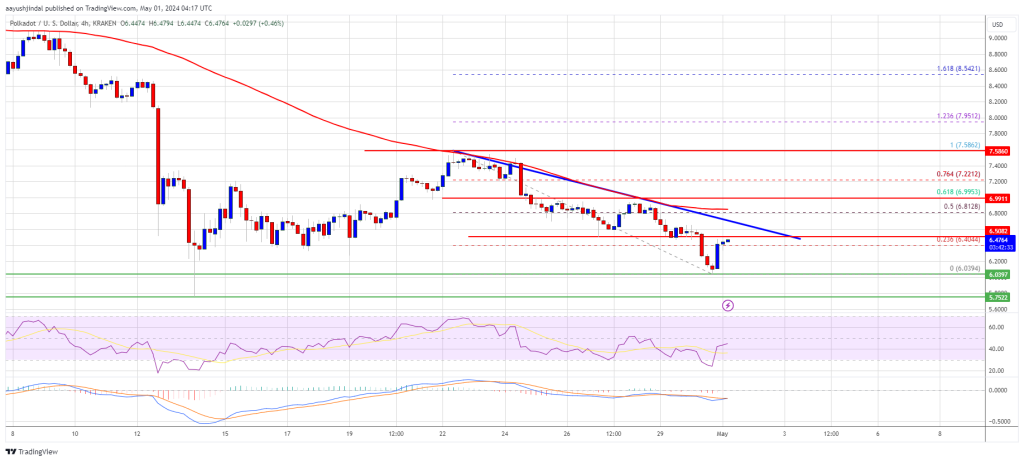
Polkadot (DOT) is showing bearish signs below the $8 resistance against the US Dollar. The price could extend its decline if it fails to stay above $6.00.

  • DOT is gaining pace below the $8.80 and $8.00 levels against the US Dollar.
  • The price is trading below the $7.20 zone and the 100 simple moving average (4 hours).
  • There is a key bearish trend line forming with resistance at $6.50 on the 4-hour chart of the DOT/USD pair (data source from Kraken).
  • The pair could continue to decline toward the $5.00 support zone.

Polkadot Price Resumes Drop

After a steady increase, DOT price faced resistance near the $7.60 zone. It formed a short-term top and started a fresh decline below the $7.00 level, like Ethereum and Bitcoin.

There was a move below the $6.20 support zone. A low was formed near $6.03 and the price is now consolidating losses. It is slowly moving higher above the $6.35 level and the 23.6% Fib retracement level of the downward move from the $7.58 swing high to the $6.03 low.

DOT is now trading below the $7.00 zone and the 100 simple moving average (4 hours). Immediate resistance is near the $6.50 level. There is also a key bearish trend line forming with resistance at $6.50 on the 4-hour chart of the DOT/USD pair.

DOT Price (Polkadot)

Source: DOTUSD on TradingView.com

The next major resistance is near $7.00 or the 61.8% Fib retracement level of the downward move from the $7.58 swing high to the $6.03 low. A successful break above $7.00 could start another strong rally. In the stated case, the price could easily rally toward $8.20 in the near term. The next major resistance is seen near the $10.00 zone.

More Downsides in DOT?

If DOT price fails to start a fresh increase above $7.00, it could continue to move down. The first key support is near the $6.00 level.

The next major support is near the $5.65 level, below which the price might decline to $5.00. Any more losses may perhaps open the doors for a move toward the $4.20 support zone or the trend line.

Technical Indicators

4-Hours MACD – The MACD for DOT/USD is now losing momentum in the bearish zone.

4-Hours RSI (Relative Strength Index) – The RSI for DOT/USD is now below the 50 level.

Major Support Levels – $6.00, $5.65 and $5.00.

Major Resistance Levels – $6.50, $7.00, and $8.50.

DOT Price (Polkadot) Jumps 10%, Why Bulls Can Pump It To $12

Polkadot (DOT) is gaining pace above the $10.00 resistance against the US Dollar. The price could extend its rally toward the $12.00 level in the near term.

  • DOT is gaining pace above the $9.80 and $10.00 levels against the US Dollar.
  • The price is trading above the $10.00 zone and the 100 simple moving average (4 hours).
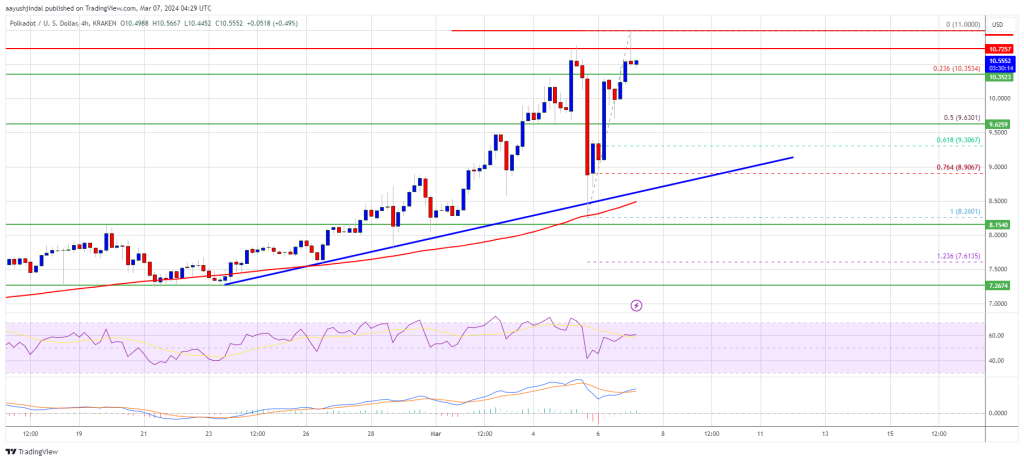
  • There is a key bullish trend line forming with support at $9.10 on the 4-hour chart of the DOT/USD pair (data source from Kraken).
  • The pair could continue to rise toward the $12 resistance zone.

Polkadot Price Resumes Rally

After forming a base above the $8.00 level, DOT price started a fresh rally. It gained over 20% in a few days and even outperformed Ethereum and Bitcoin at times.

There was a clear move above the $9.50 and $10.00 resistance levels. The price traded to a new multi-month high at $11.00 and is currently consolidating gains. There was a minor pullback below the $10.75 level. The price is still above the 23.6% Fib retracement level of the upward move from the $8.26 swing low to the $11.00 high.

DOT is now trading well above the $10.00 zone and the 100 simple moving average (4 hours). There is also a key bullish trend line forming with support at $9.10 on the 4-hour chart of the DOT/USD pair. The trend line is close to the 61.8% Fib retracement level of the upward move from the $8.26 swing low to the $11.00 high.

DOT Price (Polkadot)

Source: DOTUSD on TradingView.com

Immediate resistance is near the $10.75 level. The next major resistance is near $11.00. A successful break above $11.00 could start another strong rally. In the stated case, the price could easily rally toward $12.00 in the near term. The next major resistance is seen near the $13.50 zone.

Are Dips Supported in DOT?

If DOT price fails to start a fresh increase above $11.00, it could start a downside correction. The first key support is near the $10.35 level.

The next major support is near the $10.00 level, below which the price might decline to $9.50. Any more losses may perhaps open the doors for a move toward the $9.20 support zone or the trend line.

Technical Indicators

4-Hours MACD – The MACD for DOT/USD is now gaining momentum in the bullish zone.

4-Hours RSI (Relative Strength Index) – The RSI for DOT/USD is now above the 50 level.

Major Support Levels – $10.35, $10.00 and $9.50.

Major Resistance Levels – $10.75, $11.00, and $12.00.

DOT Price (Polkadot) Looks Set To Crush $10 And Rally Further

Polkadot (DOT) is gaining pace above the $8.80 resistance against the US Dollar. The price could extend its rally once it settles above the $10 barrier.

  • DOT is gaining pace above the $8.50 and $8.80 levels against the US Dollar.
  • The price is trading above the $9.00 zone and the 100 simple moving average (4 hours).
  • There is a key bullish trend line forming with support at $9.20 on the 4-hour chart of the DOT/USD pair (data source from Kraken).
  • The pair could continue to rise unless the bears are able to defend the $10 resistance zone.

Polkadot Price Restarts Rally

After forming a base above the $7.50 level, DOT price started a steady increase. It gained over 25% in a few days and even outperformed Ethereum and Bitcoin at times.

There was a clear move above the $8.50 and $8.80 resistance levels. The price even traded close to the $10.00 level. A new multi-week high is formed near $9.89 and the price is now consolidating gains. It is holding gains above the 23.6% Fib retracement level of the upward move from the $8.57 swing low to the $9.89 high.

DOT is now trading above the $9.00 zone and the 100 simple moving average (4 hours). There is also a key bullish trend line forming with support at $9.20 on the 4-hour chart of the DOT/USD pair. The trend line is close to the 50% Fib retracement level of the upward move from the $8.57 swing low to the $9.89 high.

DOT Price (Polkadot)

Source: DOTUSD on TradingView.com

Immediate resistance is near the $9.85 level. The next major resistance is near $10.00. A successful break above $10.00 could start another strong rally. In the stated case, the price could easily rally toward $12.00 in the near term. The next major resistance is seen near the $13.50 zone.

Are Dips Supported in DOT?

If DOT price fails to start a fresh increase above $10.00, it could start a downside correction. The first key support is near the $9.50 level.

The next major support is near the $9.20 level, below which the price might decline to $8.80. Any more losses may perhaps open the doors for a move toward the $8.50 support zone.

Technical Indicators

4-Hours MACD – The MACD for DOT/USD is now gaining momentum in the bullish zone.

4-Hours RSI (Relative Strength Index) – The RSI for DOT/USD is now above the 50 level.

Major Support Levels – $9.50, $9.20 and $8.50.

Major Resistance Levels – $9.85, $10.00, and $12.00.

DOT Price (Polkadot) Uptrend To Continue? These Could Be The Factors To Watch

Polkadot (DOT) is gaining pace above the $6.80 resistance against the US Dollar. The price could gain bullish momentum if it clears the $7.28 resistance.

  • DOT is trading in a positive zone from the $6.00 support against the US Dollar.
  • The price is trading near the $7.00 zone and the 100 simple moving average (4 hours).
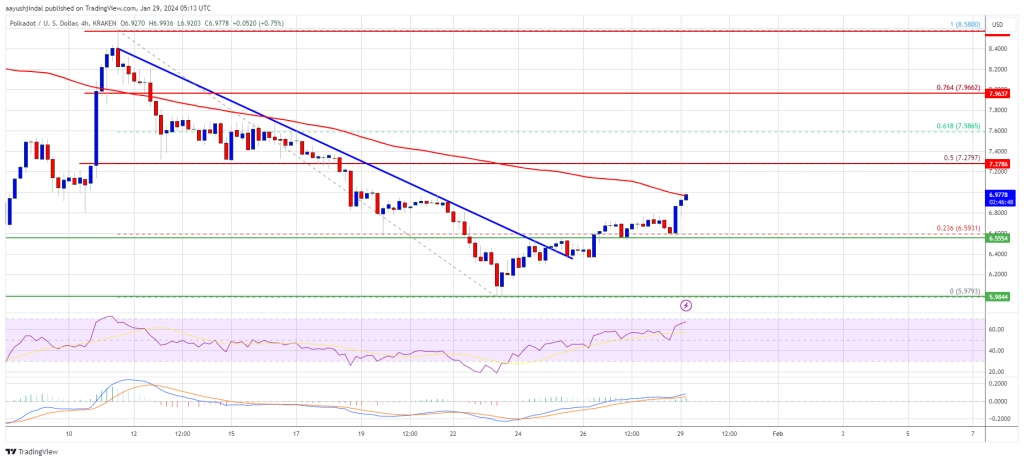
  • There was a break above a key bearish trend line with resistance near $6.50 on the 4-hour chart of the DOT/USD pair (data source from Kraken).
  • The pair could continue to rise unless the bears are able to defend the $7.28 resistance zone.

Polkadot Price Restarts Increase

After a steady decline, DOT price found support near the $6.00 zone. A low was formed at $5.97 and Polkadot recently started a fresh increase. The price was able to clear the $6.20 and $6.50 resistance levels to move into a positive zone, like Bitcoin and Ethereum.

There was a break above a key bearish trend line with resistance near $6.50 on the 4-hour chart of the DOT/USD pair. The pair even surpassed the 23.6% Fib retracement level of the downward move from the $8.58 swing high to the $5.97 low.

DOT is now trading near the $7.00 zone and the 100 simple moving average (4 hours). Immediate resistance is near the $7.20 level. The next major resistance is near $7.28 or the 50% Fib retracement level of the downward move from the $8.58 swing high to the $5.97 low.

DOT Price (Polkadot)

Source: DOTUSD on TradingView.com

A successful break above $7.28 could start another strong rally. In the stated case, the price could easily rally toward $8.00 in the near term. The next major resistance is seen near the $8.50 zone.

Are Dips Supported in DOT?

If DOT price fails to start a fresh increase above $7.28, it could start a fresh decline. The first key support is near the $6.60 level.

The next major support is near the $6.00 level, below which the price might decline to $5.65. Any more losses may perhaps open the doors for a move toward the $5.32 support zone.

Technical Indicators

4-Hours MACD – The MACD for DOT/USD is now gaining momentum in the bullish zone.

4-Hours RSI (Relative Strength Index) – The RSI for DOT/USD is now above the 50 level.

Major Support Levels – $6.60, $6.00 and $5.65.

Major Resistance Levels – $7.28, $8.00, and $8.50.

DOT Price (Polkadot) Pumps 15% As Bulls Aim For Surge To $10

Polkadot (DOT) is gaining pace above the $7.50 resistance against the US Dollar. The price is up nearly 15% and might rise further toward $10.00.

  • DOT is showing heavy bullish signs from the $6.65 support against the US Dollar.
  • The price is trading above the $8.00 zone and the 100 simple moving average (4 hours).
  • There was a break above a key bearish trend line with resistance near $7.80 on the 4-hour chart of the DOT/USD pair (data source from Kraken).
  • The pair could continue to rally unless the bears are able to defend the $8.88 resistance zone.

Polkadot Price Restarts Rally

After a steady decline, DOT price found support near the $6.65 zone. A low was formed at $6.64 and Polkadot recently started a fresh increase. The price was able to clear the $6.85 and $7.00 resistance levels to move into a positive zone, like Bitcoin and Ethereum.

There was a break above a key bearish trend line with resistance near $7.80 on the 4-hour chart of the DOT/USD pair. The pair even surpassed the 50% Fib retracement level of the downward move from the $9.58 swing high to the $6.64 low.

DOT is now trading above the $8.00 zone and the 100 simple moving average (4 hours). Immediate resistance is near the $8.45 level. The next major resistance is near $8.88 or the 76.4% Fib retracement level of the downward move from the $9.58 swing high to the $6.64 low.

DOT Price (Polkadot)

Source: DOTUSD on TradingView.com

A successful break above $8.88 could start another strong rally. In the stated case, the price could easily rally toward $9.50 in the near term. The next major resistance is seen near the $10.00 zone.

Are Dips Supported in DOT?

If DOT price fails to start a fresh increase above $8.45, it could start a fresh decline. The first key support is near the $7.80 level and the same trend line.

The next major support is near the $7.50 level, below which the price might decline to $7.00. Any more losses may perhaps open the doors for a move toward the $6.65 support zone.

Technical Indicators

4-Hours MACD – The MACD for DOT/USD is now gaining momentum in the bullish zone.

4-Hours RSI (Relative Strength Index) – The RSI for DOT/USD is now above the 50 level.

Major Support Levels – $7.80, $7.500 and $7.00.

Major Resistance Levels – $8.45, $8.88, and $9.50.

DOT Price (Polkadot) Holds Strong At $6.6, Signs Point To Fresh Rally Ahead

Polkadot (DOT) is correcting gains from the $7.75 against the US Dollar. The price could start a fresh increase unless there is a close below $6.30.

  • DOT is consolidating gains above the $6.60 support zone against the US Dollar.
  • The price is trading above the $6.65 zone and the 100 simple moving average (4 hours).
  • There is a key bullish trend line forming with support near $6.65 on the 4-hour chart of the DOT/USD pair (data source from Kraken).
  • The pair could start a fresh increase if the bulls protect the $6.65 and $6.30 support levels.

Polkadot Price Holds Ground

After forming a base above the $5.50 support, DOT price started a decent increase. The price was able to clear the $5.85 and $6.00 resistance levels to move into a positive zone, like Bitcoin and Ethereum.

Polkadot even surpassed the $6.65 resistance zone and settled above the 100 simple moving average (4 hours). Finally, the bears appeared near the $7.75 zone. A high was formed near $7.77 and the price is now correcting gains. There was a drop below the $7.20 and $7.00 levels.

DOT declined below the 61.8% Fib retracement level of the upward move from the $6.31 swing low to the $7.77 high. However, it is still above the $6.65 zone and the 100 simple moving average (4 hours).

There is also a key bullish trend line forming with support near $6.65 on the 4-hour chart of the DOT/USD pair. The trend line is close to the 76.4% Fib retracement level of the upward move from the $6.31 swing low to the $7.77 high.

DOT Price (Polkadot)

Source: DOTUSD on TradingView.com

Immediate resistance is near the $7.05 level. The next major resistance is near $7.20. A successful break above $7.20 could start another strong rally. In the stated case, the price could easily rally toward $7.75 in the near term. The next major resistance is seen near the $8.00 zone.

More Losses in DOT?

If DOT price fails to start a fresh increase above $7.05, it could continue to move down. The first key support is near the $6.65 level and the trend line.

The next major support is near the $6.30 level, below which the price might decline to $5.70. Any more losses may perhaps open the doors for a move toward the $5.00 support zone.

Technical Indicators

4-Hours MACD – The MACD for DOT/USD is now gaining momentum in the bearish zone.

4-Hours RSI (Relative Strength Index) – The RSI for DOT/USD is now below the 50 level.

Major Support Levels – $6.65, $6.30 and $5.70.

Major Resistance Levels – $7.05, $7.20, and $7.75.

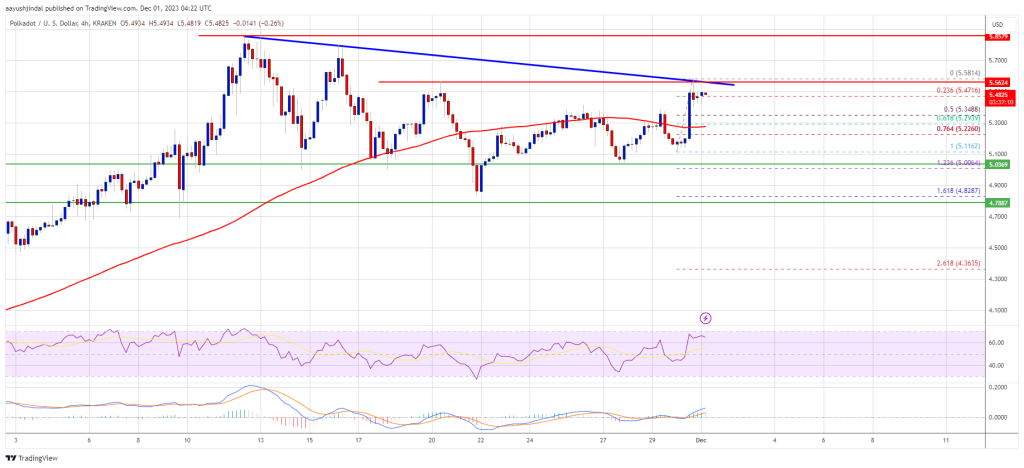
DOT Price (Polkadot) Spikes 5% and Primed To Surge Toward $6

Polkadot (DOT) is gaining pace above the $5.25 resistance against the US Dollar. The price could surge further toward the $5.85 and $6.00 levels.

  • DOT is gaining pace above the $5.25 resistance zone against the US Dollar.
  • The price is trading above the $5.30 zone and the 100 simple moving average (4 hours).
  • There is a key bearish trend line forming with resistance near $5.55 on the 4-hour chart of the DOT/USD pair (data source from Kraken).
  • The pair could gain bullish momentum if there is a close above $5.55 and $5.60.

Polkadot Price Regains Strength

After consolidating above the $5.00 support, DOT price started a decent increase. The price was able to clear the $5.20 and $5.25 resistance levels to move into a positive zone, like Bitcoin and Ethereum.

Polkadot cleared the 100 simple moving average (4 hours) and tested the $5.60 resistance. A high is formed near $5.58 and the price is now consolidating gains. It is up nearly 5% and shows signs of more gains in the coming sessions.

DOT price is now trading above the $5.30 zone and the 100 simple moving average (4 hours). Immediate resistance is near the $5.55 level. There is also a key bearish trend line forming with resistance near $5.55 on the 4-hour chart of the DOT/USD pair.

DOT Price (Polkadot)

Source: DOTUSD on TradingView.com

The next major resistance is near $5.60. A successful break above $5.60 could start another strong rally. In the stated case, the price could easily rally toward $5.85 in the near term. The next major resistance is seen near the $6.00 zone.

Are Dips Supported in DOT?

If DOT price fails to continue higher above $5.55 or $5.60, it could start a downside correction. The first key support is near the $5.35 level.

The next major support is near the $5.30 level or the 61.8% Fib retracement level of the upward move from the $5.11 swing low to the $5.58 high, below which the price might decline to $5.10. Any more losses may perhaps open the doors for a move toward the $5.00 support zone.

Technical Indicators

4-Hours MACD – The MACD for DOT/USD is now gaining momentum in the bullish zone.

4-Hours RSI (Relative Strength Index) – The RSI for DOT/USD is now above the 50 level.

Major Support Levels – $5.30, $5.10 and $5.00.

Major Resistance Levels – $5.55, $5.60, and $6.00.

DOT Price (Polkadot) Surge to $5.5 – Are Bulls Ready For This?

Polkadot (DOT) is gaining pace above the $4.50 resistance against the US Dollar. The price could surge toward $5.5 if it clears the $4.80 resistance.

  • DOT is slowly moving higher above the $4.50 resistance zone against the US Dollar.
  • The price is trading above the $4.60 zone and the 100 simple moving average (4 hours).
  • There is a key bullish trend line forming with support near $4.50 on the 4-hour chart of the DOT/USD pair (data source from Kraken).
  • The pair could gain bullish momentum if there is a close above $4.80 and $4.85.

Polkadot Price Regains Strength

After forming a base above the $4.00 handle, DOT price started a decent increase. The price was able to clear the key barrier at $4.20 to enter a positive zone, like Bitcoin and Ethereum.

Polkadot cleared the $4.50 resistance zone and the 100 simple moving average (4 hours). It traded to a new multi-week high at $4.803 and is now consolidating gains. It is well above the 23.6% Fib retracement level of the upward move from the $4.046 swing low to the $4.803 high.

DOT price is now trading above the $4.60 zone and the 100 simple moving average (4 hours). There is also a key bullish trend line forming with support near $4.50 on the 4-hour chart of the DOT/USD pair. The trend line is close to the 50% Fib retracement level of the upward move from the $4.046 swing low to the $4.803 high.

DOT Price (Polkadot)

Source: DOTUSD on TradingView.com

Immediate resistance is near the $4.80 level. The next major resistance is near $4.85. A successful break above $4.85 could start another strong rally. In the stated case, the price could easily rally toward $5.20 in the coming days. The next major resistance is seen near the $5.50 zone.

Are Dips Supported in DOT?

If DOT price fails to continue higher above $4.80 or $4.85, it could start a downside correction. The first key support is near the $4.62 level.

The next major support is near the $4.50 level and the trend line, below which the price might decline to $4.35. Any more losses may perhaps open the doors for a move toward the $4.20 support zone.

Technical Indicators

4-Hours MACD – The MACD for DOT/USD is now gaining momentum in the bullish zone.

4-Hours RSI (Relative Strength Index) – The RSI for DOT/USD is now above the 50 level.

Major Support Levels – $4.62, $4.50 and $4.20.

Major Resistance Levels – $4.80, $4.85, and $5.50.

DOT Price (Polkadot) Hints At Potential Recovery, Here’s What Could Propel It To $4.8

Polkadot’s DOT is recovering higher from the $3.92 support against the US Dollar. The price could gain pace if it clears the $4.20 and $4.35 resistance levels.

  • DOT is slowly moving higher above the $4.05 resistance zone against the US Dollar.
  • The price is trading just above the $4.15 zone and the 100 simple moving average (4 hours).
  • There is a key bearish trend line forming with resistance near $4.175 on the 4-hour chart of the DOT/USD pair (data source from Kraken).
  • The pair could gain bullish momentum if there is a close above $4.20 and $4.35.

Polkadot’s DOT Price Faces Uphill Task

After a sharp decline, DOT price found support near the $3.90 zone. A low is formed near $3.91 and the price is now attempting a fresh increase, like Bitcoin and Ethereum.

There was a break above the $4.00 and $4.05 resistance levels. The price surpassed the 23.6% Fib retracement level of the downward move from the $4.80 swing high to the $3.91 low. DOT is now trading just above the $4.15 zone and the 100 simple moving average (4 hours).

Immediate resistance is near the $4.20 level. There is also a key bearish trend line forming with resistance near $4.175 on the 4-hour chart of the DOT/USD pair.

DOT Price (Polkadot)

Source: DOTUSD on TradingView.com

The next major resistance is near $4.35. It is near the 50% Fib retracement level of the downward move from the $4.80 swing high to the $3.91 low. A successful break above $4.35 could start a strong rally. In the stated case, the price could easily rally toward $4.80 in the coming days. The next major resistance is seen near the $5.0 zone.

Another Decline?

If DOT price fails to continue higher above $4.20 or $4.35, it could start another decline. The first key support is near the $4.05 level.

The next major support is near the $3.90 level and the last low, below which the price might decline to $3.75. Any more losses may perhaps open the doors for a move toward the $3.50 support zone.

Technical Indicators

4-Hours MACD – The MACD for DOT/USD is now gaining momentum in the bullish zone.

4-Hours RSI (Relative Strength Index) – The RSI for DOT/USD is now above the 50 level.

Major Support Levels – $4.05, $3.90 and $3.75.

Major Resistance Levels – $4.20, $4.35, and $4.80.

Charted: Polkadot (DOT) Setting Up For Fresh Surge Above $40

Polkadot’s DOT started a fresh increase from the $28.00 support against the US Dollar. It is rising and the bulls seem to be eyeing an upside break above the $40.00 resistance

  • DOT is holding the ground above the $35.00 and $36.00 levels against the US dollar.
  • The price is trading nicely above the $35.00 support and the 100 simple moving average (4-hours).
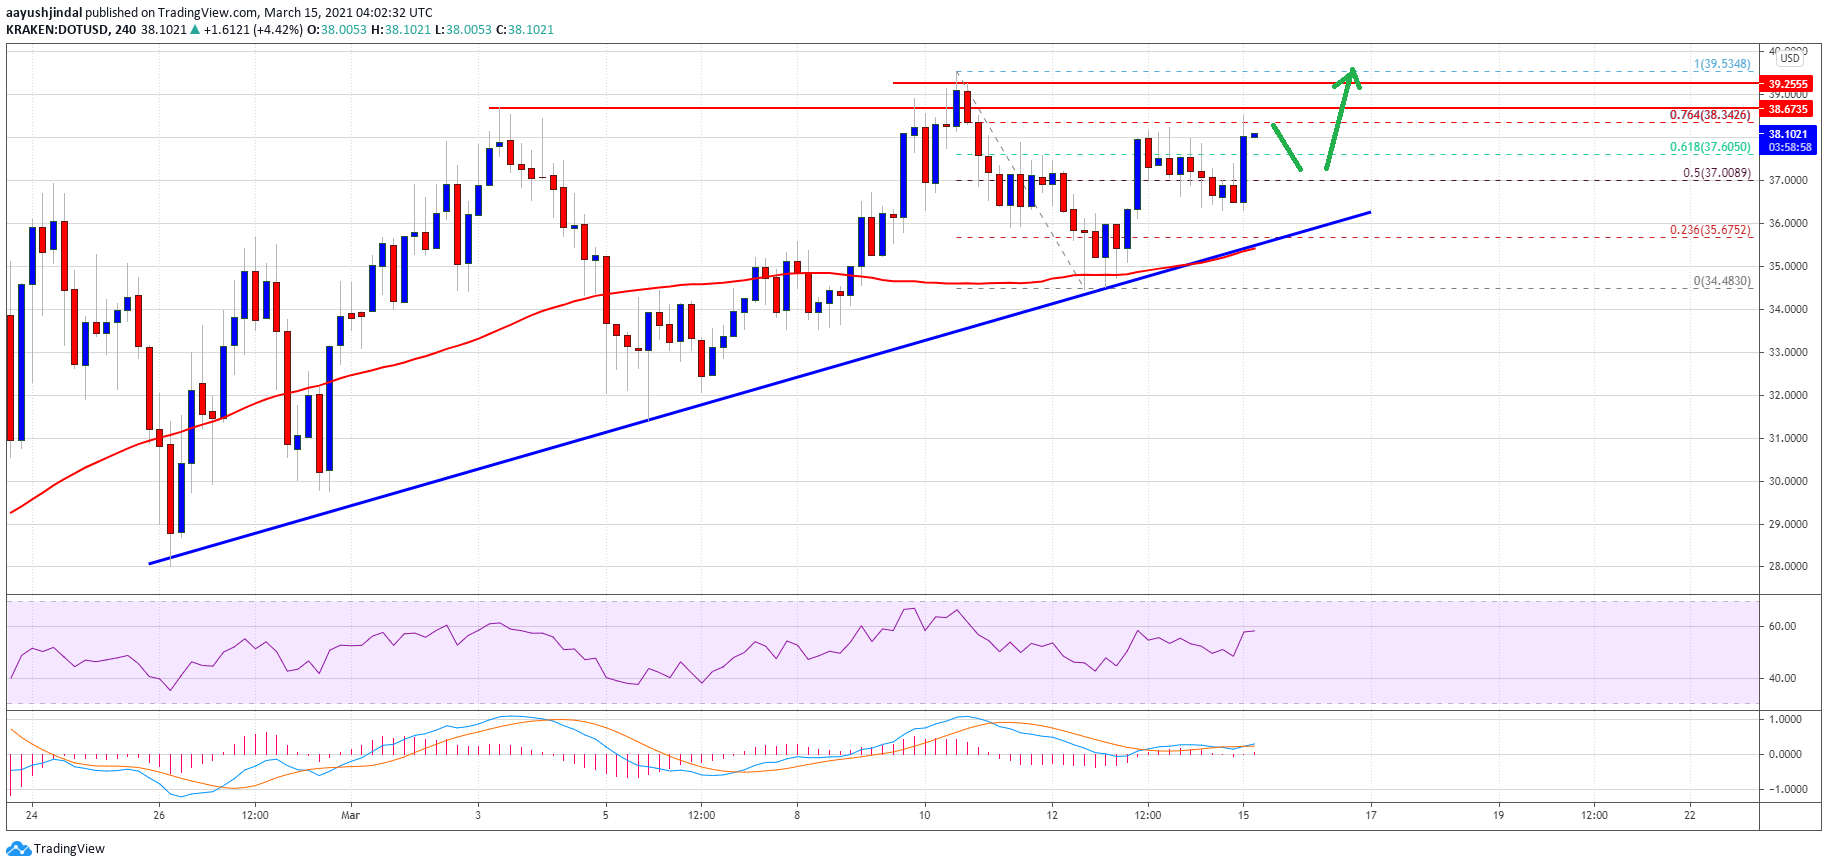
  • There is a major bullish trend line forming with support near $35.80 on the 4-hours chart of the DOT/USD pair (data source from Kraken).
  • The pair could start a strong rally once it clears the $39.50 and $40.00 resistance levels.

Polkadot’s DOT Eyes Fresh Surge

After correcting towards $28.000, DOT started a fresh increase. It recovered above the $30.00 and $32.00 levels to move back into a positive zone.

The bulls were able to push the price above the $35.00 level and 100 simple moving average (4-hours). The recent swing low was formed near $34.83 before the price climbed above $36.00. There was a break above the 50% Fib retracement level of the downward move from the $39.53 swing high to $34.83 swing low.

The price is now trading nicely above the $37.00 level. There is also a major bullish trend line forming with support near $35.80 on the 4-hours chart of the DOT/USD pair.

Polkadot (DOT)

Source: DOTUSD on TradingView.com

An immediate resistance is near the $38.35 level. It is close to the 76.4% Fib retracement level of the downward move from the $39.53 swing high to $34.83 swing low. The main resistance is still near the $39.50 and $40.00 levels.

A successful break above $39.50 and a close above $40.00 could start a strong rally. In the stated case, the price could easily rise 10%-15% in the near term.

Dips Supported?

If DOT price fails to continue higher above $39.50 or $40.00, there could be a fresh decline. The first key support is near the $37.60 and $37.50 levels.

The next major support is near the $35.80 level and the bullish trend line. Any more losses may perhaps open the doors for a move towards the $32.00 support zone.

Technical Indicators

4-Hours MACD – The MACD for DOT/USD is now gaining momentum in the bullish zone.

4-Hours RSI (Relative Strength Index) – The RSI for DOT/USD is now above the 50 level.

Major Support Levels – $37.50, $36.00 and $35.80.

Major Resistance Levels – $38.35, $39.50 and $40.00.