Polkadot Price On The Verge Of Massive Breakout, Can It Reach $25?

Polkadot (DOT) has come under the spotlight with crypto analysts laying out bullish narratives for the crypto asset. One of them is crypto expert Michaël van de Poppe, who believes Polkadot could rise to as high as $25 in this bull run

Polkadot Could Reach $25 On Next Leg Up

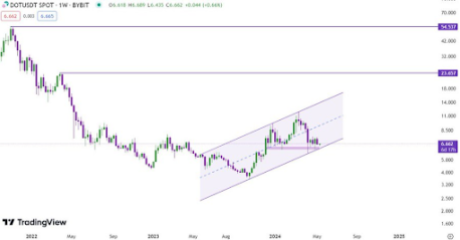
Michaël van de Poppe mentioned in an X (formerly Twitter) post that Polkadot’s next rally will see it climb between $20 and $25. He explained that the crypto token has seen a substantial correction in the past months, but it showed enough strength by coming back to pre-rally levels. The analyst further claimed that Polkadot has bottomed, “especially since JAM Whitepaper came out.”

As such, he believes that Polkadot is more than primed for this rally, which could propel it to such heights. The crypto analyst has been a big believer in Polkadot’s potential. He previously included Polkadot in a list of crypto tokens that he believes are undervalued. He claimed that DOT’s valuation was still at a cycle low, which had opened up a “huge opportunity” to invest in it. 

Van de Poppe is very much invested in Polkadot because of its technology. In a previous X post, he highlighted how the JAM (Join-Accumualte Machine) Paper, which ushered in Polkadot 2.0, would revolutionize DOT’s ecosystem. He also claimed that Polkadot is the “second largest blockchain in terms of developers and growth.” Therefore, he expects DOT’s price to complement the team’s efforts soon enough. 

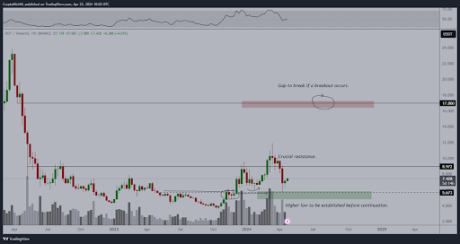
Meanwhile, Van de Poppe expects Polkadot to reach as high as $20 in the third quarter of this year. For now, he believes that the $8 and $17 range are crucial resistance levels that the crypto token must break out of to enjoy such a parabolic rally. 
Polkadot 1

A More Bullish Prediction For DOT

Crypto analyst Crypto Thanos offered a more bullish prediction for Polkadot, stating that the crypto token climbing above $50 is “easily achievable” in this bull run. He believes this price is attainable because he expects institutions to get interested in large caps like Polkadot. He also noted Polkadot’s collaboration with Tie, which aims to increase institutional exposure and access. 

It is worth noting that Polkadot’s all-time high (ATH) is currently $55, which makes Thanos’ prediction for the crypto token feasible. Crypto tokens are known to usually surpass their ATH in every bull run

Polkadot 2

Crypto analyst Captain Faibik provided insights into what to expect from Polkadot in the short term. He predicts the crypto token will record a 35% “bullish rally” soon enough. He said a “major trendline breakout/retest has already been confirmed” for DOT on the four-hour timeframe chart. 

At the time of writing, Polkadot is trading at around $7.11, up over 2% in the last 24 hours, according to data from CoinMarketCap. 
Polkadot price chart from Tradingview.com

DOT Price (Polkadot) Reaches Key Juncture, Is This Bulls Trap or Correction?

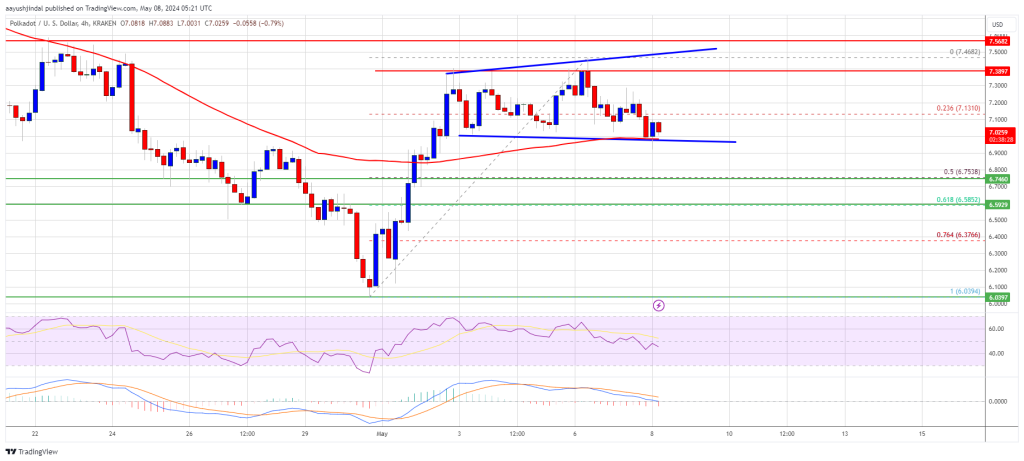
Polkadot (DOT) is correcting gains from the $7.5 resistance against the US Dollar. The price could start another increase if it stays above the $6.75 support.

  • DOT gained pace and tested the $7.5 resistance level against the US Dollar.
  • The price is trading above the $7.00 zone and the 100 simple moving average (4 hours).
  • There is a short-term expanding triangle forming with resistance at $7.50 on the 4-hour chart of the DOT/USD pair (data source from Kraken).
  • The pair could continue to decline if it fails to stay above the $6.75 support.

Polkadot Price Holds Support

After forming a base above the $6.00 level, DOT price started a decent increase. It broke many hurdles near $6.75 and even spiked above $7.25. A high was formed at $7.46 and the price is now correcting gains, like Ethereum and Bitcoin.

There was a move below the $7.25 support zone. The price declined below the 23.6% Fib retracement level of the upward move from the $6.03 swing low to the $7.46 high.

DOT is now trading above the $7.00 zone and the 100 simple moving average (4 hours). Immediate resistance is near the $7.25 level. The next major resistance is near $7.50. There is also a short-term expanding triangle forming with resistance at $7.50 on the 4-hour chart of the DOT/USD pair.

DOT Price (Polkadot)

Source: DOTUSD on TradingView.com

A successful break above $7.50 could start another strong rally. In the stated case, the price could easily rally toward $8.00 in the near term. The next major resistance is seen near the $8.80 zone.

More Downsides in DOT?

If DOT price fails to start a fresh increase above $7.25, it could continue to move down. The first key support is near the $7.00 level and the 100 simple moving average (4 hours).

The next major support is near the $6.75 level or the 50% Fib retracement level of the upward move from the $6.03 swing low to the $7.46 high, below which the price might decline to $6.50. Any more losses may perhaps open the doors for a move toward the $6.10 support zone or $6.00.

Technical Indicators

4-Hours MACD – The MACD for DOT/USD is now losing momentum in the bearish zone.

4-Hours RSI (Relative Strength Index) – The RSI for DOT/USD is now below the 50 level.

Major Support Levels – $7.00, $6.75 and $6.50.

Major Resistance Levels – $7.25, $7.50, and $8.00.

Polkadot To Sponsor Messi’s Inter Miami: DOT To The Moon?

The Polkadot community has approved a proposal to sponsor Inter Miami, the football club co-owned by David Beckham and featuring superstar Lionel Messi. The move could be a strategic decision to propel Polkadot, a smart contracts platform similar to Ethereum, into the global spotlight. 

Polkadot To Sponsor Inter Miami

The proposal, approved by Polkadot’s Open Gov community, sought 968,000 DOT (roughly $6.5 million) to secure the sponsorship. Under the “sports sponsorship fund,” the goal was to partner with Inter Miami, a team described as one of the “world’s most engaging and followed sports teams.” 

While the goal is to “elevate” Polkadot’s global brand visibility, the plan is to develop other deeper integration, leveraging Inter Miami’s global fanbase.

For instance, the team plans to enhance user experience through engaging non-fungible tokens (NFTs) and other gamified experiences deployed on Polkadot’s parachains. Additionally, the team plans to explore how Polkadot-based solutions can be implemented at Inter Miami, resulting in greater efficiency and improved fan engagement initiatives. 

While the potential deal’s specifics are confidential, the proposal emphasizes transparency. Accordingly, funds will be held in a multi-signature wallet, accessible only with community approval. Moreover, ORSEN SA, a Swiss sports marketing agency, will manage the partnership rights.

Polkadot’s Plans to Scale

As Polkadot enhances its global visibility, developers are also working on activating a key update: “Asynchronous Backing.” Last year, Sophia Gold, the Engineering Lead at Parity Technologies, said the technology would be a game changer. 

Asynchronous Backing will allow Polkadot to scale the number of Parachains from 100 to 1,000 by the end of the year. The network will boost its transaction processing capacity, with Polkadot supporting more “independent blockchains” via Parachains. 

Furthermore, improvements via techniques like “pipelining” will permit multiple parachains to process data simultaneously, halving transaction confirmation times.

Though Polkadot continues to enhance its network and strike more deals, DOT prices remain under pressure. At spot rates, DOT is down 40% from 2024 highs. While CoinMarketCap data shows that the coin has risen 14% in the last week, the failure of bulls to break above $7.5 is a concern.

Polkadot price trending upward on the daily chart | Source: DOTUSDT on Binance, TradingView

Technically, a high volume lifting the coin above this local liquidation level would pave the road for an expansion toward $9 and March 2024 high in the coming sessions.

Record-Breaking Q1 For Polkadot: Daily Active Addresses Hit 514,000 As DOT Price Surges 7%

According to a Messari report, the Polkadot (DOT) blockchain protocol made significant progress in the first quarter (Q1) of the year in terms of market capitalization, revenue, and Cross-Consensus Message Format (XCM) activity, as well as a record increase in daily active addresses.

DOT’s Market Cap Surges 16% QoQ

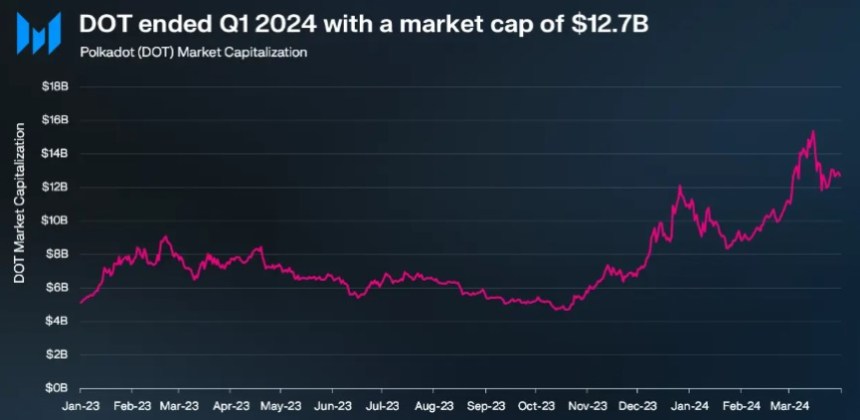
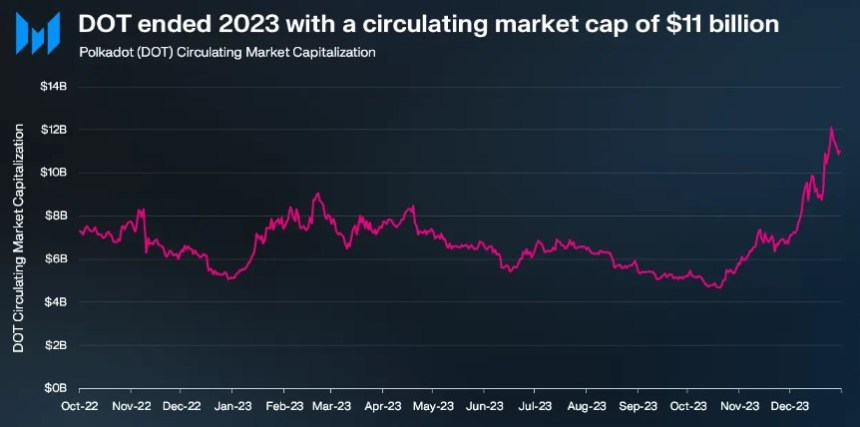
During Q4 2023, Polkadot’s market capitalization experienced a notable 111% quarter-on-quarter (QoQ) increase, reaching $8.4 billion. Building on this momentum, Q1 2024 witnessed a further 16% QoQ rise, elevating the circulating market cap to $12.7 billion. 

Despite these gains, DOT’s market capitalization remains 80% below its all-time high of $55.5 billion, set on November 8, 2021. 

Polkadot

In Q4 2023, Polkadot’s revenue also skyrocketed by 2,880% QoQ, amounting to $2.8 million. Per the report, this surge was primarily attributed to an exponential increase in extrinsics, driven by the Polkadot Inscriptions. 

However, revenue metrics for Q1 2024 declined significantly on a QoQ basis, with revenue in USD dropping by 91% to $241,000 and revenue in DOT decreasing by 92% to 28,800. It is worth noting that Polkadot’s revenue tends to be relatively lower compared to its competitors due to the network’s structural design.

Polkadot’s XCM activity continued to show growth in Q1 2024. Daily XCM transfers surged by 89% QoQ to reach 2,700, while non-asset transfer use cases, known as “XCM other,” witnessed a 214% QoQ increase, averaging 185 daily transfers. 

The total number of daily XCM messages grew 94% QoQ to 2,800, demonstrating the network’s dynamic ecosystem. In addition, the number of active XCM channels grew 13% QoQ to a total of 230.

Polkadot’s Parachain Network Soars To New Heights

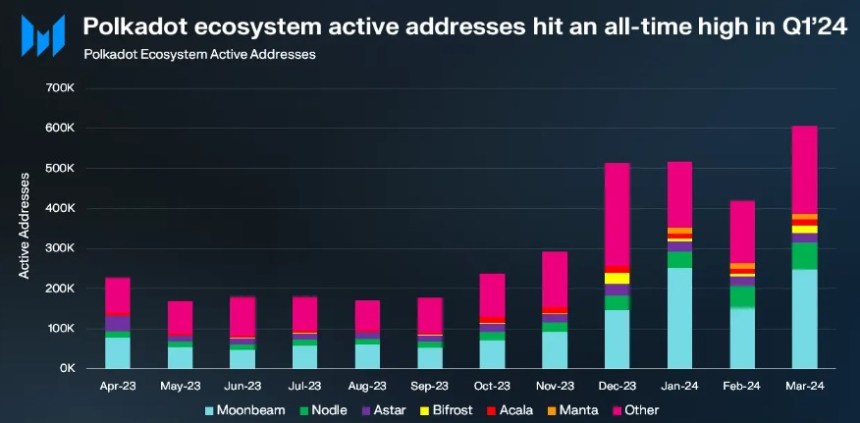
Q1 2024 marked a significant kick-off to the year for Polkadot’s parachains, with active addresses reaching an all-time high of 514,000, representing a substantial 48% QoQ growth. 

Moonbeam emerged as the leading parachain with 217,000 monthly active addresses, a solid 110% QoQ increase. Nodle followed closely with 54,000 monthly active addresses, doubling from the previous quarter. 

Polkadot

Astar on the other hand, experienced a modest 8% QoQ growth to reach 26,000 active addresses, while Bifrost Finance grew slightly by 2% QoQ to 10,000 addresses. However, Acala experienced a decline, with monthly active addresses falling to 13,000, down 16% QoQ.

Notably, the Manta Network stood out among parachains in Q1 2024, with a significant surge in daily active addresses, reaching 15,000. According to Messari, this increase was fueled by the successful launch of the MANTA token TGE and subsequent listing on Binance, propelling Manta’s Total Value Locked (TVL) to over $440 million. 

Polkadot Price Sees Upside Potential Ahead

In terms of price action, Polkadot’s native token DOT has regained bullish momentum following a sharp drop to the $5.8 price mark after reaching a yearly high of $11 on March 14. 

Currently, DOT has regained the $7.25 level, up 7% over the past week. However, DOT’s trading volume decreased slightly by 4.7% compared to the previous trading session, amounting to $320 million over the past 24 hours, according to CoinGecko data.

Polkadot

If the bullish momentum persists, Polkadot faces its first resistance at the $7.4 zone, which serves as the last threshold before a potential retest of the $8 resistance wall. 

On the other hand, the $6.4 support floor has proven to be successful after being tested for two consecutive days this week, highlighting its significance as a key level to watch for the token’s upward movement prospects.

Featured image from Shuttestock, chart from TradingView.com

DOT Price (Polkadot) Approaches Key Level: Should Traders Brace for Sharp Drop?

Polkadot (DOT) is showing bearish signs below the $8 resistance against the US Dollar. The price could extend its decline if it fails to stay above $6.00.

  • DOT is gaining pace below the $8.80 and $8.00 levels against the US Dollar.
  • The price is trading below the $7.20 zone and the 100 simple moving average (4 hours).
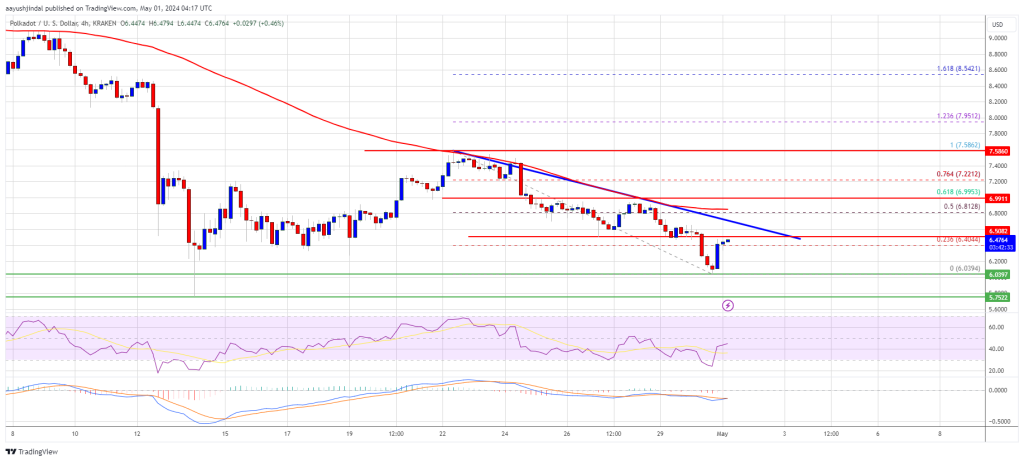
  • There is a key bearish trend line forming with resistance at $6.50 on the 4-hour chart of the DOT/USD pair (data source from Kraken).
  • The pair could continue to decline toward the $5.00 support zone.

Polkadot Price Resumes Drop

After a steady increase, DOT price faced resistance near the $7.60 zone. It formed a short-term top and started a fresh decline below the $7.00 level, like Ethereum and Bitcoin.

There was a move below the $6.20 support zone. A low was formed near $6.03 and the price is now consolidating losses. It is slowly moving higher above the $6.35 level and the 23.6% Fib retracement level of the downward move from the $7.58 swing high to the $6.03 low.

DOT is now trading below the $7.00 zone and the 100 simple moving average (4 hours). Immediate resistance is near the $6.50 level. There is also a key bearish trend line forming with resistance at $6.50 on the 4-hour chart of the DOT/USD pair.

DOT Price (Polkadot)

Source: DOTUSD on TradingView.com

The next major resistance is near $7.00 or the 61.8% Fib retracement level of the downward move from the $7.58 swing high to the $6.03 low. A successful break above $7.00 could start another strong rally. In the stated case, the price could easily rally toward $8.20 in the near term. The next major resistance is seen near the $10.00 zone.

More Downsides in DOT?

If DOT price fails to start a fresh increase above $7.00, it could continue to move down. The first key support is near the $6.00 level.

The next major support is near the $5.65 level, below which the price might decline to $5.00. Any more losses may perhaps open the doors for a move toward the $4.20 support zone or the trend line.

Technical Indicators

4-Hours MACD – The MACD for DOT/USD is now losing momentum in the bearish zone.

4-Hours RSI (Relative Strength Index) – The RSI for DOT/USD is now below the 50 level.

Major Support Levels – $6.00, $5.65 and $5.00.

Major Resistance Levels – $6.50, $7.00, and $8.50.

Polkadot Unveils Major Upgrade Plan: Relay Chain Replacement And 10M DOT Prize Incentive

Gavin Wood, the founder of the Polkadot protocol, has unveiled a new Gray Paper outlining the forthcoming Join-Accumulate Machine (JAM) upgrade for the network. This announcement occurred during Wood’s presentation on Polkadot’s future at the Token2049 crypto conference in Dubai. 

Wood introduced the JAM Implementer’s Prize, a 10 Million DOT prize pool, to encourage diverse development of the JAM protocol. 

Polkadot Unveils JAM Upgrade

According to the announcement, the JAM upgrade aims to replace the relay chain, which acts as the central data chain in the Polkadot network, with a “more modular and minimalist design” that will allow Polkadot to run generic services and increase network stability. 

The parachains service within JAM will support existing Substrate-based parachains, enabling developers to continue using Substrate to develop and deploy their blockchains. 

Notably, these services will have no predefined limits on code, data, or state capacity and can accommodate additional DOT deposits for increased capacity.

JAM’s design includes several technical improvements. It replaces WebAssembly with the Polkadot Virtual Machine based on the RISC-V ISA, an open-source instruction set architecture (ISA) used to develop custom processors.

It also introduces SAFROLE, a SNARK-based block production algorithm. These upgrades are reportedly designed to optimize performance and scalability within the Polkadot network.

On The Path To Decentralization?

To realize the vision of “a truly decentralized protocol,” Polkadot aims to support multiple client implementations. Furthermore, the JAM Implementer’s prize has been established to incentivize and fund projects contributing to the development of JAM implementations. The announcement further reads on the matter:

We believe that supporting a range of implementations in various programming languages will strengthen the ecosystem’s foundation. It distributes the power of protocol implementers more widely and reduces the risk of a bug in one implementation taking down the entire network.

The JAM Implementer’s Prize will collaborate with existing and future funding initiatives that support Polkadot’s ecosystem and technology stack. These initiatives include Decentralized Futures, Grants, and Polkadot’s on-chain treasury. 

The prize will be activated when JAM is ratified as a Polkadot technology through the network’s on-chain governance mechanism.

Overall, Gavin Wood’s introduction of the JAM upgrade and the associated 10 Million DOT prize reflects Polkadot’s intention to increase the protocol’s use and adoption. JAM’s modular design and incentives for multi-client implementations are also expected to contribute to ongoing efforts to decentralize the Polkadot network. 

As JAM development continues, the Polkadot ecosystem welcomes proposals from teams interested in implementing it in various programming environments.

Polkadot

Despite the recent announcement, the network’s native token, DOT, has been unable to break the downtrend witnessed over the past month. Currently trading at $6.75, it reflects a significant 24% decline in price over the last 30 days.

Featured image from Shutterstock, chart from TradingView.com 

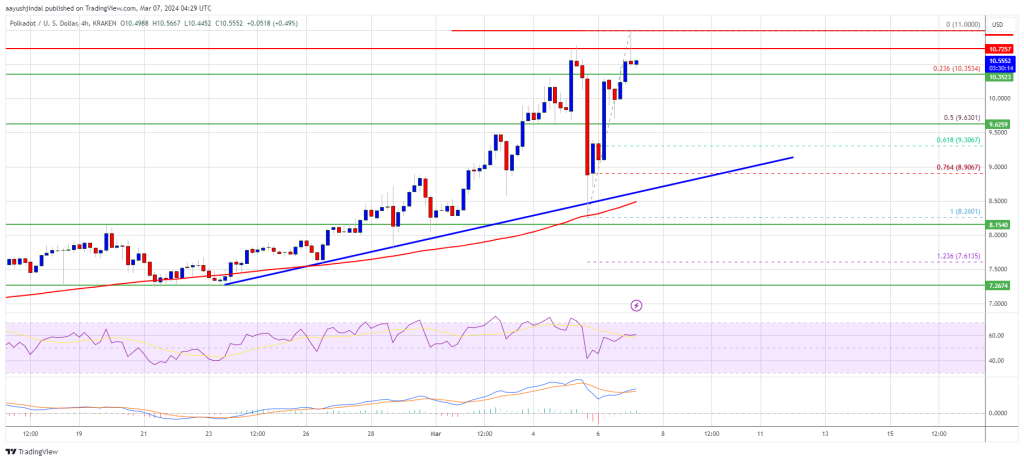
DOT Price (Polkadot) Jumps 10%, Why Bulls Can Pump It To $12

Polkadot (DOT) is gaining pace above the $10.00 resistance against the US Dollar. The price could extend its rally toward the $12.00 level in the near term.

  • DOT is gaining pace above the $9.80 and $10.00 levels against the US Dollar.
  • The price is trading above the $10.00 zone and the 100 simple moving average (4 hours).
  • There is a key bullish trend line forming with support at $9.10 on the 4-hour chart of the DOT/USD pair (data source from Kraken).
  • The pair could continue to rise toward the $12 resistance zone.

Polkadot Price Resumes Rally

After forming a base above the $8.00 level, DOT price started a fresh rally. It gained over 20% in a few days and even outperformed Ethereum and Bitcoin at times.

There was a clear move above the $9.50 and $10.00 resistance levels. The price traded to a new multi-month high at $11.00 and is currently consolidating gains. There was a minor pullback below the $10.75 level. The price is still above the 23.6% Fib retracement level of the upward move from the $8.26 swing low to the $11.00 high.

DOT is now trading well above the $10.00 zone and the 100 simple moving average (4 hours). There is also a key bullish trend line forming with support at $9.10 on the 4-hour chart of the DOT/USD pair. The trend line is close to the 61.8% Fib retracement level of the upward move from the $8.26 swing low to the $11.00 high.

DOT Price (Polkadot)

Source: DOTUSD on TradingView.com

Immediate resistance is near the $10.75 level. The next major resistance is near $11.00. A successful break above $11.00 could start another strong rally. In the stated case, the price could easily rally toward $12.00 in the near term. The next major resistance is seen near the $13.50 zone.

Are Dips Supported in DOT?

If DOT price fails to start a fresh increase above $11.00, it could start a downside correction. The first key support is near the $10.35 level.

The next major support is near the $10.00 level, below which the price might decline to $9.50. Any more losses may perhaps open the doors for a move toward the $9.20 support zone or the trend line.

Technical Indicators

4-Hours MACD – The MACD for DOT/USD is now gaining momentum in the bullish zone.

4-Hours RSI (Relative Strength Index) – The RSI for DOT/USD is now above the 50 level.

Major Support Levels – $10.35, $10.00 and $9.50.

Major Resistance Levels – $10.75, $11.00, and $12.00.

DOT Price (Polkadot) Looks Set To Crush $10 And Rally Further

Polkadot (DOT) is gaining pace above the $8.80 resistance against the US Dollar. The price could extend its rally once it settles above the $10 barrier.

  • DOT is gaining pace above the $8.50 and $8.80 levels against the US Dollar.
  • The price is trading above the $9.00 zone and the 100 simple moving average (4 hours).
  • There is a key bullish trend line forming with support at $9.20 on the 4-hour chart of the DOT/USD pair (data source from Kraken).
  • The pair could continue to rise unless the bears are able to defend the $10 resistance zone.

Polkadot Price Restarts Rally

After forming a base above the $7.50 level, DOT price started a steady increase. It gained over 25% in a few days and even outperformed Ethereum and Bitcoin at times.

There was a clear move above the $8.50 and $8.80 resistance levels. The price even traded close to the $10.00 level. A new multi-week high is formed near $9.89 and the price is now consolidating gains. It is holding gains above the 23.6% Fib retracement level of the upward move from the $8.57 swing low to the $9.89 high.

DOT is now trading above the $9.00 zone and the 100 simple moving average (4 hours). There is also a key bullish trend line forming with support at $9.20 on the 4-hour chart of the DOT/USD pair. The trend line is close to the 50% Fib retracement level of the upward move from the $8.57 swing low to the $9.89 high.

DOT Price (Polkadot)

Source: DOTUSD on TradingView.com

Immediate resistance is near the $9.85 level. The next major resistance is near $10.00. A successful break above $10.00 could start another strong rally. In the stated case, the price could easily rally toward $12.00 in the near term. The next major resistance is seen near the $13.50 zone.

Are Dips Supported in DOT?

If DOT price fails to start a fresh increase above $10.00, it could start a downside correction. The first key support is near the $9.50 level.

The next major support is near the $9.20 level, below which the price might decline to $8.80. Any more losses may perhaps open the doors for a move toward the $8.50 support zone.

Technical Indicators

4-Hours MACD – The MACD for DOT/USD is now gaining momentum in the bullish zone.

4-Hours RSI (Relative Strength Index) – The RSI for DOT/USD is now above the 50 level.

Major Support Levels – $9.50, $9.20 and $8.50.

Major Resistance Levels – $9.85, $10.00, and $12.00.

Polkadot (DOT) Circulating Market Cap Rockets To $8.3 Billion, Registers Massive 111% Growth

Polkadot, the computing platform known for its interoperability and scalability, has shown remarkable growth in key metrics during the latter part of 2023, as outlined in a recent report by Messari. 

Outpacing Crypto Market Growth

According to Messari’s findings, Polkadot’s circulating market cap experienced a remarkable 111% quarter-on-quarter (QoQ) growth, reaching an impressive $8.38 billion. 

This growth outpaced the overall crypto market’s growth of 54% during the same period. Furthermore, Polkadot’s year-on-year (YoY) change reached 94%, solidifying its position among the top 15 crypto projects by market capitalization.

Polkadot

In terms of revenue, Polkadot witnessed a substantial surge of 2,880% QoQ, generating $2.8 million in Q4 2023. This surge was primarily attributed to the significant rise in extrinsic, driven by the introduction of Polkadot Inscriptions

Messari suggests that even excluding the four-day spike from the Inscriptions, Polkadot’s revenue would have doubled from the previous quarter. It is worth noting that Polkadot’s revenue tends to be relatively lower compared to its competitors due to the structural design of its network.

Polkadot Witnesses Significant Increase In Active Addresses

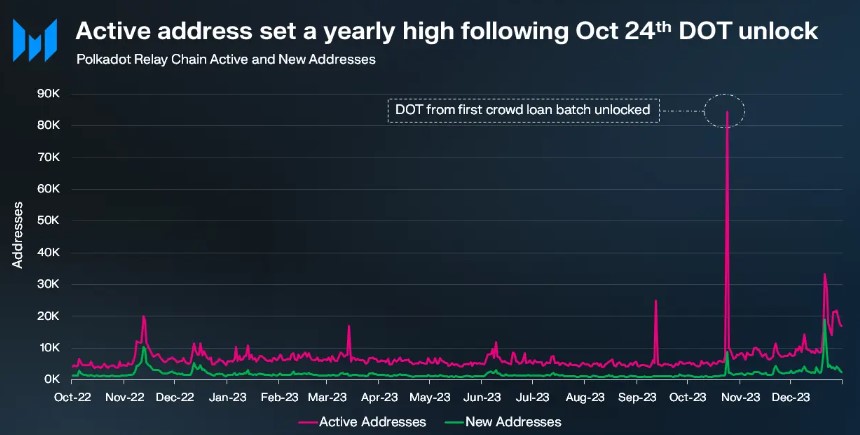
Following the launch of OpenGov – the governance module and framework within the network – in June, the Polkadot Relay Chain experienced a surge in account activity, largely due to increased governance participation. 

Because the Relay Chain is critical in facilitating governance processes, it experienced a spike in active addresses on October 24, when users claimed their locked DOT tokens from the first batch of parachain auctions held two years earlier.

Polkadot

Throughout Q4, the Polkadot Relay Chain averaged over 10,000 daily active addresses, representing a substantial 90% QoQ increase. Excluding the October 24th activity related to DOT token claiming, the average number of active addresses still saw a significant 70% rise in QoQ, reaching 9,000. 

Additionally, Cross-Chain Message (XCM) transfers on the platform increased by 150% QoQ, reaching an all-time high of 133,000. The total number of active XCM channels nearly tripled in 2023, reaching 203 by the end of the year.

According to Electric Capital’s rankings, Polkadot has 800 full-time and 2,100 total developers, making it one of the largest crypto ecosystems in developer participation.

DOT Price Shows Mixed Performance

Despite notable growth in key metrics demonstrating the network’s expansion, the price of Polkadot’s native token, DOT, has not followed suit and has even experienced declines over longer time frames despite positive developments.

Currently, DOT is trading at $6.7420, representing a slight 0.3% price increase in the past twenty-four hours, coupled with a 9% year-to-date gain.

However, over the past fourteen and thirty days, the token has recorded a 6% and 22% price drop, highlighting the absence of bullish momentum and catalysts that could propel DOT to higher levels.

Polkadot

Although it reached a 19-month high of $9.5711 on December 26, the subsequent price drop has led DOT to a critical juncture, potentially erasing its gains over the past year.

If the current level and its nearest support at $6.3229 fail to halt further price declines, DOT could potentially drop to the $5.4830 level, which serves as the next major support in the token’s 1-day chart.

Conversely, if DOT surpasses its upper resistance at $7.0392, the next objective would be to break the short-term downtrend structure, facing the $7.5332 resistance and another resistance at $8.1631. This would pave the way for another consolidation phase at its 19-month high.

Featured image from Shutterstock, chart from TradingView.com 

DOT Price (Polkadot) Uptrend To Continue? These Could Be The Factors To Watch

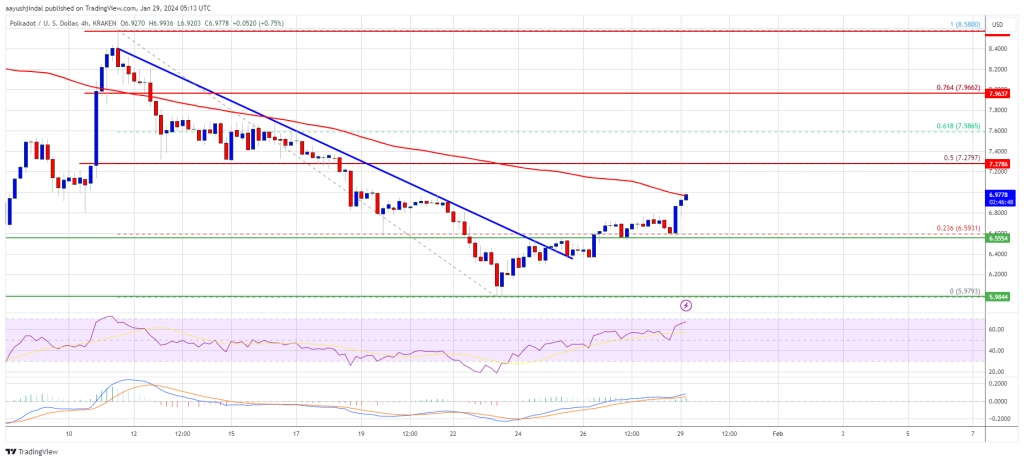
Polkadot (DOT) is gaining pace above the $6.80 resistance against the US Dollar. The price could gain bullish momentum if it clears the $7.28 resistance.

  • DOT is trading in a positive zone from the $6.00 support against the US Dollar.
  • The price is trading near the $7.00 zone and the 100 simple moving average (4 hours).
  • There was a break above a key bearish trend line with resistance near $6.50 on the 4-hour chart of the DOT/USD pair (data source from Kraken).
  • The pair could continue to rise unless the bears are able to defend the $7.28 resistance zone.

Polkadot Price Restarts Increase

After a steady decline, DOT price found support near the $6.00 zone. A low was formed at $5.97 and Polkadot recently started a fresh increase. The price was able to clear the $6.20 and $6.50 resistance levels to move into a positive zone, like Bitcoin and Ethereum.

There was a break above a key bearish trend line with resistance near $6.50 on the 4-hour chart of the DOT/USD pair. The pair even surpassed the 23.6% Fib retracement level of the downward move from the $8.58 swing high to the $5.97 low.

DOT is now trading near the $7.00 zone and the 100 simple moving average (4 hours). Immediate resistance is near the $7.20 level. The next major resistance is near $7.28 or the 50% Fib retracement level of the downward move from the $8.58 swing high to the $5.97 low.

DOT Price (Polkadot)

Source: DOTUSD on TradingView.com

A successful break above $7.28 could start another strong rally. In the stated case, the price could easily rally toward $8.00 in the near term. The next major resistance is seen near the $8.50 zone.

Are Dips Supported in DOT?

If DOT price fails to start a fresh increase above $7.28, it could start a fresh decline. The first key support is near the $6.60 level.

The next major support is near the $6.00 level, below which the price might decline to $5.65. Any more losses may perhaps open the doors for a move toward the $5.32 support zone.

Technical Indicators

4-Hours MACD – The MACD for DOT/USD is now gaining momentum in the bullish zone.

4-Hours RSI (Relative Strength Index) – The RSI for DOT/USD is now above the 50 level.

Major Support Levels – $6.60, $6.00 and $5.65.

Major Resistance Levels – $7.28, $8.00, and $8.50.

DOT Price (Polkadot) Pumps 15% As Bulls Aim For Surge To $10

Polkadot (DOT) is gaining pace above the $7.50 resistance against the US Dollar. The price is up nearly 15% and might rise further toward $10.00.

  • DOT is showing heavy bullish signs from the $6.65 support against the US Dollar.
  • The price is trading above the $8.00 zone and the 100 simple moving average (4 hours).
  • There was a break above a key bearish trend line with resistance near $7.80 on the 4-hour chart of the DOT/USD pair (data source from Kraken).
  • The pair could continue to rally unless the bears are able to defend the $8.88 resistance zone.

Polkadot Price Restarts Rally

After a steady decline, DOT price found support near the $6.65 zone. A low was formed at $6.64 and Polkadot recently started a fresh increase. The price was able to clear the $6.85 and $7.00 resistance levels to move into a positive zone, like Bitcoin and Ethereum.

There was a break above a key bearish trend line with resistance near $7.80 on the 4-hour chart of the DOT/USD pair. The pair even surpassed the 50% Fib retracement level of the downward move from the $9.58 swing high to the $6.64 low.

DOT is now trading above the $8.00 zone and the 100 simple moving average (4 hours). Immediate resistance is near the $8.45 level. The next major resistance is near $8.88 or the 76.4% Fib retracement level of the downward move from the $9.58 swing high to the $6.64 low.

DOT Price (Polkadot)

Source: DOTUSD on TradingView.com

A successful break above $8.88 could start another strong rally. In the stated case, the price could easily rally toward $9.50 in the near term. The next major resistance is seen near the $10.00 zone.

Are Dips Supported in DOT?

If DOT price fails to start a fresh increase above $8.45, it could start a fresh decline. The first key support is near the $7.80 level and the same trend line.

The next major support is near the $7.50 level, below which the price might decline to $7.00. Any more losses may perhaps open the doors for a move toward the $6.65 support zone.

Technical Indicators

4-Hours MACD – The MACD for DOT/USD is now gaining momentum in the bullish zone.

4-Hours RSI (Relative Strength Index) – The RSI for DOT/USD is now above the 50 level.

Major Support Levels – $7.80, $7.500 and $7.00.

Major Resistance Levels – $8.45, $8.88, and $9.50.

Will Inscriptions On Polkadot Push DOT Prices Back Above $10?

There has been a notable spike in the number of Polkadot transactions in recent days. The surge also coincides with DOT prices racing to new 2023 highs when writing on December 22.

Taking to X, asynchronous rob noted that Polkadot is currently processing around 250,000 transactions per hour or 400-450 per block. Polkadot is a modern blockchain that aims to drive blockchain interoperability.

Based on its design, relying on a Relay Chain and numerous Parachains, the network can process transactions cheaply, considering its high capacity.

Polkadot Transactions Swelling: Blame Dota and Inscriptions

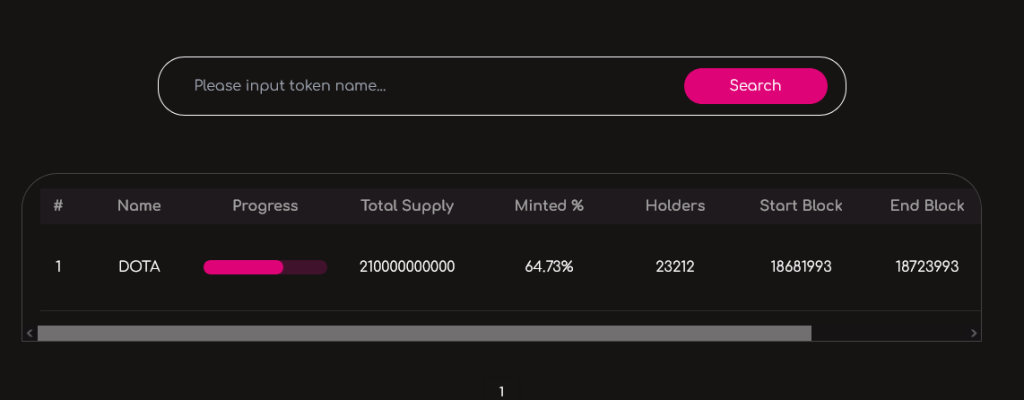
The rapid expansion of transactions on Polkadot can be attributed to the recent launch of inscriptions, a new type of cross-chain asset developed by the Dota platform. Uniquely, Dota’s inscriptions aim to simplify the process of deploying and minting assets on Polkadot’s parachains. 

Though parachains operate independently as “chains” that rely on the Relay Chain for security, this design will eliminate the need for Cross-Chain Message Forma (XCM), which is needed for Polkadot parachains to communicate. 

Usually, the XCM requires complex coding and can be time-consuming. Therefore, the simplicity of DOT-20 inscriptions by Dota directly explains why there is a surge in the number of transactions.

According to Dota on X, inscriptions on Polkadot account for 98% of the recent transaction volume.

Inscriptions on Polkadot | Source: Dota

Though there has been a change in the number of transactions processed, transaction fees on Polkadot remain low. At the same time, the network hasn’t “skipped a bit,” with capacity being around 10%. 

By how Polkadot is designed, network fees will increase only once 25% of the total network capacity is changed. To reach this level, each block being confirmed on Polkadot must pack at least 1,250 transactions. 

This will require even more inscriptions to be created via Dota, meaning despite the observed spike, Polkadot is technically underutilized from a bandwidth perspective.

Will DOT Continue Rising In 2024?

While the deluge of transactions also coincides with rising DOT prices, currently at 2023 highs, there have been concerns about inscriptions causing network congestion in a network like Bitcoin facing scaling challenges.

Critics maintain that inscriptions, though defended by some, serve nothing more than spamming the network and discouraging use due to accompanying increases in transaction fees. 

Polkadot price trending upward on the daily chart | Source: DOTUSDT on Binance, TradingView

For now, it remains to be seen if inscriptions will be sustainable, helping onboard more users. So far, Polkadot, as mentioned, can handle the uptick in transactions.

Even so, if there is a 3X rise in transactions exceeding the 1,250 transactions per block threshold, the demand for DOT will rise. Subsequently, DOT will likely trend higher towards $10 and other critical resistance levels.

DOT Price (Polkadot) Holds Strong At $6.6, Signs Point To Fresh Rally Ahead

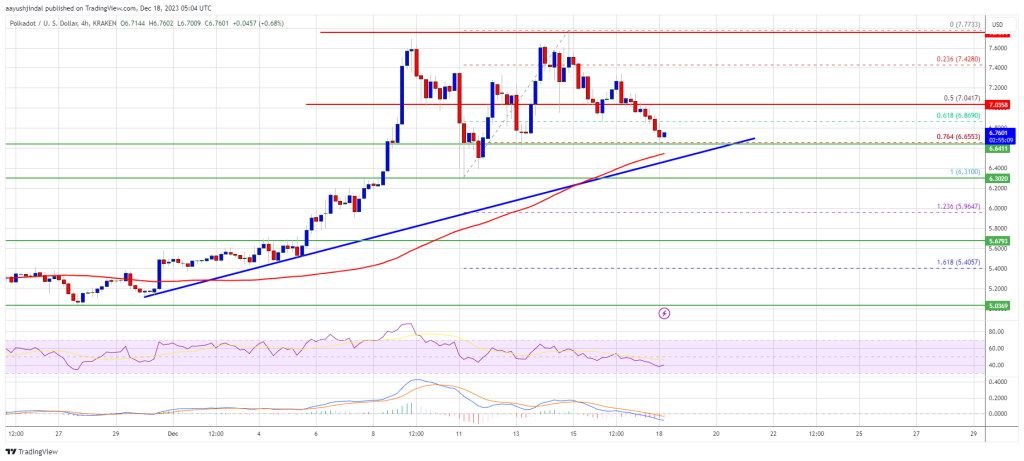
Polkadot (DOT) is correcting gains from the $7.75 against the US Dollar. The price could start a fresh increase unless there is a close below $6.30.

  • DOT is consolidating gains above the $6.60 support zone against the US Dollar.
  • The price is trading above the $6.65 zone and the 100 simple moving average (4 hours).
  • There is a key bullish trend line forming with support near $6.65 on the 4-hour chart of the DOT/USD pair (data source from Kraken).
  • The pair could start a fresh increase if the bulls protect the $6.65 and $6.30 support levels.

Polkadot Price Holds Ground

After forming a base above the $5.50 support, DOT price started a decent increase. The price was able to clear the $5.85 and $6.00 resistance levels to move into a positive zone, like Bitcoin and Ethereum.

Polkadot even surpassed the $6.65 resistance zone and settled above the 100 simple moving average (4 hours). Finally, the bears appeared near the $7.75 zone. A high was formed near $7.77 and the price is now correcting gains. There was a drop below the $7.20 and $7.00 levels.

DOT declined below the 61.8% Fib retracement level of the upward move from the $6.31 swing low to the $7.77 high. However, it is still above the $6.65 zone and the 100 simple moving average (4 hours).

There is also a key bullish trend line forming with support near $6.65 on the 4-hour chart of the DOT/USD pair. The trend line is close to the 76.4% Fib retracement level of the upward move from the $6.31 swing low to the $7.77 high.

DOT Price (Polkadot)

Source: DOTUSD on TradingView.com

Immediate resistance is near the $7.05 level. The next major resistance is near $7.20. A successful break above $7.20 could start another strong rally. In the stated case, the price could easily rally toward $7.75 in the near term. The next major resistance is seen near the $8.00 zone.

More Losses in DOT?

If DOT price fails to start a fresh increase above $7.05, it could continue to move down. The first key support is near the $6.65 level and the trend line.

The next major support is near the $6.30 level, below which the price might decline to $5.70. Any more losses may perhaps open the doors for a move toward the $5.00 support zone.

Technical Indicators

4-Hours MACD – The MACD for DOT/USD is now gaining momentum in the bearish zone.

4-Hours RSI (Relative Strength Index) – The RSI for DOT/USD is now below the 50 level.

Major Support Levels – $6.65, $6.30 and $5.70.

Major Resistance Levels – $7.05, $7.20, and $7.75.

DOT Price (Polkadot) Spikes 5% and Primed To Surge Toward $6

Polkadot (DOT) is gaining pace above the $5.25 resistance against the US Dollar. The price could surge further toward the $5.85 and $6.00 levels.

  • DOT is gaining pace above the $5.25 resistance zone against the US Dollar.
  • The price is trading above the $5.30 zone and the 100 simple moving average (4 hours).
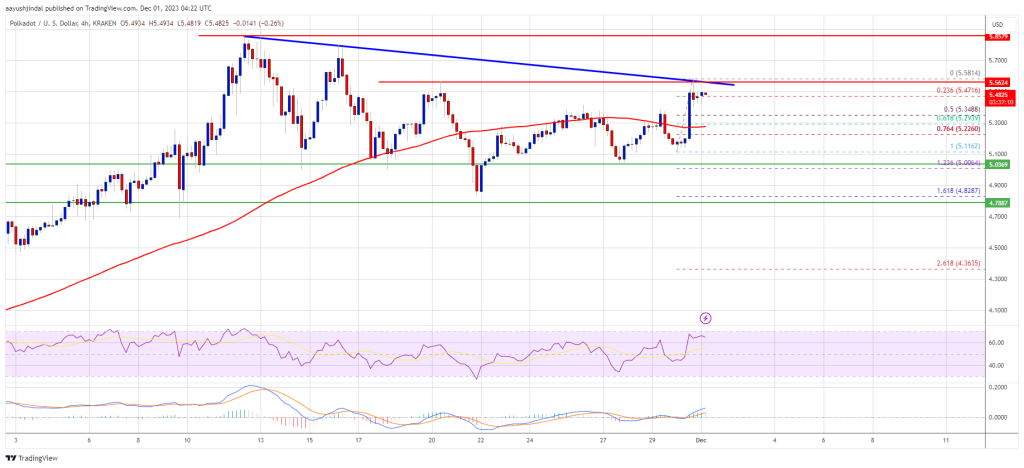
  • There is a key bearish trend line forming with resistance near $5.55 on the 4-hour chart of the DOT/USD pair (data source from Kraken).
  • The pair could gain bullish momentum if there is a close above $5.55 and $5.60.

Polkadot Price Regains Strength

After consolidating above the $5.00 support, DOT price started a decent increase. The price was able to clear the $5.20 and $5.25 resistance levels to move into a positive zone, like Bitcoin and Ethereum.

Polkadot cleared the 100 simple moving average (4 hours) and tested the $5.60 resistance. A high is formed near $5.58 and the price is now consolidating gains. It is up nearly 5% and shows signs of more gains in the coming sessions.

DOT price is now trading above the $5.30 zone and the 100 simple moving average (4 hours). Immediate resistance is near the $5.55 level. There is also a key bearish trend line forming with resistance near $5.55 on the 4-hour chart of the DOT/USD pair.

DOT Price (Polkadot)

Source: DOTUSD on TradingView.com

The next major resistance is near $5.60. A successful break above $5.60 could start another strong rally. In the stated case, the price could easily rally toward $5.85 in the near term. The next major resistance is seen near the $6.00 zone.

Are Dips Supported in DOT?

If DOT price fails to continue higher above $5.55 or $5.60, it could start a downside correction. The first key support is near the $5.35 level.

The next major support is near the $5.30 level or the 61.8% Fib retracement level of the upward move from the $5.11 swing low to the $5.58 high, below which the price might decline to $5.10. Any more losses may perhaps open the doors for a move toward the $5.00 support zone.

Technical Indicators

4-Hours MACD – The MACD for DOT/USD is now gaining momentum in the bullish zone.

4-Hours RSI (Relative Strength Index) – The RSI for DOT/USD is now above the 50 level.

Major Support Levels – $5.30, $5.10 and $5.00.

Major Resistance Levels – $5.55, $5.60, and $6.00.

Analyst Thinks DOT Will Reclaim Former Glory With Polkadot 2.0

DOT, the native currency of Polkadot, a smart contract platform, remains under pressure, posting sharp losses after soaring to an all-time high of around $55 in 2021. The coin is trading at about $6, volatile but up roughly 45% from 2022 lows, buoyed by the broader recovery across the crypto scene.

Will DOT Break Above Immediate Resistance Levels?

Despite DOT’s woes, one crypto trader, @Ashcryptoreal, is bullish on the coin’s prospects, pointing to the eventual implementation of Polkadot 2.0, a critical update for the cross-chain network. Taking to X on November 27, the crypto trader believes that Polkadot 2.0 will fix present issues plaguing the smart contract platform. 

Specifically, Polkadot 2.0 represents an overhaul set to introduce several enhancements that could, if executed as stated, propel DOT above current resistance levels. With rising DOT demand, the coin, and by extension, the platform, could soar, rising to its former glory as one of the leading blockchains with dense user activity. 

Looking at price action, DOT is moving within a broad horizontal range with caps at around $3.5 and $7.5. Despite the recent spike, which saw the coin roar by 45%, prices are moving inside the bull bar of early November. 

Polkadot price trending upward on the weekly chart | Source: DOTUSDT on Binance, TradingView

Based on this, there must be a sharp expansion from spot levels above $5.6 with rising trading volumes for buyers to be in charge. Even so, the current formation still favors buyers.

What’s The Big Deal About Polkadot 2.0

Polkadot 2.0 overhauls certain features as it is currently in the network. However, most importantly, analysts observe that proposed changes could enhance the network’s capabilities and attract more developers. 

After the update, Polkadot will migrate from the dynamic block space allocation system, allowing developers to purchase block space as needed, either in bulk or individually. This flexibility could make the network more appealing to various projects.

Additionally, Polkadot 2.0 will introduce elastic cores, enabling the network to adapt to varying computing demands depending on use. This adaptability may make the network more efficient. Moreover, it adapts to the diverse needs of developers.

The concept of coretime, which measures computing resource demands, will be a notable addition to Polkadot 2.0. Like in EOS, resources in “core time” will be purchased through auctions or pay-as-you-go basis, allowing developers more control.

Analysts expect these changes to increase the demand for DOT since the coin serves as a medium of exchange. All on-chain transactions are settled in DOT. 

Polkadot (DOT) Market Cap Dips: Q3 Sees 16% Decrease In Value

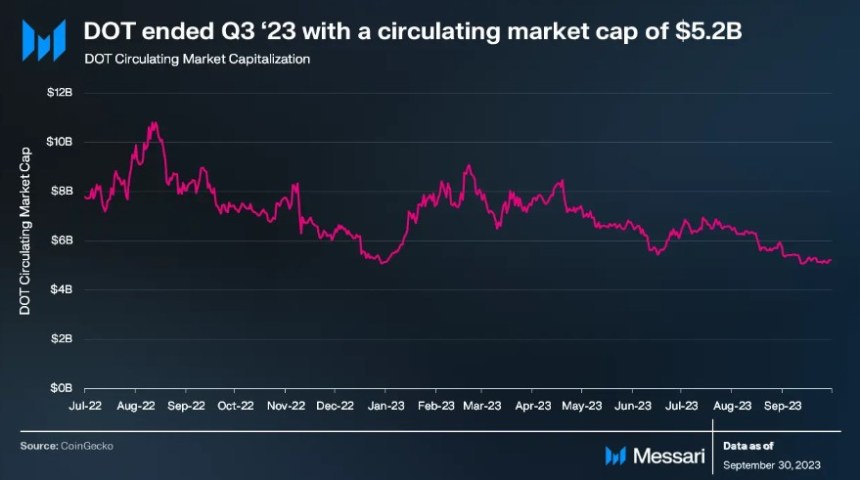
Polkadot (DOT), one of the prominent blockchain networks in the crypto space, experienced a 16% decline in market capitalization in the third quarter (Q3) of 2023, according to a recent report from Messari. 

This decline came after a moderate downturn in the overall cryptocurrency market during Q3, despite favorable court rulings for XRP and Grayscale. The total crypto market capitalization declined by 5.8%, with Bitcoin (BTC) and Ethereum (ETH) falling by 7.5% and 10.0%, respectively.

Polkadot Closes Q3 With $5.2 Billion Market Cap

As reported by Messari, Polkadot’s market capitalization closed at $5.2 billion, positioning it as the 13th largest crypto asset by market cap in Q3 2023 (currently 15th). 

Polkadot

Polkadot’s financial structure is based on a weight-based fee model, which differs from the gas-metering model in other networks, such as Ethereum.

Transaction fees in Polkadot are determined and charged before execution, with the calculation comprising a weight fee reflecting computational resources, a length fee based on transaction size, and an optional tip to incentivize block authors. 

In Q3 2023, Polkadot generated revenue amounting to $94,000, representing a 3% decrease compared to the previous quarter. Messari suggests that Polkadot’s revenue tends to be relatively lower compared to its competitors due to the network’s structural design.

On the other hand, the native token of Polkadot, DOT, serves three primary purposes: governance, staking, and parachain bonding. During Q3 2023, the staking percentage of DOT rose by 12% compared to the previous quarter, reaching 49%. 

This increase led to reduced staking rewards and a 12% decline in the annualized nominal yield to 15%. According to Messari, the close alignment of Polkadot’s staking rate with the ideal rate demonstrates the effectiveness of its mechanism.

Polkadot’s OpenGov Milestone

The Polkadot treasury supported various initiatives in Q3, including software development, bounties, client upgrades, and community events like meetups and hackerspaces. 

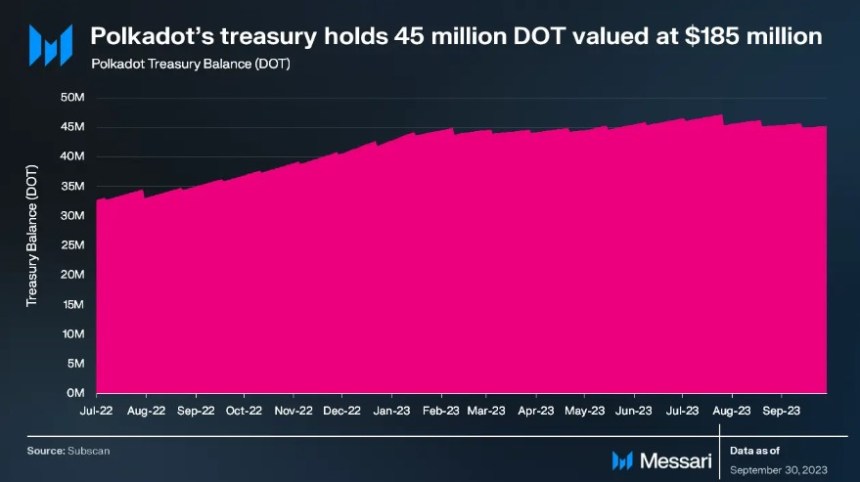
According to Messari, the implementation of OpenGov on June 15 marked a significant milestone, revolutionizing treasury management and enabling concurrent proposals with distinct requirements. At the end of the quarter, the Polkadot treasury held approximately 45 million DOT ($185 million).

Polkadot

Furthermore, Polkadot has recently completed the official release of Polkadot 1.0, marking the achievement of a significant milestone outlined in the Polkadot whitepaper. 

The network’s codebase has been fully transitioned to a repository managed by the community through Polkadot OpenGov and the Technical Fellowship. The roadmap for the next iteration, Polkadot 2.0, will be determined through community discussions and consensus. 

Founder Gavin Wood has proposed ideas for additional mechanisms to allocate Polkadot’s block space and for creating treaty-like agreements between multiple blockchains called “accords.”

Polkadot

As of this writing, the DOT token has exhibited a noteworthy upward trend since October 19, closely following Bitcoin’s lead. Presently, the token is trading at $4,839, reflecting a notable increase of over 16% within the past fourteen days.

Featured image from Shutterstock, chart from TradingView.com 

DOT Price (Polkadot) Surge to $5.5 – Are Bulls Ready For This?

Polkadot (DOT) is gaining pace above the $4.50 resistance against the US Dollar. The price could surge toward $5.5 if it clears the $4.80 resistance.

  • DOT is slowly moving higher above the $4.50 resistance zone against the US Dollar.
  • The price is trading above the $4.60 zone and the 100 simple moving average (4 hours).
  • There is a key bullish trend line forming with support near $4.50 on the 4-hour chart of the DOT/USD pair (data source from Kraken).
  • The pair could gain bullish momentum if there is a close above $4.80 and $4.85.

Polkadot Price Regains Strength

After forming a base above the $4.00 handle, DOT price started a decent increase. The price was able to clear the key barrier at $4.20 to enter a positive zone, like Bitcoin and Ethereum.

Polkadot cleared the $4.50 resistance zone and the 100 simple moving average (4 hours). It traded to a new multi-week high at $4.803 and is now consolidating gains. It is well above the 23.6% Fib retracement level of the upward move from the $4.046 swing low to the $4.803 high.

DOT price is now trading above the $4.60 zone and the 100 simple moving average (4 hours). There is also a key bullish trend line forming with support near $4.50 on the 4-hour chart of the DOT/USD pair. The trend line is close to the 50% Fib retracement level of the upward move from the $4.046 swing low to the $4.803 high.

DOT Price (Polkadot)

Source: DOTUSD on TradingView.com

Immediate resistance is near the $4.80 level. The next major resistance is near $4.85. A successful break above $4.85 could start another strong rally. In the stated case, the price could easily rally toward $5.20 in the coming days. The next major resistance is seen near the $5.50 zone.

Are Dips Supported in DOT?

If DOT price fails to continue higher above $4.80 or $4.85, it could start a downside correction. The first key support is near the $4.62 level.

The next major support is near the $4.50 level and the trend line, below which the price might decline to $4.35. Any more losses may perhaps open the doors for a move toward the $4.20 support zone.

Technical Indicators

4-Hours MACD – The MACD for DOT/USD is now gaining momentum in the bullish zone.

4-Hours RSI (Relative Strength Index) – The RSI for DOT/USD is now above the 50 level.

Major Support Levels – $4.62, $4.50 and $4.20.

Major Resistance Levels – $4.80, $4.85, and $5.50.

DOT Price (Polkadot) Hints At Potential Recovery, Here’s What Could Propel It To $4.8

Polkadot’s DOT is recovering higher from the $3.92 support against the US Dollar. The price could gain pace if it clears the $4.20 and $4.35 resistance levels.

  • DOT is slowly moving higher above the $4.05 resistance zone against the US Dollar.
  • The price is trading just above the $4.15 zone and the 100 simple moving average (4 hours).
  • There is a key bearish trend line forming with resistance near $4.175 on the 4-hour chart of the DOT/USD pair (data source from Kraken).
  • The pair could gain bullish momentum if there is a close above $4.20 and $4.35.

Polkadot’s DOT Price Faces Uphill Task

After a sharp decline, DOT price found support near the $3.90 zone. A low is formed near $3.91 and the price is now attempting a fresh increase, like Bitcoin and Ethereum.

There was a break above the $4.00 and $4.05 resistance levels. The price surpassed the 23.6% Fib retracement level of the downward move from the $4.80 swing high to the $3.91 low. DOT is now trading just above the $4.15 zone and the 100 simple moving average (4 hours).

Immediate resistance is near the $4.20 level. There is also a key bearish trend line forming with resistance near $4.175 on the 4-hour chart of the DOT/USD pair.

DOT Price (Polkadot)

Source: DOTUSD on TradingView.com

The next major resistance is near $4.35. It is near the 50% Fib retracement level of the downward move from the $4.80 swing high to the $3.91 low. A successful break above $4.35 could start a strong rally. In the stated case, the price could easily rally toward $4.80 in the coming days. The next major resistance is seen near the $5.0 zone.

Another Decline?

If DOT price fails to continue higher above $4.20 or $4.35, it could start another decline. The first key support is near the $4.05 level.

The next major support is near the $3.90 level and the last low, below which the price might decline to $3.75. Any more losses may perhaps open the doors for a move toward the $3.50 support zone.

Technical Indicators

4-Hours MACD – The MACD for DOT/USD is now gaining momentum in the bullish zone.

4-Hours RSI (Relative Strength Index) – The RSI for DOT/USD is now above the 50 level.

Major Support Levels – $4.05, $3.90 and $3.75.

Major Resistance Levels – $4.20, $4.35, and $4.80.