XRP Price’s 7,000% Pump: Analyst Foresees Massive Move If This Happens

XRP may not have had the best start to 2024, but several cryptocurrency analysts and enthusiasts are still bullish about the crypto asset, predicting a possible price surge to new highs heights.

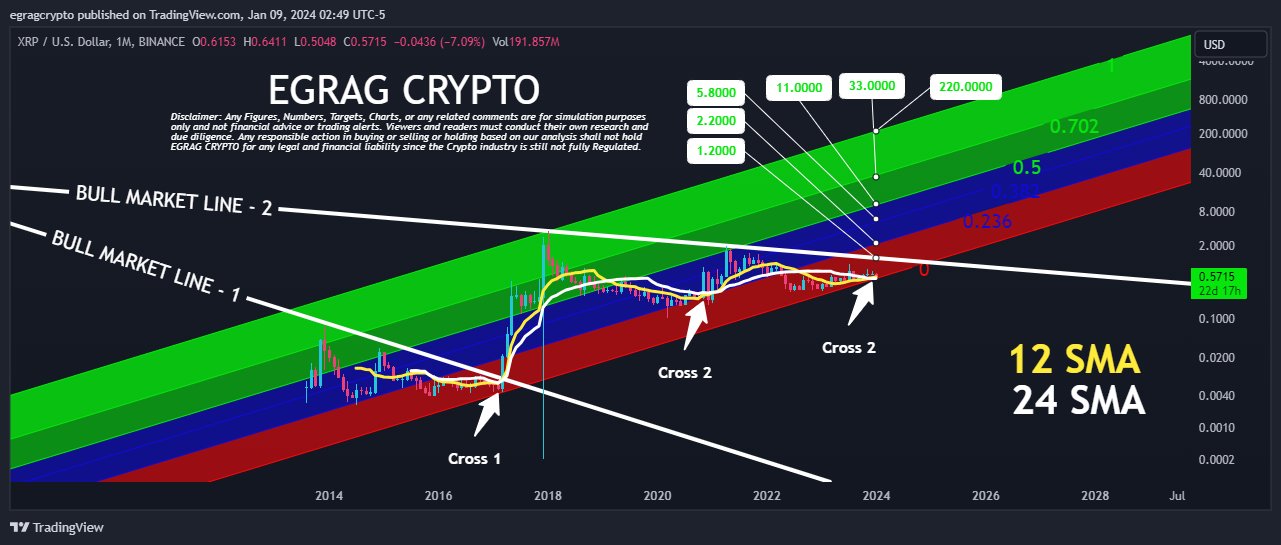
Popular cryptocurrency analyst Egrag Crypto has made a daring prediction for XRP, suggesting a rise to a new peak. Egrag Crypto’s forecast delves into the token’s potential to reach the $2 price mark and way beyond.

XRP Poised To Skyrocket To A New All-Time High

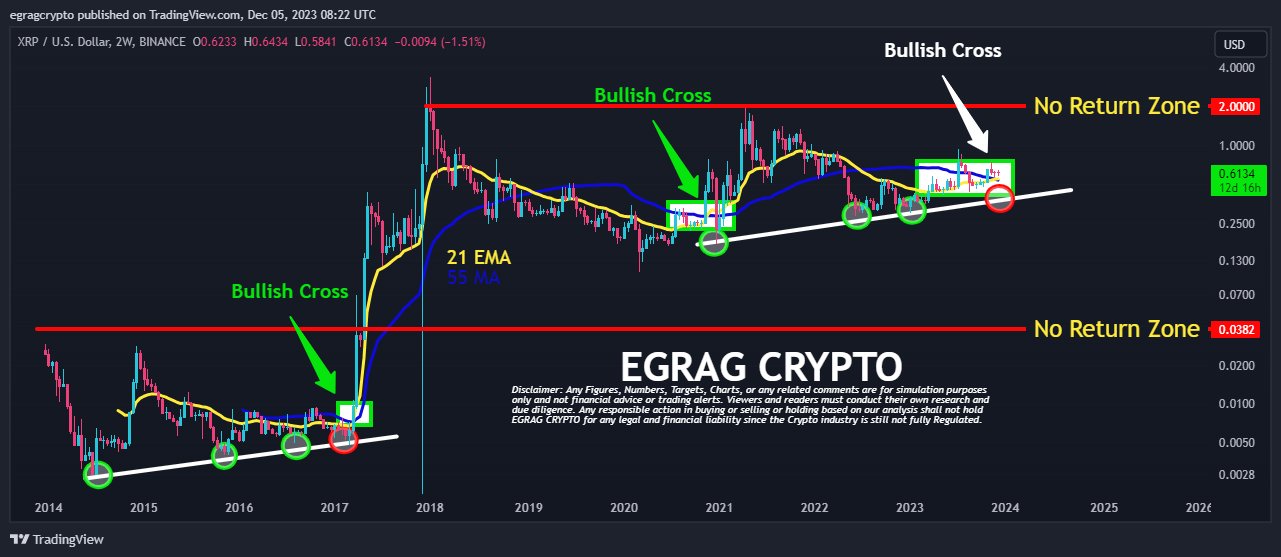
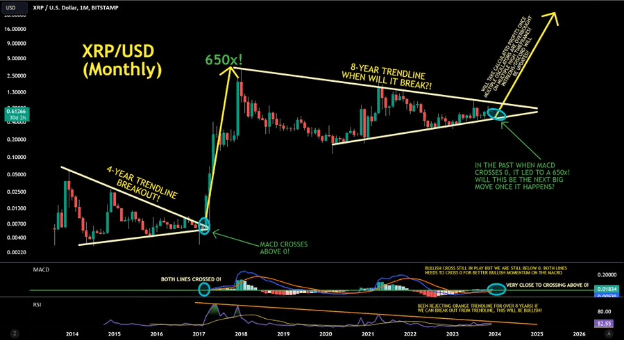
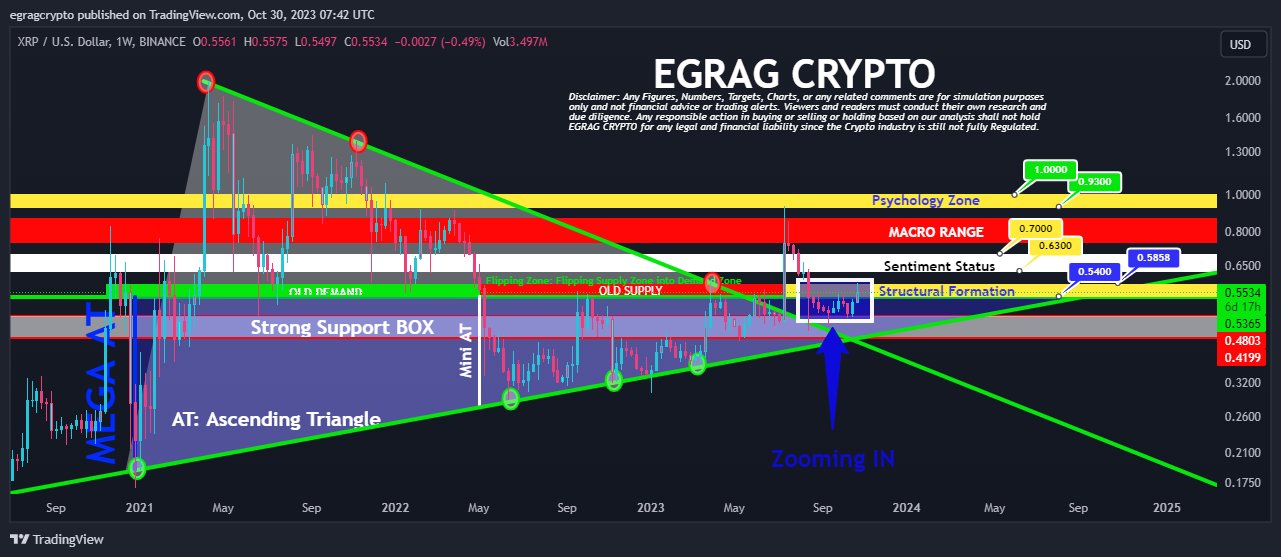
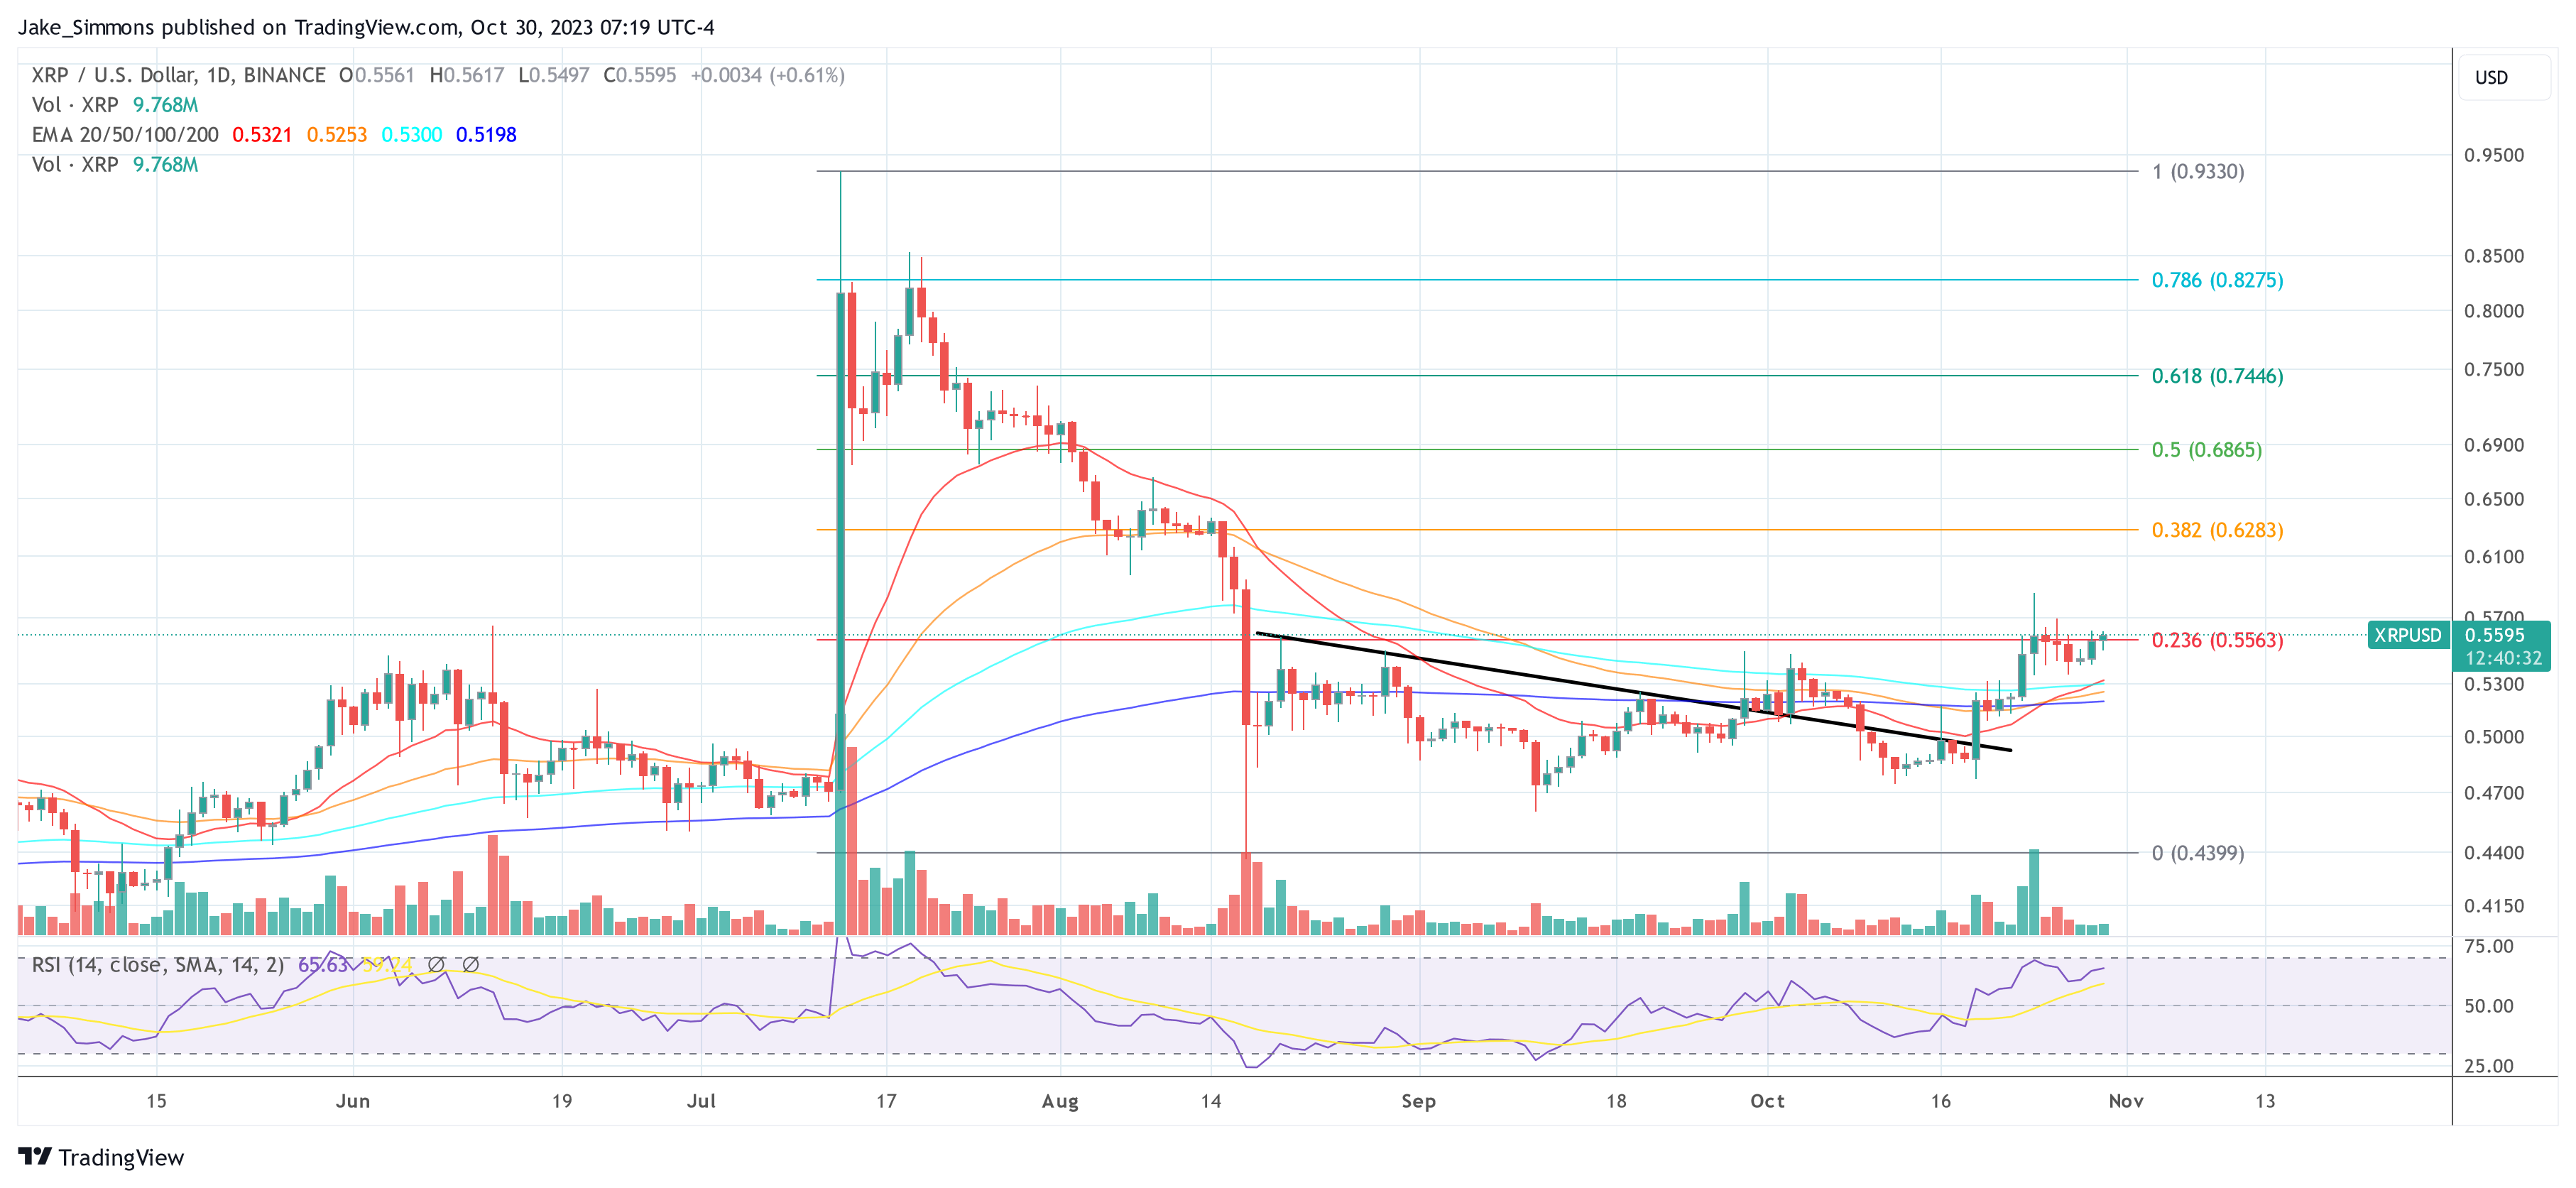
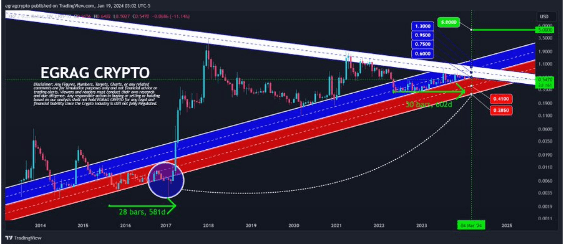
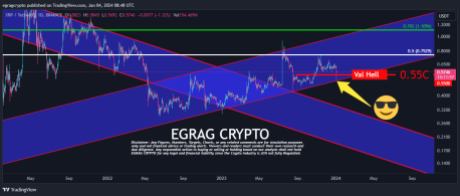
In his projections shared on the X platform, the analyst noted that XRP is presently caught between the two moving average indicators, the 21-exponential Moving Average (EMA) and the 55-moving Average (MA).

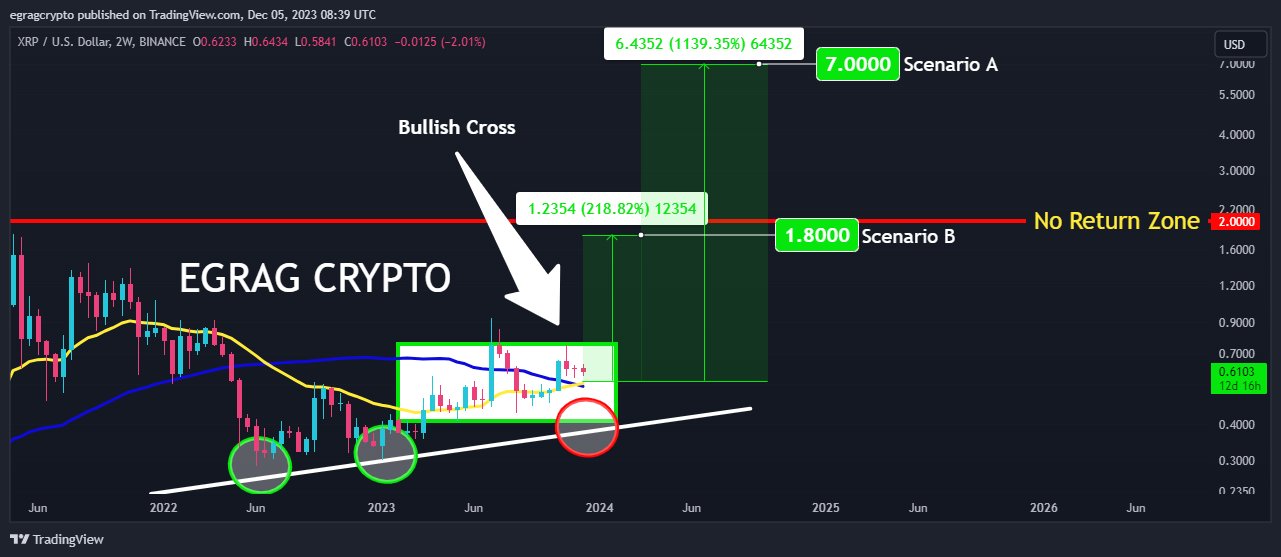
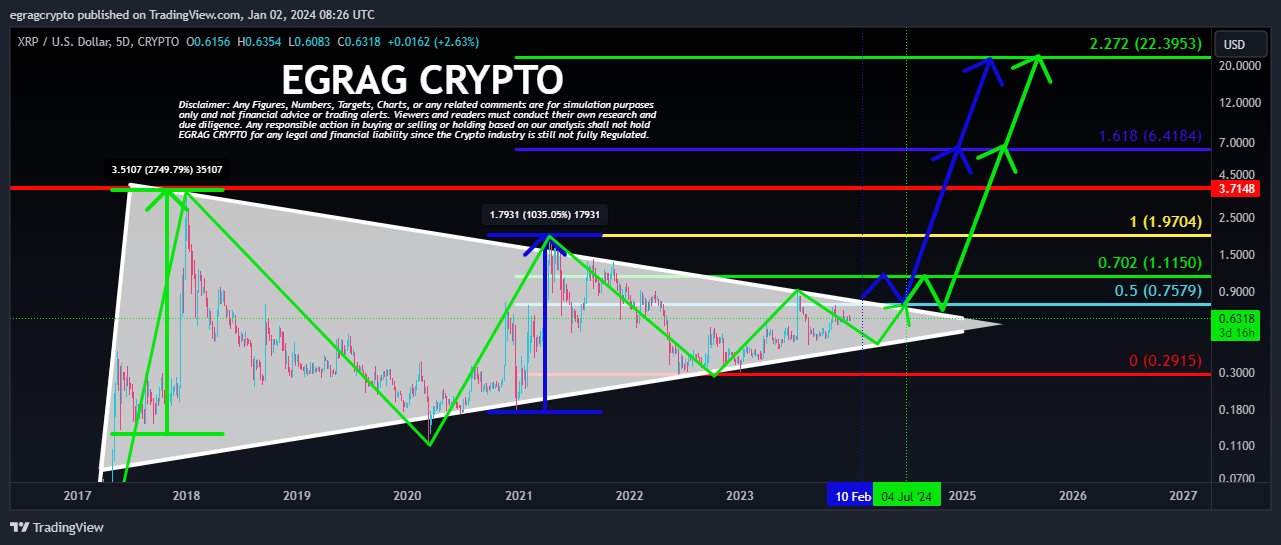
As a result, Egrag crypto has predicted a potential 7000% price rally if XRP breaks out of the moving averages. However, the expert believes the rally will occur when XRP’s price reaches $2.2.

XRP

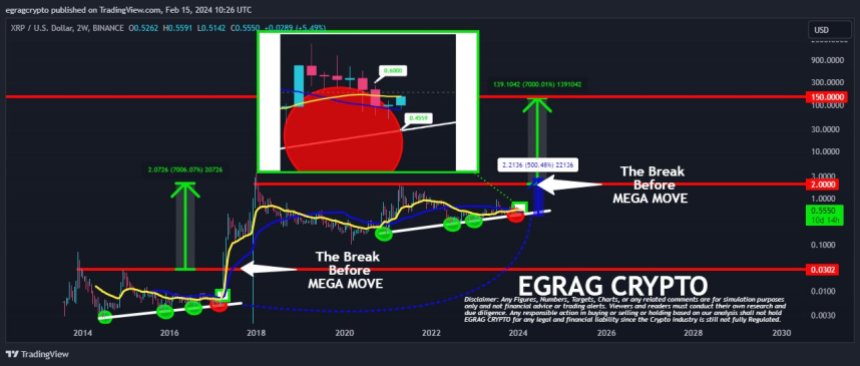
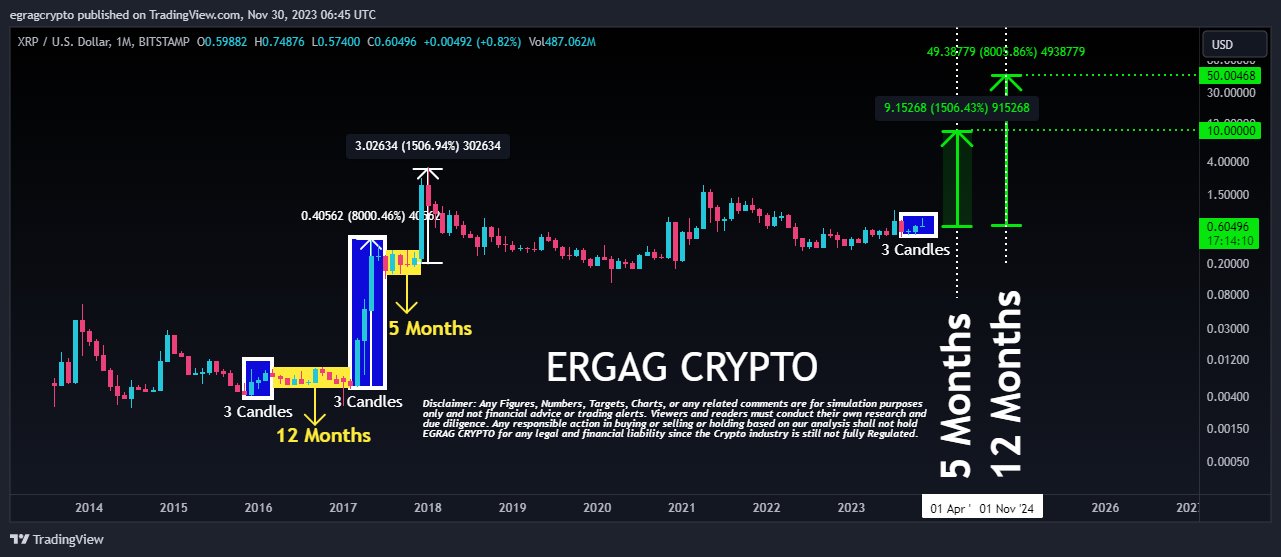
If such a rise occurs during the aforementioned price level, it will increase to about $139, according to Egrag. His forecasts are supported by historical data, which he uses to highlight a similar trend in the 2017 bull run.

It is noteworthy that before the 2017 bull run, XRP was similarly hedged between the 21 EMA and the 55 MA. On the other hand, XRP initially saw a price spike to $0.0302 following a breakout, and then it soared by 7,000% to the $2 mark. 

The analyst has underscored that about 99% of people might not comprehend his projections now. Nonetheless, when utility starts to take off, it might just be the start of a multi-decade trend.

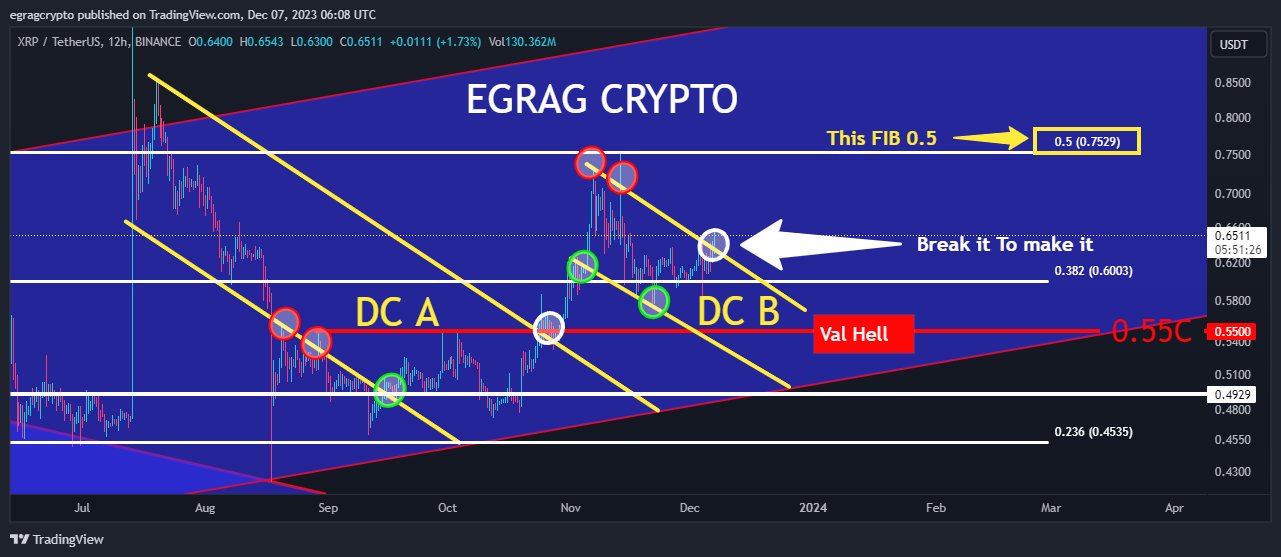
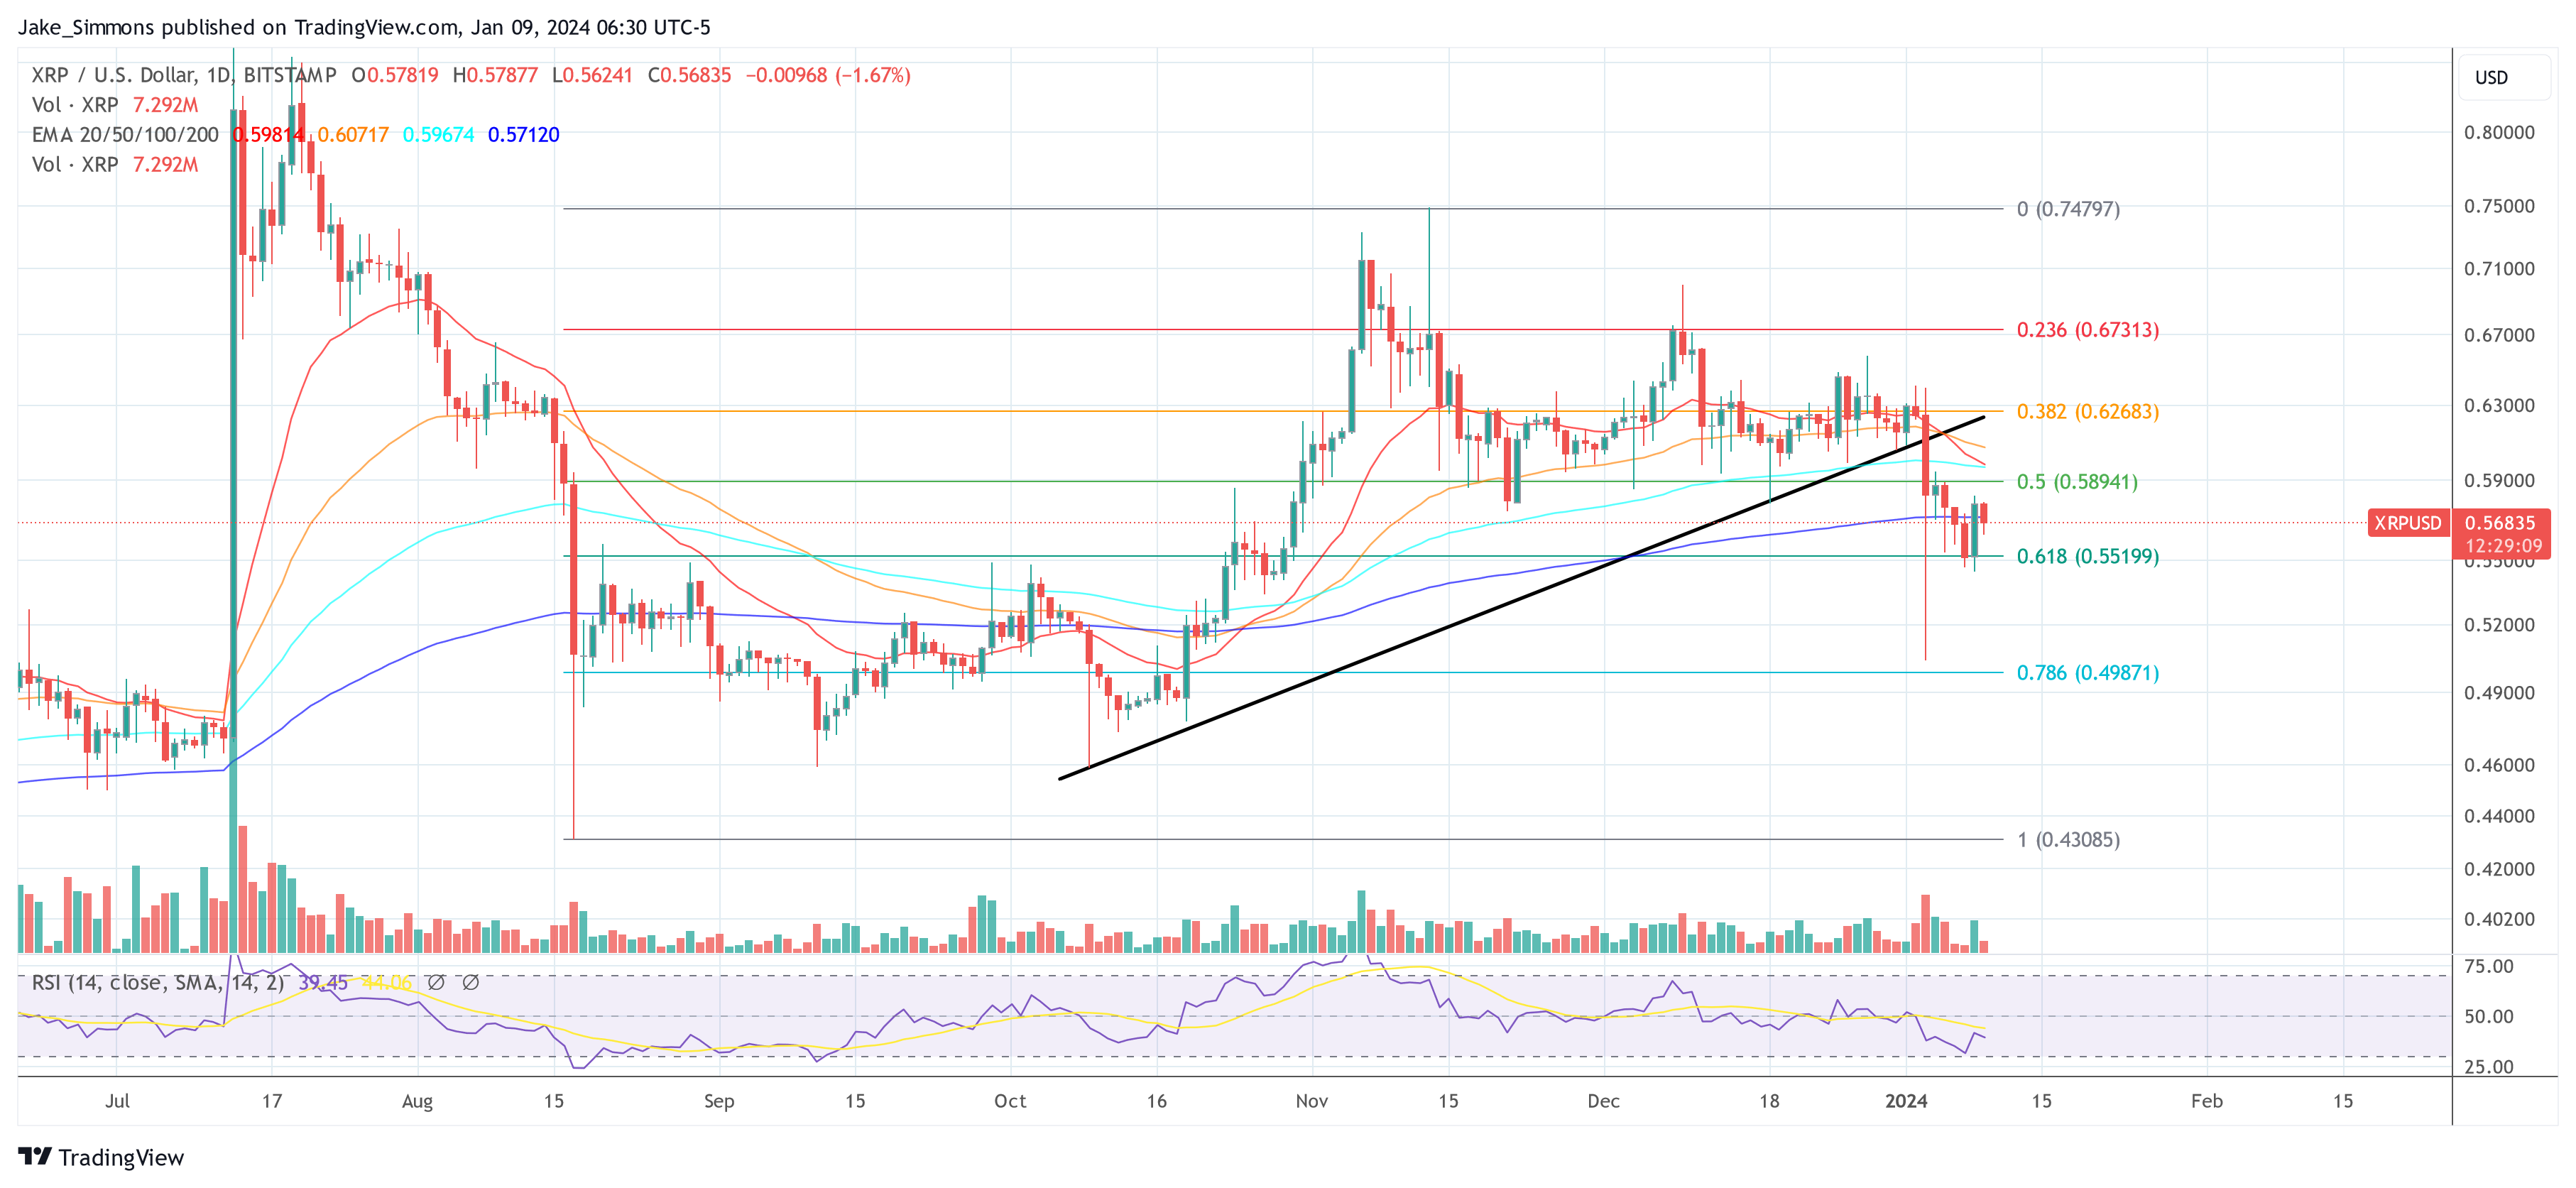
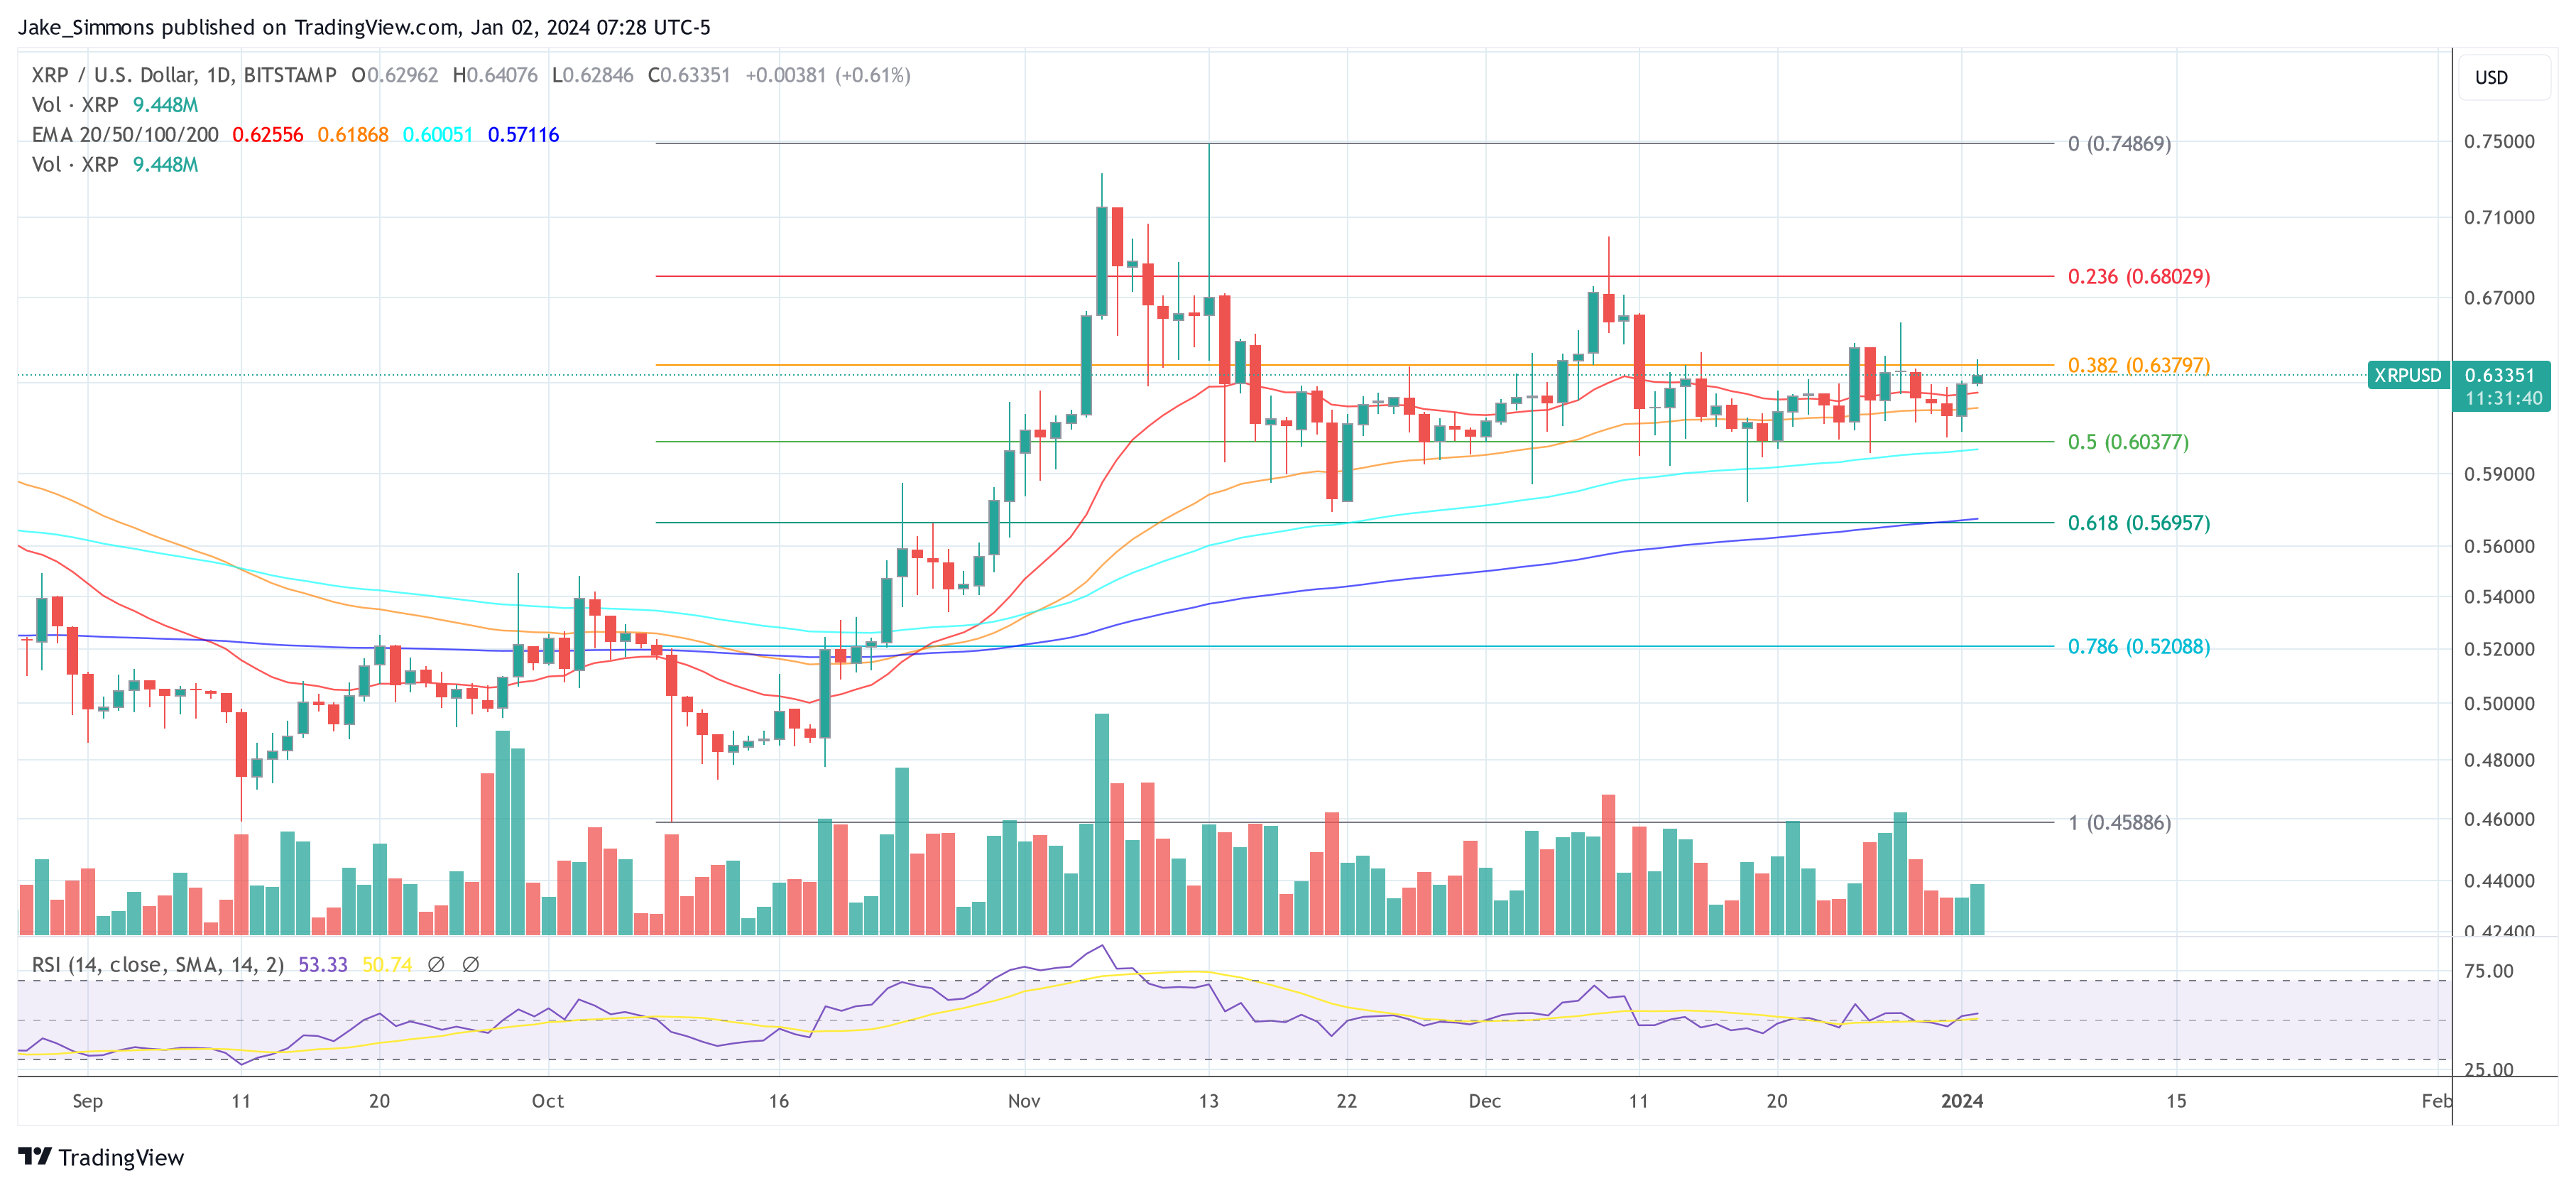
Even though a breakout from the 21 EMA and 55 MA presents a possible rally, there is also a risk for a potential decline. According to Egrag Crypto, this position could lead to a decline to around $0.45.

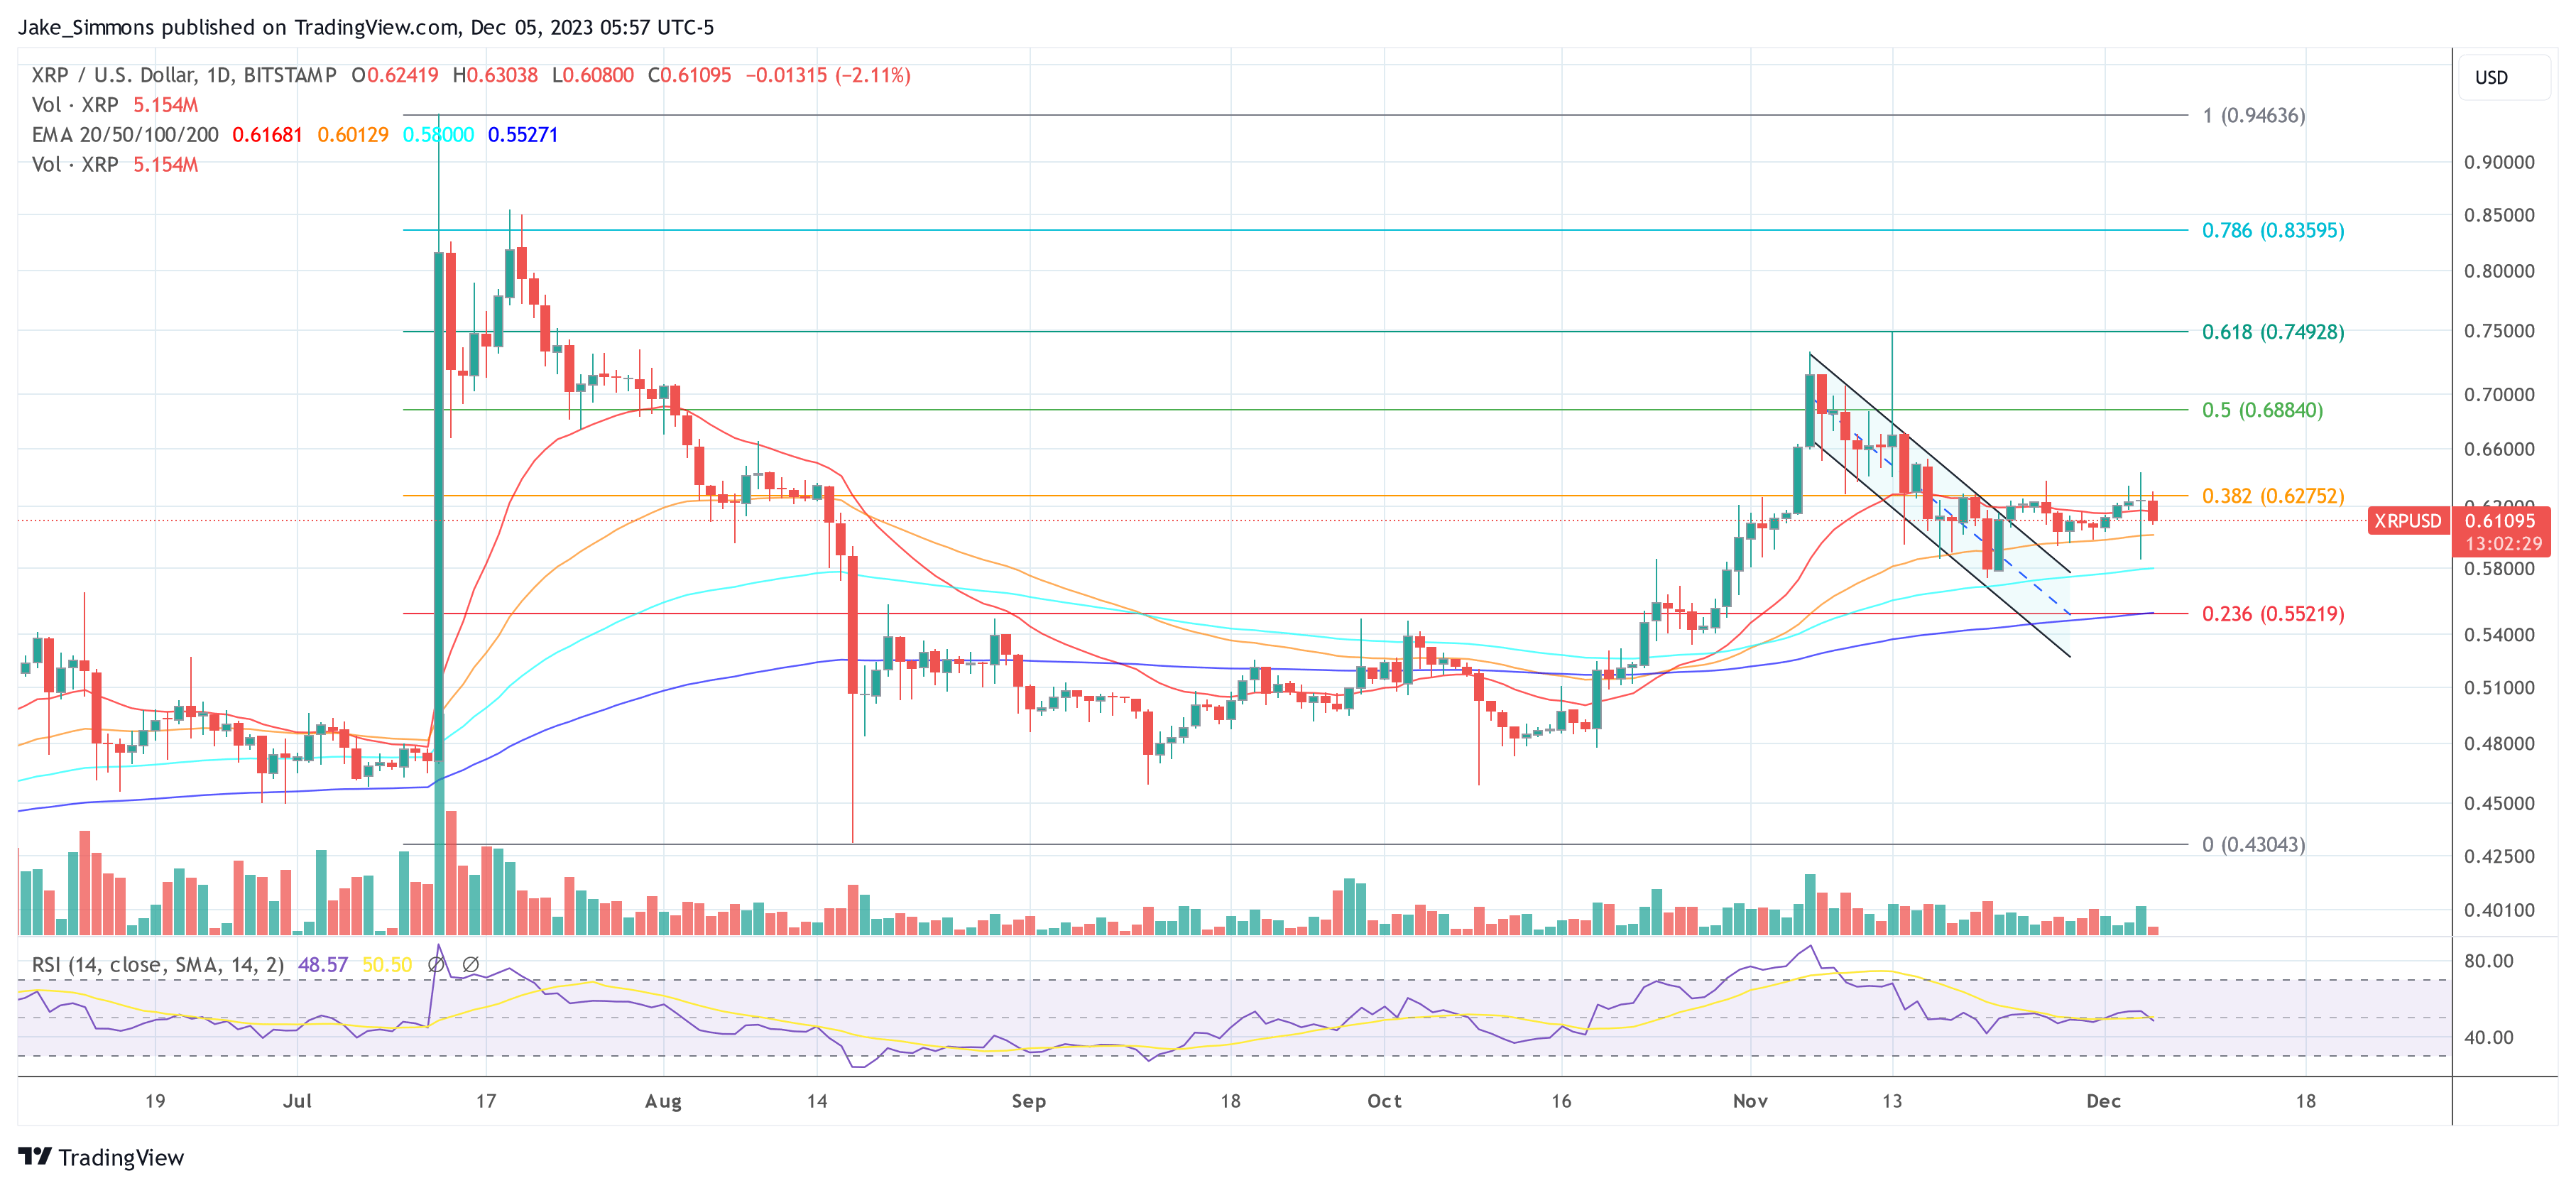
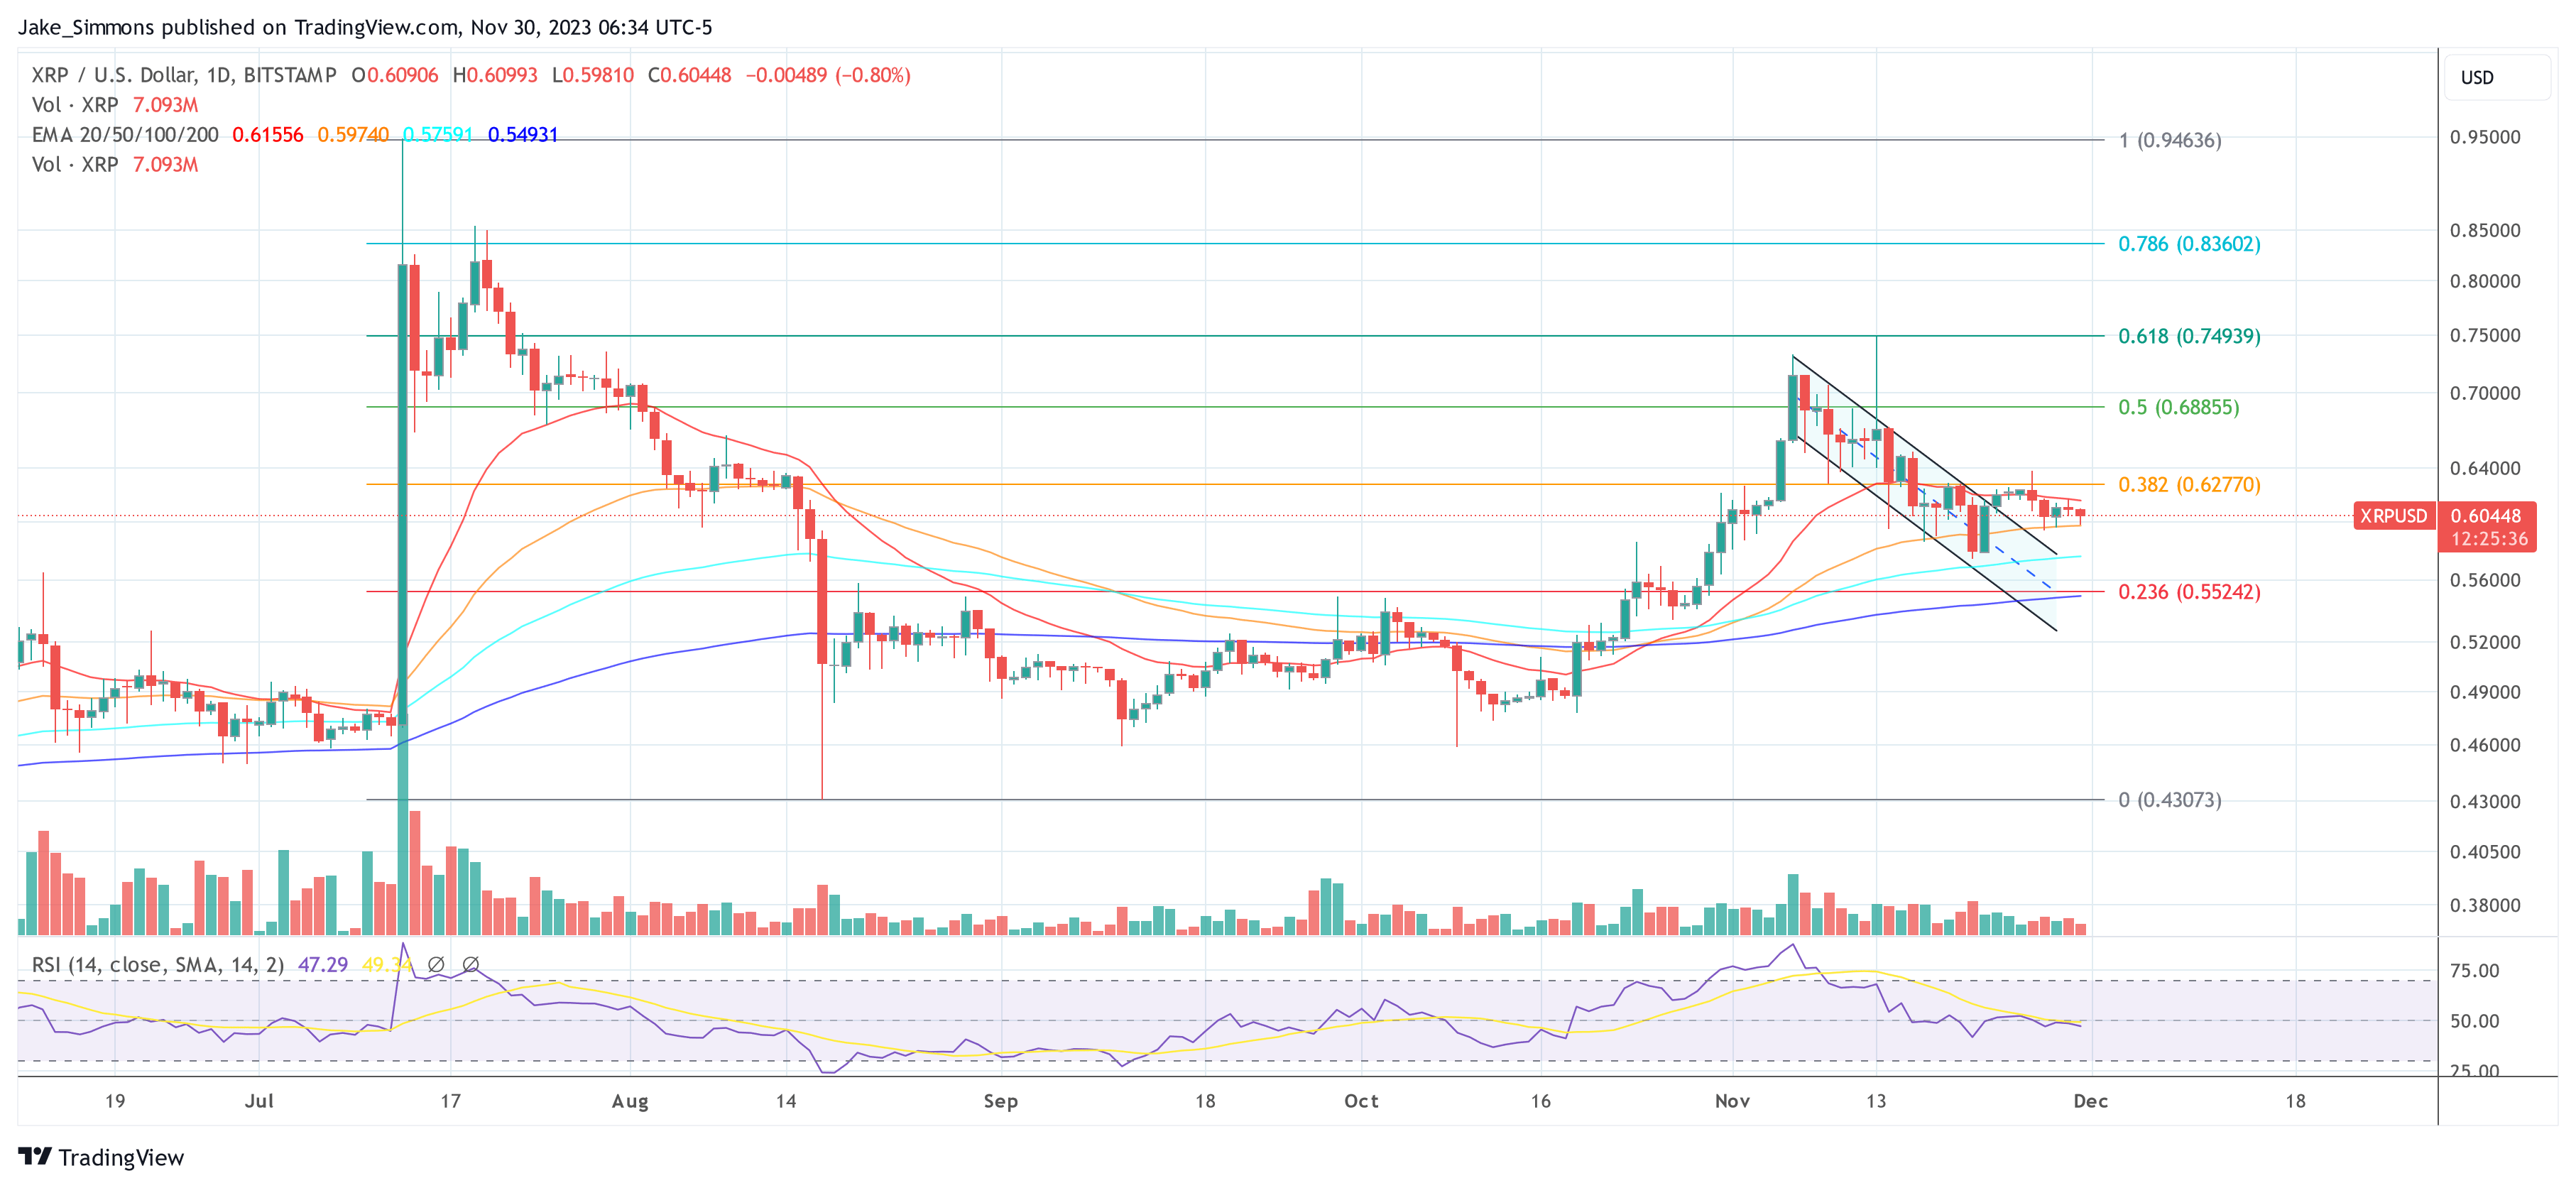
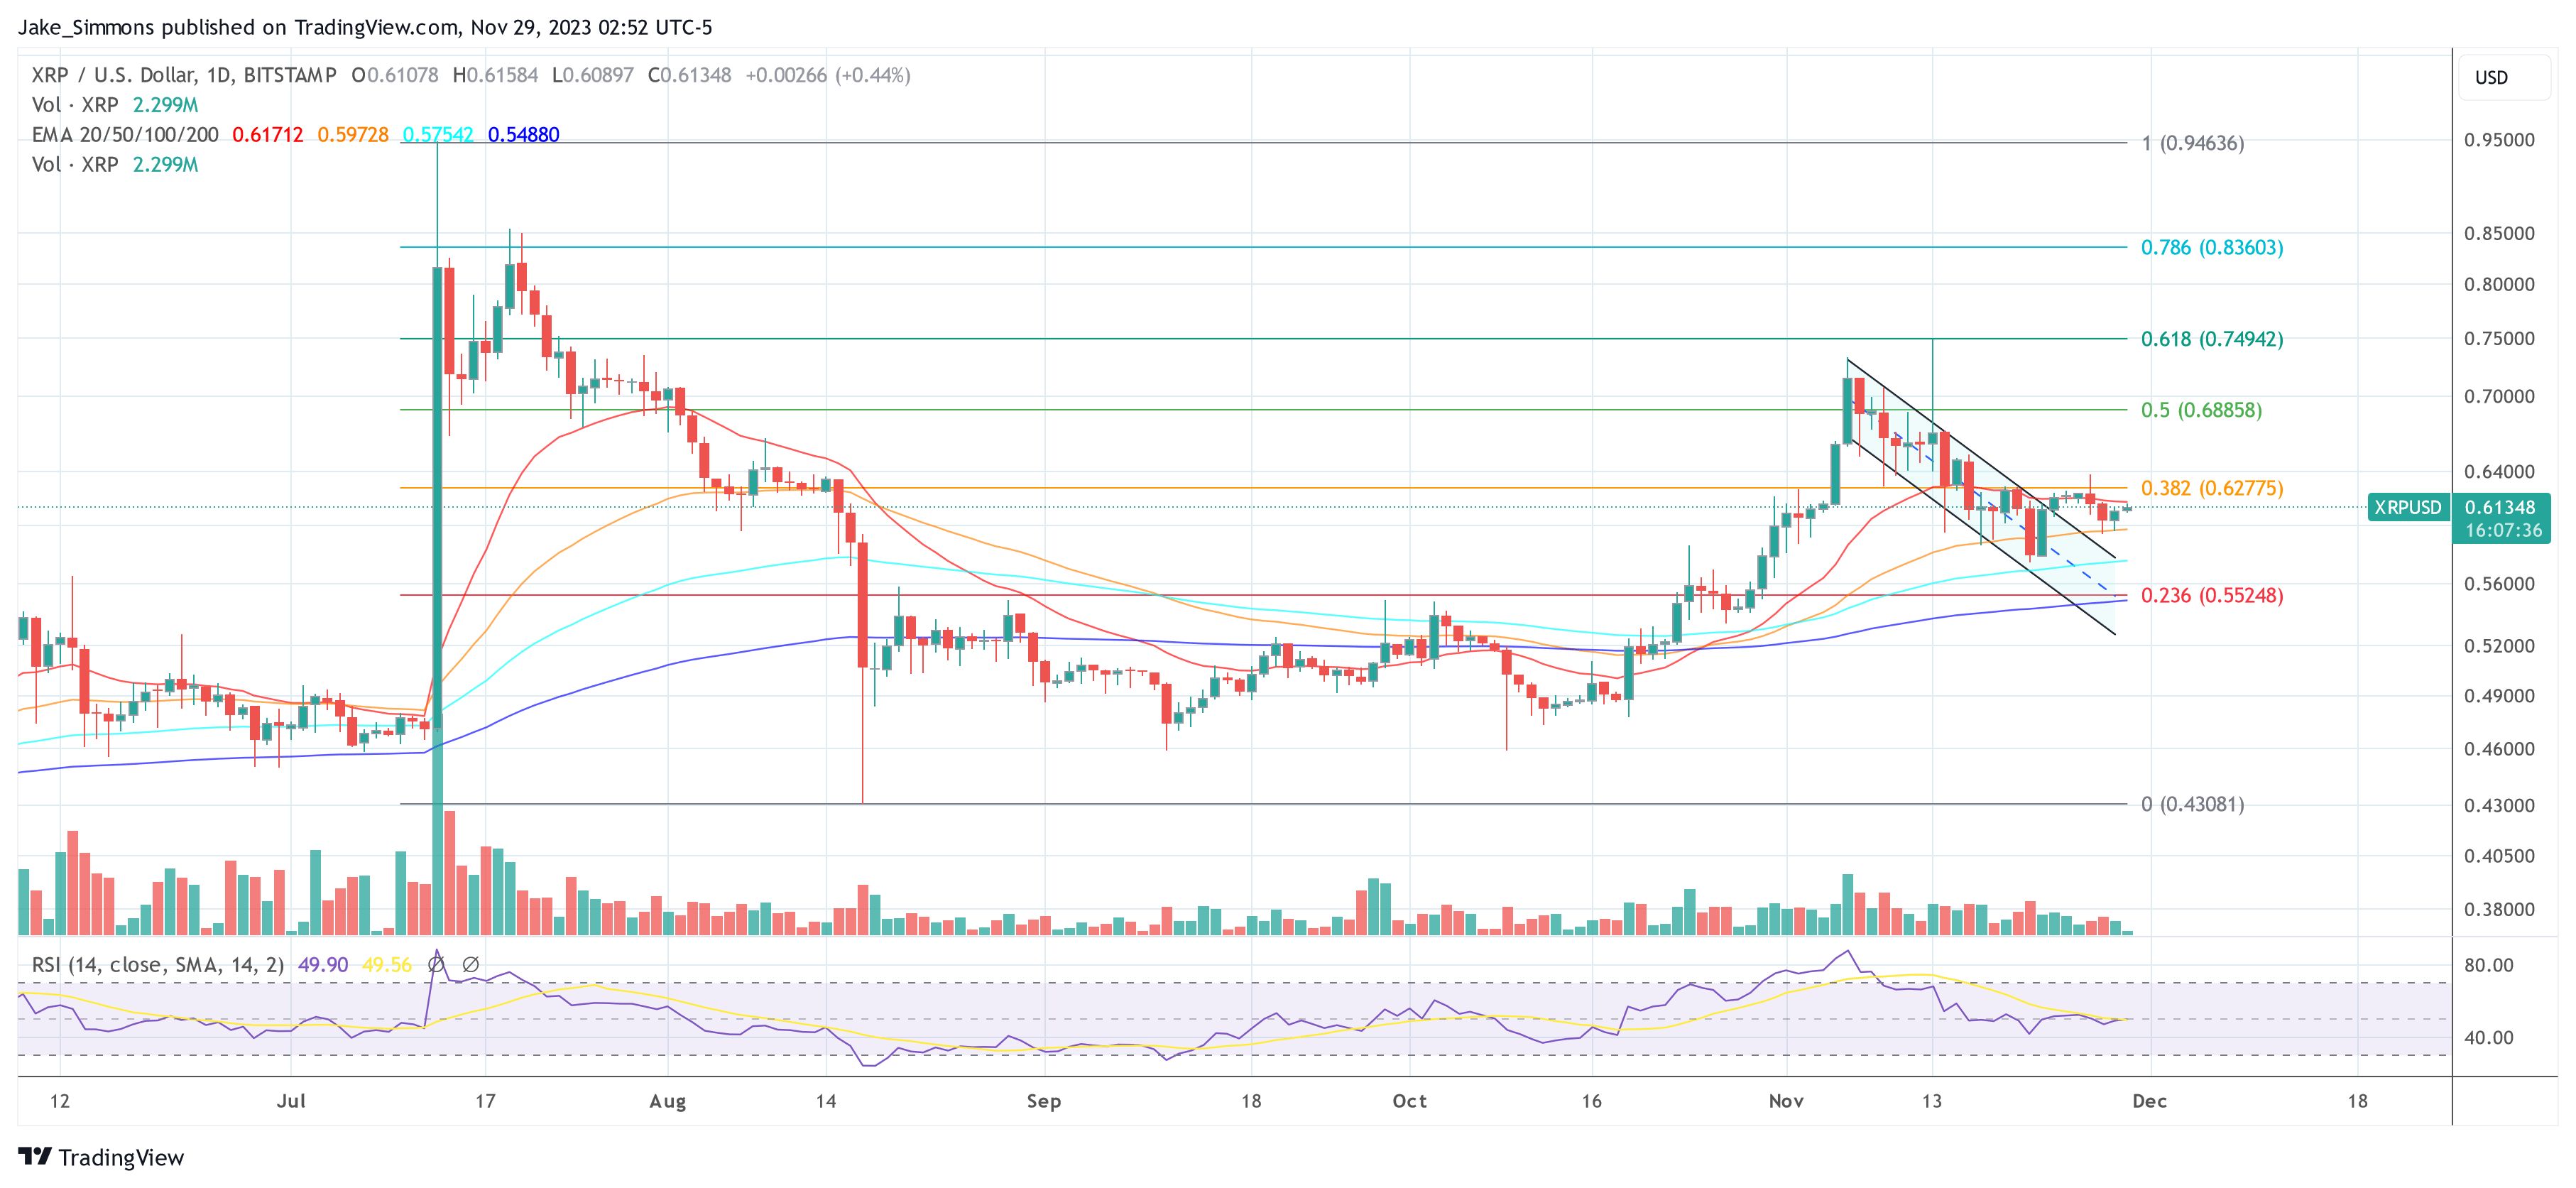
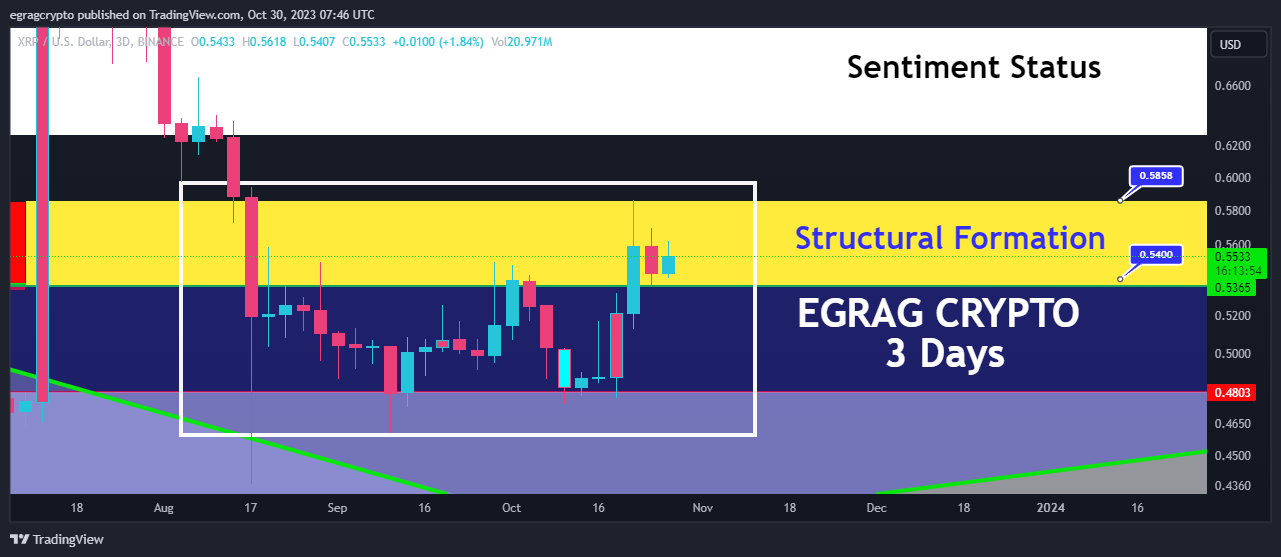
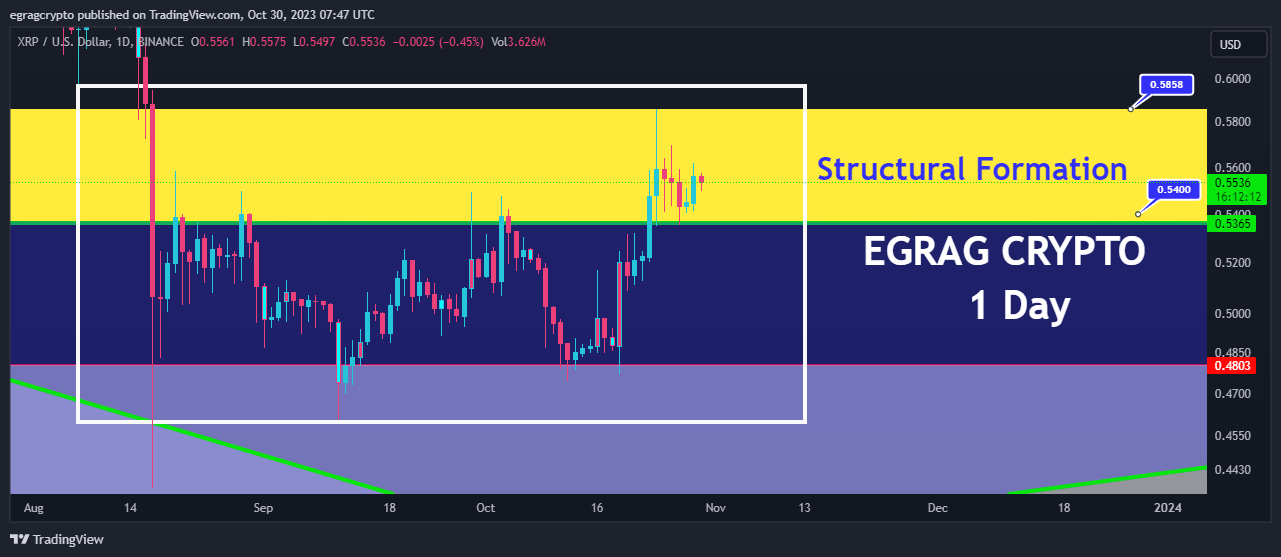
He further claimed that XRP closing above $0.60 would be crucial, pushing the asset above the 21 EMA. Additionally, it will rise above the level of local resistance in a “candle style.”

Several Factors Of The Mega Move 

Following the prediction, Egrag has pointed out multiple aspects that set his predictions aside. “This could be the prelude to a mega move, a breakout that occurs once in a lifetime,” he stated.

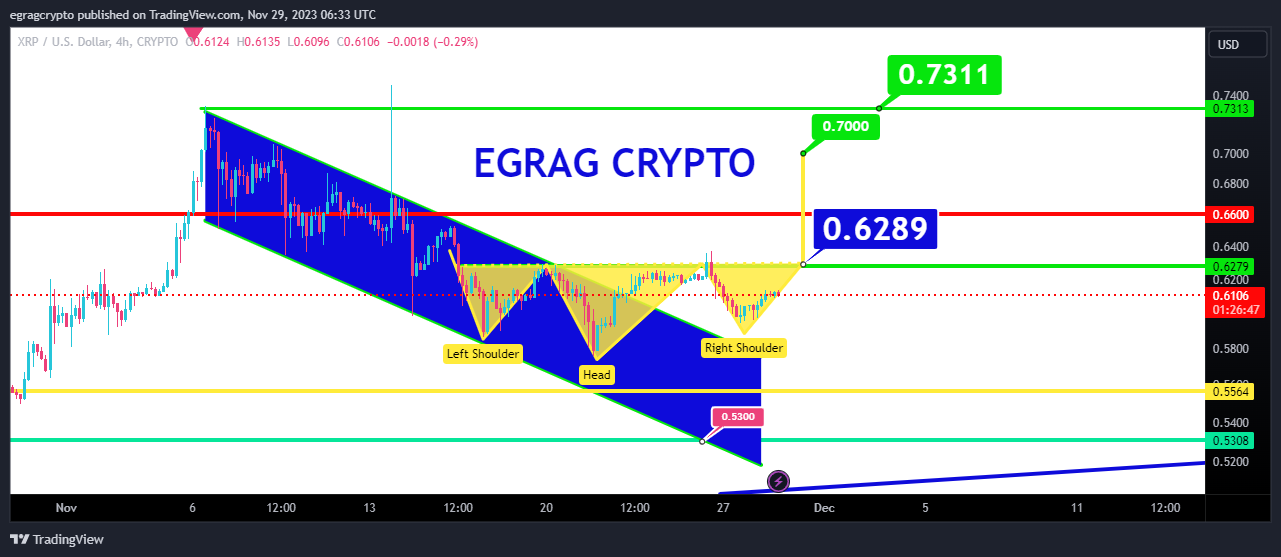
The first aspect highlighted by the analyst is that if the rally takes place, XRP would conclude “the W Formation.” After that, it could “finalize the ascending triangle formation.”

Meanwhile, for the last aspect, he noted that “it could trigger a 500% rise” from the current price of XRP. This might potentially start a big price surge from higher levels. So far, Egrag has urged the crypto community not to be misled by his chart, as his forecast could be a life-changing opportunity.

XRP

XRP Price Breakout To $5: Analyst Reveals Key Levels Of Importance

Crypto analyst Egrag Crypto has revealed key price levels to watch out for in one of his latest analyses of XRP. The analyst hinted that these prices could be crucial especially following his prediction that the crypto token will rise to $5 in 90 days

Targets That Confirm An XRP Bull Run 

In a post on his X (formerly Twitter) platform, Egrag highlighted $0.60, $0.75, $0.95, and $1.3 as price levels to keep an eye out for as they will validate a bullish trend. He says, “A weekly close above any of these levels signifies robust support and a continued upward trajectory.” 

Further elaborating on their importance, he noted that these targets “offer crucial insights into significant price behavior.” Considering that XRP has continued to trade below those levels, the token hitting any of those targets will easily suggest that the sentiment towards the altcoin has changed. 

Meanwhile, the crypto analyst also raised the possibility of XRP experiencing a 50% drop in pursuit of a move similar to the one in 2017, when XRP surged by 61,000%. Interestingly, Egarag believes that XRP replicating such a similar move will see the crypto token rise to as high as $27 in the next bull run. 

How XRP Could Crash To $0.28

Also offering a bearish narrative for XRP, Egrag stated that XRP could witness a flash crash to $0.28 should the blue channel (visible in the chart he shared) align with the red channel. If that were to happen, a subsequent rise to $0.41 from $0.28 could unfold, the analyst claims.

Egrag believes that these channels add more intrigue to XRP’s price action, considering that the crypto token has been navigating the blue channel for nearly 600 days since its breakout in May 2022. On the other hand, XRP is also said to have spent 580 days in the red channel before making a significant surge.  

As part of this bearish projection, the crypto analyst raised the prospect of a further BTC decline, dragging XRP alongside. Egrag claims that this could serve as the “ultimate shakeout, especially if market makers shake out the remaining weak hands.”

These market makers are the same persons that Egrag says “may engineer an independent surge,” which would propel XRP’s price to $5. If that doesn’t happen and the market ends up experiencing the worst-case scenario, the analyst urged everyone to seize the opportunity to obtain XRP at a “more favorable price.”

At the time of writing, XRP is trading at $0.54, down in the last 24 hours, according to data from CoinMarketCap. 

Featured image from Shutterstock

XRP Price Could Hit $220 With Gamma-Ray Burst: Crypto Analyst

Egrag Crypto, a crypto analyst on X, has released a technical analysis that suggests a potential surge in the price of XRP to as high as $220, drawing a vivid parallel to the astronomical event known as a Gamma-Ray Burst (GRB). In financial charting, the GRB analogy reflects a surge in price with a significant magnitude and rapidity, akin to the intense energy release of a cosmic GRB.

Egrag utilizes a Fibonacci Channel (Fib Channel) for his forecast, a technical analysis tool that traders employ to identify potential levels of support and resistance based on the Fibonacci sequence. A Fib Channel is constructed by drawing a trendline between two extreme points, typically a high and a low, and then dividing the vertical distance by the key Fibonacci ratios. These levels are parallel lines that run across the chart, which can act as markers for price targets or reversals.

Cosmic XRP Price Targets

The 1-month chart of XRP/USD shared by Egrag on X outlines these Fib levels. Egrag notes, “Reflecting on XRP’s potential to mirror its 2017 trajectory, analyzing current price positions reveals crucial figures within The Fib Channel.” Accordingly, the significant future price points are at $2.2 (0.236 Fib), $5.8 (0.382 Fib), $11 (0.5 Fib), $33 (0.702 Fib), and finally, the zenith at $220 (1.0 Fib).

XRP price analysis

Furthermore, the analysis identifies the two “Bull Market Lines” on the chart, which have been instrumental in past XRP price movements. Egrag’s analysis anticipates a third encounter with these lines, a possible indicator of a new uptrend.

The first encounter was when the XRP price crossed the first “bull market line” in March 2017. The XRP price rose by a whopping 60,000%, from $0.005 to $3.30, the current all-time high. This now also forms the starting point for the second “bull market line”, with its second connection point derived from its April 2021 high at $1.97.

According to Egrag, the XRP price currently needs to overcome the $1.20 mark in order to cross the “Bull Market Line – 2”. An impulse for this could be a crossover of the Simple Moving Average (SMA) and 24 SMA in the 1-month chart.

Egrag notes, “Once the bullish cross happens, almost 1 month later, the XRP bull run starts,” aligning with historical price actions marked on the chart as ‘Cross 1’ and ‘Cross 2’. The analyst suggests that a similar crossover is imminent, forecasting a shift from a bearish to a bullish market. Notably, the crossover happened at the end of December 2023 and the beginning of January 2024.

Egrag’s commentary on the social platform X adds a rallying call to the XRP community: “XRP Army: STAY STEADY And Get Ready, the shift from Red to Blue, and eventually to Green, is imminent. It will be a GRB Event.”

The Momentum Still Has To Turn Bullish

In conclusion, Egrag’s analysis presents a bullish case for the altcoin, with precise price targets and technical indicators serving as a guide for potential future movements. However, as with all market analyses, investors are advised to approach with caution and conduct their own research.

The XRP price has not fared well in recent months. Despite Ripple’s big win in the XRP lawsuit, the price has lost all its gains. At press time, XRP traded below the 200-day exponential moving average (EMA), which is considered to be the “bull line” in technical analysis.

XRP price

XRP Whale Makes Massive Transfer Amidst Price Volatility

In light of recent developments in the crypto market, XRP has once again garnered the attention of investors and the community as the crypto asset has witnessed yet another massive whale activity.

XRP Whales Moves Over 50 Million Token To CEXs

A recent report revealed that an XRP whale recently moved over 50 million tokens to cryptocurrency exchanges. On-chain data shows that the whale has been making this kind of transaction over the past few weeks.

Interestingly, these whale transactions have created a whirlwind of speculation among worldwide crypto market enthusiasts after they surfaced during the token’s price decline.  According to data from the on-chain tracker Whale Alert, the whale transferred 50.7 million tokens to centralized exchanges (CEX).

Whale Alert has revealed that the aforementioned funds were transferred to CEXs in two separate transactions. The whale transactions occurred amidst the token’s downward movement raising speculation on its effect on XRP’s price.

The on-chain tracker reported that the first transaction saw a whopping 26 million XRP tokens valued at approximately $15.22 million. Data shows that the unknown address identified as r4wf7enWPx…5XgwHh4Rzn moved the tokens to the Mexican-based crypto exchange Bitso.

Meanwhile, the second transaction moved 24.7 million XRP tokens valued at about $14.68 as of the time the transfer was made. The same wallet address mentioned above had transferred the funds to another crypto exchange Bitstamp.

It is noteworthy that the aforestated wallet address has been orchestrating this kind of transaction to the CEXs for a while now. Last week, Whale Alert detected the wallet address transferring over 48 million XRP tokens to Bitstamp and Bitso.

In less than two weeks, the wallet address has moved over 138 million tokens to the cryptocurrency platforms. With the current price of the digital asset, this is valued at over $79 million.

The Crypto Asset Poised For A Significant Upswing

On Wednesday, the entire crypto market experienced a notable disruption which saw XRP falling close to its October lows of $0.50. Despite the significant price drop, cryptocurrency analyst Egrag Crypto has expressed bullish sentiments about the crypto asset.

Egrag has recently shared bold predictions for the asset on the X (formerly Twitter) platform. The crypto analyst pointed out that the token’s price is currently getting ready for an upswing.

XRP

He noted an August scenario where XRP reached the lower boundary of its channel during the 1 billion liquidation across crypto. “Now, after five months, it is going back to that zone with another aggressive 1 billion liquidation,” he stated.

He highlighted that the asset’s bulls have been steadfast in “defending this channel,” not allowing anything to stop them from “buying into the dip.” He asserted that the bulls have maintained the price above the “Val Hell Line,” preventing a “daily candle” close below it.

So far, Egrag has pointed out “a slight retest” around the $0.55 appears to be “pretty standard” market behavior.

XRP

Crypto Analyst Predicts XRP Price Breakout To $22.39, Here’s When

The XRP price has been languishing in a protracted consolidation phase recently. Yet, a recently presented technical forecast by chart specialist Egrag Crypto suggests an impending shift in this trend may be on the horizon. The 5-day XRP/USD chart shared by Egrag suggests a potential price breakout, with a long-term price target above $22.

Egrag’s commentary is vivid and emphatic: “XRP: IT IS BREWING: The chart for XRP is tightening up like a pressure cooker ready to blow! An eruption seems inevitable, and the anticipation is rising faster than ever. XRP Army STAY STEADY, The pressure is mounting, and it looks like something massive is about to break loose!”

XRP Price Breakout Is Brewing – Here’s When

The chart features a symmetrical triangle pattern. This pattern in technical analysis often represents a consolidation period preceding a breakout. Since early 2017, the XRP price has been fluctuating within these converging trend lines, suggesting a tightening range that typically precedes significant price movements.

Moreover, Egrag Crypto points to a number of Fibonacci retracement levels. According to the chart, these levels are poised to act as key resistance points. The most immediate level to watch is the 0.5 Fibonacci level at approximately $0.7579, followed by the 0.618 level at around $1.1150. The chart indicates a bullish scenario where the price could break past these levels, aiming for a target at $1.9704, corresponding to the 1 Fibonacci level.

XRP price analysis

Egrag also presents two possible scenarios for the price breakout from the symmetrical triangle. In the first scenario, he anticipates the XRP price could break out of the pattern around February 10, requiring a breach above the 0.5 Fibonacci retracement level. This move would pave the way for targeting the $1.1150 level, expecting strong resistance there and a subsequent retest of the breakout level, potentially setting up for a parabolic rise into 2025.

Alternatively, Egrag suggests a scenario where the XRP price initially declines towards the lower trend line. If the support holds, the price could ascend towards the upper trend line, with a breakout expected around July 4, 2024, at the 0.5 Fibonacci level. Following this, the 0.702 Fibonacci level at $1.1150 would act as a local high before a retest of the breakout from the symmetrical triangle occurs, potentially establishing the conditions for a massive bull run.

In both scenarios, the medium-term target would be the 2021 high at $1.9704, followed by the $3.7148 level, corresponding to the all-time high of XRP. In price discovery mode, the 1.618 and 2.272 Fibonacci extension levels are identified by Egrag as long-term goals, standing at $6.41 and $22.39, respectively.

At press time, XRP traded at $0.6335. On the daily chart, the 0.382 Fib retracement level at $0.6379 is currently the most important resistance to overcome in order to build up new momentum.

XRP price

VeChain (VET) Set To Explode: Analyst Predicts 7,500% Rally To $2.3

Popular crypto analyst EGRAG just predicted a massive 7,500% rally that will send VET soaring to $2.3. VeChain (VET) is currently trading at $0.02945, but according to this analyst, the crypto is set for a price growth that would send it on a price growth into three sequential price targets.  

EGRAG Predicts VET To Hit $2.3

VET’s price has had its ups and downs this year, reflecting the general market volatility of crypto assets this year. The crypto went on a price spike very early in the year, going on a 101% growth in the first two months from its 2023 open of $0.01579 to reach $0.03186 in February. The crypto would then go on a price decline over the next few months to a 2023 low of $0.01477.

However, things started to change in October as the entire crypto industry changed into a bullish sentiment. VET is now up 80% from its October bottom, and according to EGRAG, the growth is set to continue in the coming months.

In a recent post on social media platform X, EGRAG wrote “VET will unlock ur financial chains,” along with three bullish targets for the coming year. A look through the price chart shared shows sequential targets of $0.11642, $1.05737, and $2.3. These targets represent a respective 295%, 3490%, and 7,500% rise from the current price.

As indicated on the price chart shared by EGRAG, VET has primarily traded in a downward range, creating lower highs and lower lows since its all-time high in 2021. The crypto broke out of this range in October and has formed five bullish candles on the three-week timeframe. 

Using the Fibonacci indicator and the 2023 bottom as a starting point, the analyst drew a mirror of VET’s ascent from the 2020 bottom to its all-time high in 2021. Based on this, EGRAG noted VET is poised to potentially rally over the next few months into 2024. If history repeats itself, we could potentially see VET break past its current all-time high of $0.28 before the second price target.

What’s Next For VeChain (VET)?

VET is VeChain’s native token, a blockchain network looking to streamline supply chain management with distributed ledger technology. Several crypto experts have weighed in with predictions on how high VET’s price can go in the next bull market.

According to Ali Martinez, VET is set for a 150% price gain in the next six weeks. The analyst noted that VET is currently mirroring the 2018-2020 consolidation phase. If history repeats itself, VET could break through the $0.033 resistance barrier within the next two weeks and ultimately reach $0.077 in January.

Featured image from iStock

Analyst Predicts XRP Price Will Rise 800% To $5.5 – The Timeframe Will Shock You

Popular crypto analyst EGRAG crypto has dropped what looks like the most bullish price prediction for XRP. XRP has been subjected to various price predictions in the past few months from EGRAG and other crypto analysts, as the crypto now has free rein on its price movement. This time, the analyst claims XRP is ready to explode 800% in just two weeks, rocketing from under $0.65 today to over $5.50 in just 14 days. EGRAG’s analysis pointed to price movement and the Fibonacci indicator, indicating XRP is gearing up for a huge rally.

Massive XRP Price Surge In A Short Time

EGRAG took to social media platform X to reveal his latest prediction about XRP. The prediction came as an update to the analyst’s earlier prediction in May, where he shared that XRP’s price was at the final wake up line. The Final Wake Up Line was drawn from XRP’s all time high of $3.40 in 2018, sloping downwards as the crypto continued to form lower highs. At that time, XRP was trading at $0.4639 and EGRAG gave three price targets of $0.85 to $1, $5.5, and $6.1 in the coming months. The analyst also drew a bottom (Atlas) line on higher lows since 2021 to form a symmetrical triangle.

Now five months after, XRP has had major events in its ecosystem, becoming the only crypto asset to receive regulatory clarity in the US. As a result, XRP went on a price growth that led to a spike over $0.93 against USDT on various crypto exchanges. According to EGRAG, his first target of the $0.85 to 1$ was completed amidst the price spike. 

A look at the price chart shared by EGRAG reveals XRP seems to have formed a support around this final wake-up line. Now, the next target is around $5.5, a measured move of the symmetrical triangle formed between the final wake up and atlas line. EGRAG claims we could see XRP trade at this price point in just two weeks. 

How Feasible Is This Price Prediction?

XRP has since fallen below the analyst’s first target of $0.85. At the time of writing, XRP is trading at $0.62, down by 9.59% in a 7-day timeframe. EGRAG argued that the recent price correction could make investors jump ship, but HOLDing is still the best decision at this moment.

A surge to $5.5 would mean an 800% price gain from the current level before the end of the year. However, current fundamentals points to an increase of this magnitude in such a short timeframe being very unlikely .

EGRAG clarified in a comment that the prediction wasn’t based on the next two weeks. Instead the rally to $5.5 would be completed in just a two week timeframe.  

Featured image from Shutterstock

How XRP Price Could Surge To $1.5: Crypto Analyst Explains Key Factor

Crypto analyst Egrag has published a new short-term price prediction for XRP, indicating a possible rise should the price overcome a critical technical hurdle. Egrag’s analysis looks at the 12-hour chart of the XRP/USD trading pair, where a trend channel breakout could trigger a short-term buy signal.

XRP Price Breakout Imminent?

According to the crypto analyst, the price has recently been moving within a descending channel (DC). Now, XRP is at an inflection point that could have a significant impact on its price. Egrag has identified the structure as “DC B”, a bearish pattern where the asset has formed lower highs and lower lows.

A key focus of Egrag’s analysis is XRP’s interaction with this pattern. Since the beginning of the chart pattern, the price has twice touched the upper trend line, which serves as resistance, and twice touched the lower trend line, which serves as support.

Currently, the XRP price is about to retest the upper line of the trend channel for a third time. Should it succeed in breaking out of the downtrend channel, this would be an extremely bullish sign. From mid-July to the end of October, the price was already in a descending channel, which Egrag refers to as “DC A” in the chart.

After XRP broke out of the downward channel A, the price rallied by over 50%. Something similar could happen now if history repeats itself. Egrag explained, “XRP seems to be mirroring its previous price action within a descending channel (DC). Check out the chart below to see how price is attempting to break out of DC B. The next challenge for XRP is to surpass descending channel B to reach Fib 0.5.”

XRP price analysis

What’s Next?

Should a breakout succeed, the 0.5 Fibonacci retracement level at $0.7529 would be the next major resistance in Egrag’s chart. An upward breakout above this level could indicate the start of a trend reversal that could drive the price towards the $1.30 to $1.50 range.

“A breakthrough past the 0.5 Fibonacci level hints at upward momentum, signaling a shift from a downtrend to a potential uptrend, instilling confidence. […] Pay close attention: Fib 0.5 at a price target of 0.7529c could be the gateway to a potential move towards 1.3-1.5$,” Egrag explains, suggesting that such a move would be an important indicator for traders.

In conclusion, Egrag advises investors to keep a close eye on trading volume and overall market sentiment, as these factors will play a crucial role in the asset’s ability to reach and exceed these crucial levels.

At press time, XRP traded at $0.63959.

XRP price

XRP Price Set To Skyrocket 1,100% On This Signal: Crypto Analyst

In crypto trading, history often repeats itself, or at least rhymes. That’s why it can be crucial to spot historically important price signals and patterns. A recent technical analysis by Egrag Crypto has spotlighted such a pattern for XRP, indicating a possible massive price increase.

This analysis hinges on the observation of a bullish crossover between the 21 Exponential Moving Average (21 EMA) and the 55 Moving Average (55 MA) in the 2-week chart of XRP/USD. Egrag states, “XRP Rockets: 21 EMA & 55 MA Signal Explosion: Let’s decode the XRP trajectory – my focus? Just two pivotal weekly candles after the crossover between 21 EMA & 55MA.”

Will The XRP Price Soar To $7?

The chart provided by Egrag Crypto highlights the XRP price movements in the two distinct scenarios when this rare bullish signal occurred. The first bullish crossover of the 21 EMA and 55 MA in the 2-week chart occurred in March 2017 (scenario A). Following this signal, the XRP price saw “two striking 2-week candles. The initial one surged by around 90%, trailed by an electrifying 1100% spike,” Egrag remarked.

For the second time in the history of the XRP price, the signal flashed at the end of December 2020. This time, the XRP rose by 100% in the first candle, succeeded by an 84% surge in the second 2-week candle which marked a collective 200% upswing.

XRP price

According to the crypto analyst, there’s a high probability that these scenarios will repeat themselves. “Drawing parallels from past bullish runs, my opinion syncs with historical data,” Egrag remarked.

Notably, the chart of Egrag also features an ascending trend line, a bullish indicator, which XRP has tested twice, as shown by the two green circles in mid-2022 and early 2023. These taps on the trend line are critical, as they suggest that each touch is a test of support where the price finds enough buyers to begin a new upward movement.

The analyst speculates that XRP could dip slightly more to tap the ascending trend line a third time, which could be a precursor to a significant price rally. This potential third tap on the trend line is viewed as a buying opportunity that could precede a considerable price surge.

XRP price

Following this third retest of the trend line, Egrag expects two possible scenarios based on the bullish crossover of the 21 EMA and 55 MA. In scenario A, the crypto analyst envisions a dramatic rise in the XRP price, projecting a target of $7.00, which would represent a staggering increase of 1,139.35% from the current price.

Scenario B suggests a more conservative target of $1.80, which would still be an impressive gain of 218.82%. The “No Return Zone,” marked in red at the $1.80 level, is set just above scenario B’s target. It indicates a critical threshold that could either act as a resistance zone or confirm a strong bullish momentum if the price sustains above it.

Broader Market Forces

The crypto analyst is also aware that the Bitcoin price traditionally plays a major role for altcoins such as XRP. He therefore notes on the current market conditions, “eyes fixed on BTC as the majority anticipates a $48K-$50K peak, potentially followed by a pullback, igniting a widespread alt season. Yet, what’s intriguing? A scenario where BTC skyrockets to ATH, retraces, and unleashes a truly wild alt season.”

The analyst’s perspective leans towards an initial spike to between $7 to $10, followed by a significant retracement, and then an even more substantial rise to the levels of $20 to $30. On being queried about the extent of the expected retracement from the $7-$10 range, Egrag Crypto answered an “aggressive $1.3-1.5” drawdown.

At press time, XRP traded at $0.61095.

XRP price

XRP Price Set To Explode: Analyst Identifies Trigger For Next Parabolic Move

Crypto analyst JD has once again commented on XRP making a “parabolic” move. This time around, he has identified exactly what needs to happen for the crypto token to enjoy a significant rally

All Eyes On The MACD

In a post shared on his X (formerly Twitter) platform, JD highlighted the MACD (Moving Average Convergence Divergence) as the trigger for the crypto to enjoy a significant rally. He noted how XRP went “parabolic” the last time the MACD crossed the 0 level. According to him, that hasn’t happened this time, but the market seems very close to that level. 

JD shared an accompanying chart to elucidate his point. From the chart, one could see that XRP enjoyed a 650x gain the last time the MACD crossed 0. This significant breakout, which came in 2017, happened after a 4-year trendline that dated back to 2014. 

This time, the coin has consolidated for a longer period as he highlighted an 8-year trendline that dates back to 2017. He expects the market to instantly become bullish if there can be a breakout from that trendline. For now, JD believes that a bullish cross is still in play despite the fact that the MACD is below 0. 

In response to his post, another X user stated that “it’s game over” once XRP crosses the $0.92 price level. JD seemed to agree as he stated that it was going to happen. Meanwhile, the crypto analyst has remained cautious about giving a prediction as to what price level XRP could hit. However, from the chart he shared, XRP could rise to as high as $15, taking a cue from 2017.

Between XRP And Bitcoin

Crypto analyst Egrag Crypto has also given his view on the future trajectory of XRP in relation to Bitcoin. He spoke about a “Helheim Gate Way” scenario and how Bitcoin’s price could affect XRP’s. He said BTC surging to the 48k-50k range might exert pressure on XRP, causing it to decline against the flagship cryptocurrency

In this scenario, XRP’s decline is a result of Bitcoin apparently absorbing substantial liquidity, driving the latter’s dominance higher. However, things could turn out differently if XRP decides to “decouple and carve its unique path.”

Although this projection doesn’t seem favorable for XRP, Egrag noted that it could still be “remarkably bullish.” The reason is that liquidity could flow back “aggressively and abruptly” to altcoins like XRP once Bitcoin releases all the absorbed funds. Crypto analyst CrediBULL Crypto has once mentioned something in this regard. 

He stated that XRP’s price could decline in the short term as Bitcoin continues to enjoy a parabolic rise. He, however, mentioned that XRP will be one of the biggest benefactors once there is an “influx of new money.”

Featured image from iStock

Rare Signal Predicts Next XRP Price Move: Crypto Analyst

The XRP price has been treading water in recent days. After XRP rose by more than 52% in just 18 days from mid-October to early November, the price is currently in a clear consolidation phase in the shorter time frames. However, a look at the 1-month chart of the XRP/USD trading pair shows that the XRP price has exhibited strong bullish months.

In this sense, Crypto analyst Egrag has drawn attention to an extremely rare phenomenon in the XRP monthly price chart. The pattern in question is a series of three consecutive monthly green candles, which have only been documented twice in the history of the cryptocurrency.

As the market approaches the monthly close today, a confirmation by a close above $0.5987 could mean the third monthly green candle for XRP. “Get ready—within the next [few] hours, we’re poised to seal another trio of consecutive green candles,” Egrag noted.

Here’s What This Could Mean For XRP Price

Delving into the specifics, Egrag elucidates two distinct historical precedents post such formations. In the first scenario, a 5-month consolidation phase was observed after XRP recorded three consecutive green candles from March to May 2017.

However, the consolidation phase had an extremely bullish effect. After it ended, the XRP price experienced a staggering 1,500% surge within just two months. Egrag suggests that if XRP’s price action were to emulate this historical pattern, investors can anticipate a potential surge to $10, starting from the 1st of April 2024.

The second instance Egrag refers to the period from December 2015 to February 2016. During this time, the price rose by approximately 102% in three consecutive green months. What followed was a lengthier 12-month consolidation phase. But the wait was worth it again.

In March 2018, the XRP price started an extraordinary 8,000% rally. A replication of this scenario would imply a potential skyrocketing of XRP’s price to $50, beginning on the 1st of November 2024.

XRP price prediction

Notably, Egrag offers an average price target standing at $30. He stated, “XRP army stay steady, the average of these two targets lands at $30, you know that I always whisper to you my secret target of $27. Hallelujah, the anticipation is palpable!”

Price Analysis: 1-Day Chart

At press time, XRP was trading at $0.60333. A week ago, the price managed to break out of a downtrend channel. However, the bullish momentum quickly fizzled out after the price was rejected at the 0.382 Fibonacci retracement level at $0.627.

Related Reading: Bitcoin Decouples with XRP, BNB But Correlates With Dogecoin and Cardano

For four days now, the XRP price has been squeezed into a tight range between the 20-day and 50-day EMA (Exponential Moving Average), with a breakout to the downside or upside getting closer and closer. In the event of an upside breakout, the price level at $0.627 would be decisive. Then, the price could tackle the 0.5 Fibonacci retracement level at $0.688.

However, if a breakout to the downside happens, a 100-day EMA at $0.575 would be the first support. This must hold to prevent the price from falling towards the 0.236 Fibonacci retracement level at $0.552, which is also close to the 200-day EMA. The convergence of both indicators signifies a price level that the bulls must defend at all costs.

XRP price

XRP Price Set For 20% Leap In Coming Days: Crypto Analyst

In a recent technical analysis published by crypto analyst Egrag, an inverse head and shoulders (H&S) formation has been identified on the XRP/USD chart, indicating a potential bullish reversal in the near term. The pattern, which has been forming over the last two weeks, suggests that XRP could be setting up for a significant price jump.

XRP Price Poised For Imminent 20% Jump?

The chart by Egrag showcases the XRP price action in a 4-hour time frame, where it has been trading within a descending channel (blue) since the beginning of November. A descending channel is typically considered a bearish pattern.

XRP price analysis

However, last Wednesday, the XRP price broke out of the descending channel. While the breakout didn’t hold up and ended up being a fake-out, it paved the way for the emergence of the inverse H&S pattern which is now changing the momentum in favor of the bulls.

Technically, the inverse H&S pattern is distinguished by two smaller peaks (shoulders) on either side of a larger trough (head), which is evident from the chart’s annotations. The left shoulder formed around the $0.586 support level, with the head dipping as low as $0.574, before rising to form the right shoulder at $0.593.

This pattern is indicative of a bearish trend losing momentum and a potential bullish reversal if the pattern completes. Egrag’s analysis points to key price levels to watch, with the neckline of the inverse H&S pattern sitting at approximately $0.6289.

A decisive breakout above this resistance level could see XRP prices rally towards the $0.7000 mark, which aligns with the pattern’s predicted breakout target. Beyond this, the analyst’s target sits at $0.7311, which marked the beginning of the descending channel. A rally to this price level would represent a 20% increase from the current XRP price.

It is crucial to note that while the inverse H&S pattern suggests a bullish outcome, the validity of the pattern will only be confirmed upon a clear break and closure above the neckline. As always, while the technical setup is constructive for XRP bulls, market participants should consider various factors, including market sentiment, news flow, and broader market trends.

In a bearish scenario where the inverse head and shoulders pattern is invalidated, the XRP price could move towards the trend line of the descending channel. In his chart, Egrag marks $0.5564 and $0.53 as crucial support levels for the XRP price where a reversal could take place.

At press time, XRP traded at $0.61348. On the 1-day time frame, the 0.382 Fibonacci retracement level at $0.628 remains the key resistance level in the short-term.

XRP price

XRP Price Breakout Soon? Analyst Points To Bullish Structural Signs

In a detailed analysis shared on social media today, renowned crypto analyst Egrag points to several bullish indicators in the XRP price structure, suggesting the potential for an imminent breakout. Egrag evaluated various timeframes, identifying a series of technical patterns and formations that bolster the bullish outlook.

XRP Shows Strong Bullish Structural Signs

“Last week’s candle closed within the confines of the Yellow structural formation,” Egrag tweeted with regard to the weekly XRP/USD chart, emphasizing the significance of recent movements within the timeframe. This observation is instrumental in understanding the underlying market structures influencing the upcoming price action.

The implication? If another weekly candle were to affirm its position within this formation, the odds of a bullish trend continuation could significantly increase. “To confirm a bullish trend continuation, we need to see another weekly candle close with a full body inside this structure,” Egrag added.

XRP/USD weekly chart

Next, his insights extend further to the three-day chart, where he keenly observes, “In just 16 hours, XRP is poised to complete the second full body candle within the structural formation, signaling a strong bullish sentiment.” This near-term projection underscores a sense of momentum that appears to be building within the XRP market.

XRP/USD 3-day chart

The 1-day chart, too, garnered Egrag’s scrutiny. He highlighted the imminent completion of the seventh full-body candle within the current structure, stating this indicates an “extremely bullish trend.” This observation suggests that XRP’s bullish behavior isn’t just a fleeting phenomenon but has consistency across varying timeframes.

XRP/USD 1-day chart analysis

For traders with a penchant for shorter timeframes, Egrag’s insights into the 12-hour chart are particularly salient. While there have been multiple closures within the structural formation, he singled out the importance of the ongoing momentum: “The current candle and the next one are pivotal as they form a symmetrical triangle.”

He elaborated on the implications of this pattern, saying, “Typically, symmetrical triangle breakouts have a 50/50 chance, making this a decision point for XRP.”

XRP Price Targets

Circling back to a tweet from October 27, Egrag had demarcated significant price zones, highlighting the “$0.54 to $0.58” range as a make-or-break threshold. Beyond this, he indicated the “$0.63-$0.70” range as a pivotal indicator of market sentiment shifts.

For those with an eye on the psychological dimensions of trading, Egrag’s mention of the “0.93-$1” bracket is noteworthy. He cautioned traders about this zone, advising them to “Stick to your plan and resist the temptation to let emotions or impatience dictate your actions.”

In sum, Egrag’s comprehensive analysis blends technical data with trader sentiment and psychology, providing a nuanced and detailed perspective for those invested in XRP. The coming days are likely to be watched with bated breath as traders anticipate the next big move.

At press time, XRP traded at $0.5595.

XRP price