Ethereum Deposits At 4-Month High: Whales Preparing For Selloff?

On-chain data shows that the Ethereum exchange netflow recently spiked significantly, a sign that could be bearish for the cryptocurrency’s price.

Ethereum Exchange Netflow Registered A Large Positive Spike Recently

In a new post on X, the market intelligence platform IntoTheBlock has discussed about the latest trend that has been occurring in the exchange netflow metric for Ethereum.

The “exchange netflow” here refers to an on-chain indicator that tracks the net amount of any given cryptocurrency entering into or exiting the wallets associated with centralized exchanges.

When this metric’s value is positive, it means that investors are depositing a net number of tokens on these platforms right now. Generally, one of the main reasons holders may transfer to the exchanges is for selling-related purposes, so this trend can have bearish implications for the asset’s price.

On the other hand, the negative indicator implies the exchanges are currently bleeding supply as outflows are outpacing the inflows. Such a trend may be a sign that the investors are accumulating, which can naturally be bullish for the coin.

Now, here is a chart that shows the trend in the Ethereum exchange netflow since the start of the year 2024:

Ethereum Exchange Netflows

The graph shows that the Ethereum exchange netflow has registered a positive spike recently. At the height of this spike, the exchanges received 140,660 ETH in net deposits.

At the current price of the cryptocurrency, this amount is equivalent to almost $547 million. This is a huge amount and the largest net deposit spree these central entities have witnessed since January.

“High inflows to exchanges are typically a sign of selling behavior, as people either try to claim profits or succumb to FUD,” notes the analytics firm. Interestingly, though, since these deposits have come, the asset’s price has increased.

This could suggest that either the whales making the inflows haven’t pulled the trigger on selling these coins yet, or they never planned to sell to begin with. Of course, it’s also possible that the market demand has been able to absorb the selling if the whales have indeed sold.

In the scenario where the whales made the deposits with the intention of selling but haven’t made the trade yet, Ethereum could feel a bearish effect.

It now remains to be seen how the cryptocurrency’s price will develop in the coming days and if these large deposits will play any visible role at all.

ETH Price

Ethereum had seen a pullback earlier, but the asset has managed to make a recovery, as its price is now once again floating above the $3,900 mark.

Ethereum Price Chart

While Ethereum Shines, Top Analyst Reveals His Best ‘Under-Radar’ Altcoin

In a recent post on X, renowned crypto analyst Alex Wacy outlined his perspectives on the current state of the crypto market and his top pick for an “under-the-radar” altcoin following the recent price surge of Ethereum. Despite its position as the 9th largest cryptocurrency by market capitalization, Wacy remains bullish on the potential of Toncoin (TON), a third-generation blockchain.

“Altseason is coming while Ethereum shines. Now is the time to pick your biggest bets with high conviction. L1s are about to boom, and here is my under-radar pick!” Wacy declared. He emphasized the significance of Layer 1 (L1) and Layer 2 (L2) blockchains as foundational elements for mass crypto adoption, due to their role in supporting various projects and infrastructure. “Watching various projects, one realizes that L1 is the most clear and simple thesis for retail,” he added.

TON, originally developed by the Telegram team and later transitioned to an independent developer community, is recognized for its high performance and scalability. One of its standout features is its deep integration with the Telegram messaging app, which boasts over 900 million monthly active users. This integration is seen as a crucial lever for widespread crypto adoption.

In terms of recent achievements, the TON ecosystem has shown remarkable growth. The blockchain’s Total Value Locked (TVL) has increased fifteenfold in the last three months, and the price of TON has tripled. This surge is accompanied by a flurry of positive developments and new listings.

One notable project within the TON ecosystem is Notcoin (NOT), a Web3 gaming project that has quickly gained traction. Since its launch earlier this year, Notcoin has attracted a vast user base, reaching 35 million players who engage with the game to mine tokens.

These tokens were recently converted into NOT coins and listed on exchanges. “On May 16, the day of the listing, approximately 13 million unique Notcoin users received NOT, making it the largest meme token by number of holders,” Wacy highlighted. Remarkably, NOT is outpacing all other memecoins like DOGE (4.8 million holders), SHIB (1.4 million holders), BONK (720,000 holders) and PEPE (220,000 holders).

Further bolstering TON’s appeal, the blockchain recently introduced the native support of USDT (Tether), providing an accessible platform for Telegram’s massive user base to engage in peer-to-peer payments. This development aligns with TON’s strategy to facilitate seamless integration of Web3 services into everyday activities.

Wacy also shed light on the Open League, a long-term incentive program designed to foster competition and collaboration among TON projects. The program, now in its third season, distributes millions of Toncoin to participants, boosting ecosystem engagement.

In addition, the STON.fi decentralized exchange (DEX) on TON has emerged as a leader in terms of ease of use and integration. Its USDT/TON pool recently surpassed $100 million in TVL, only four weeks after the launch of USDT on the network. “The TON/USDt pool is currently boosted with 105% APY, attracting significant investments,” Wacy noted, mentioning a recent funding round led by CoinFund among other investors.

As the TON ecosystem continues to expand and evolve, it is clear that its combination of technological innovation, strategic partnerships, and community engagement positions it as a formidable player in the blockchain space. Alex Wacy’s endorsement underscores the potential for TON to lead the market on the back of an altcoin season sparked by the recent rise of Ethereum.

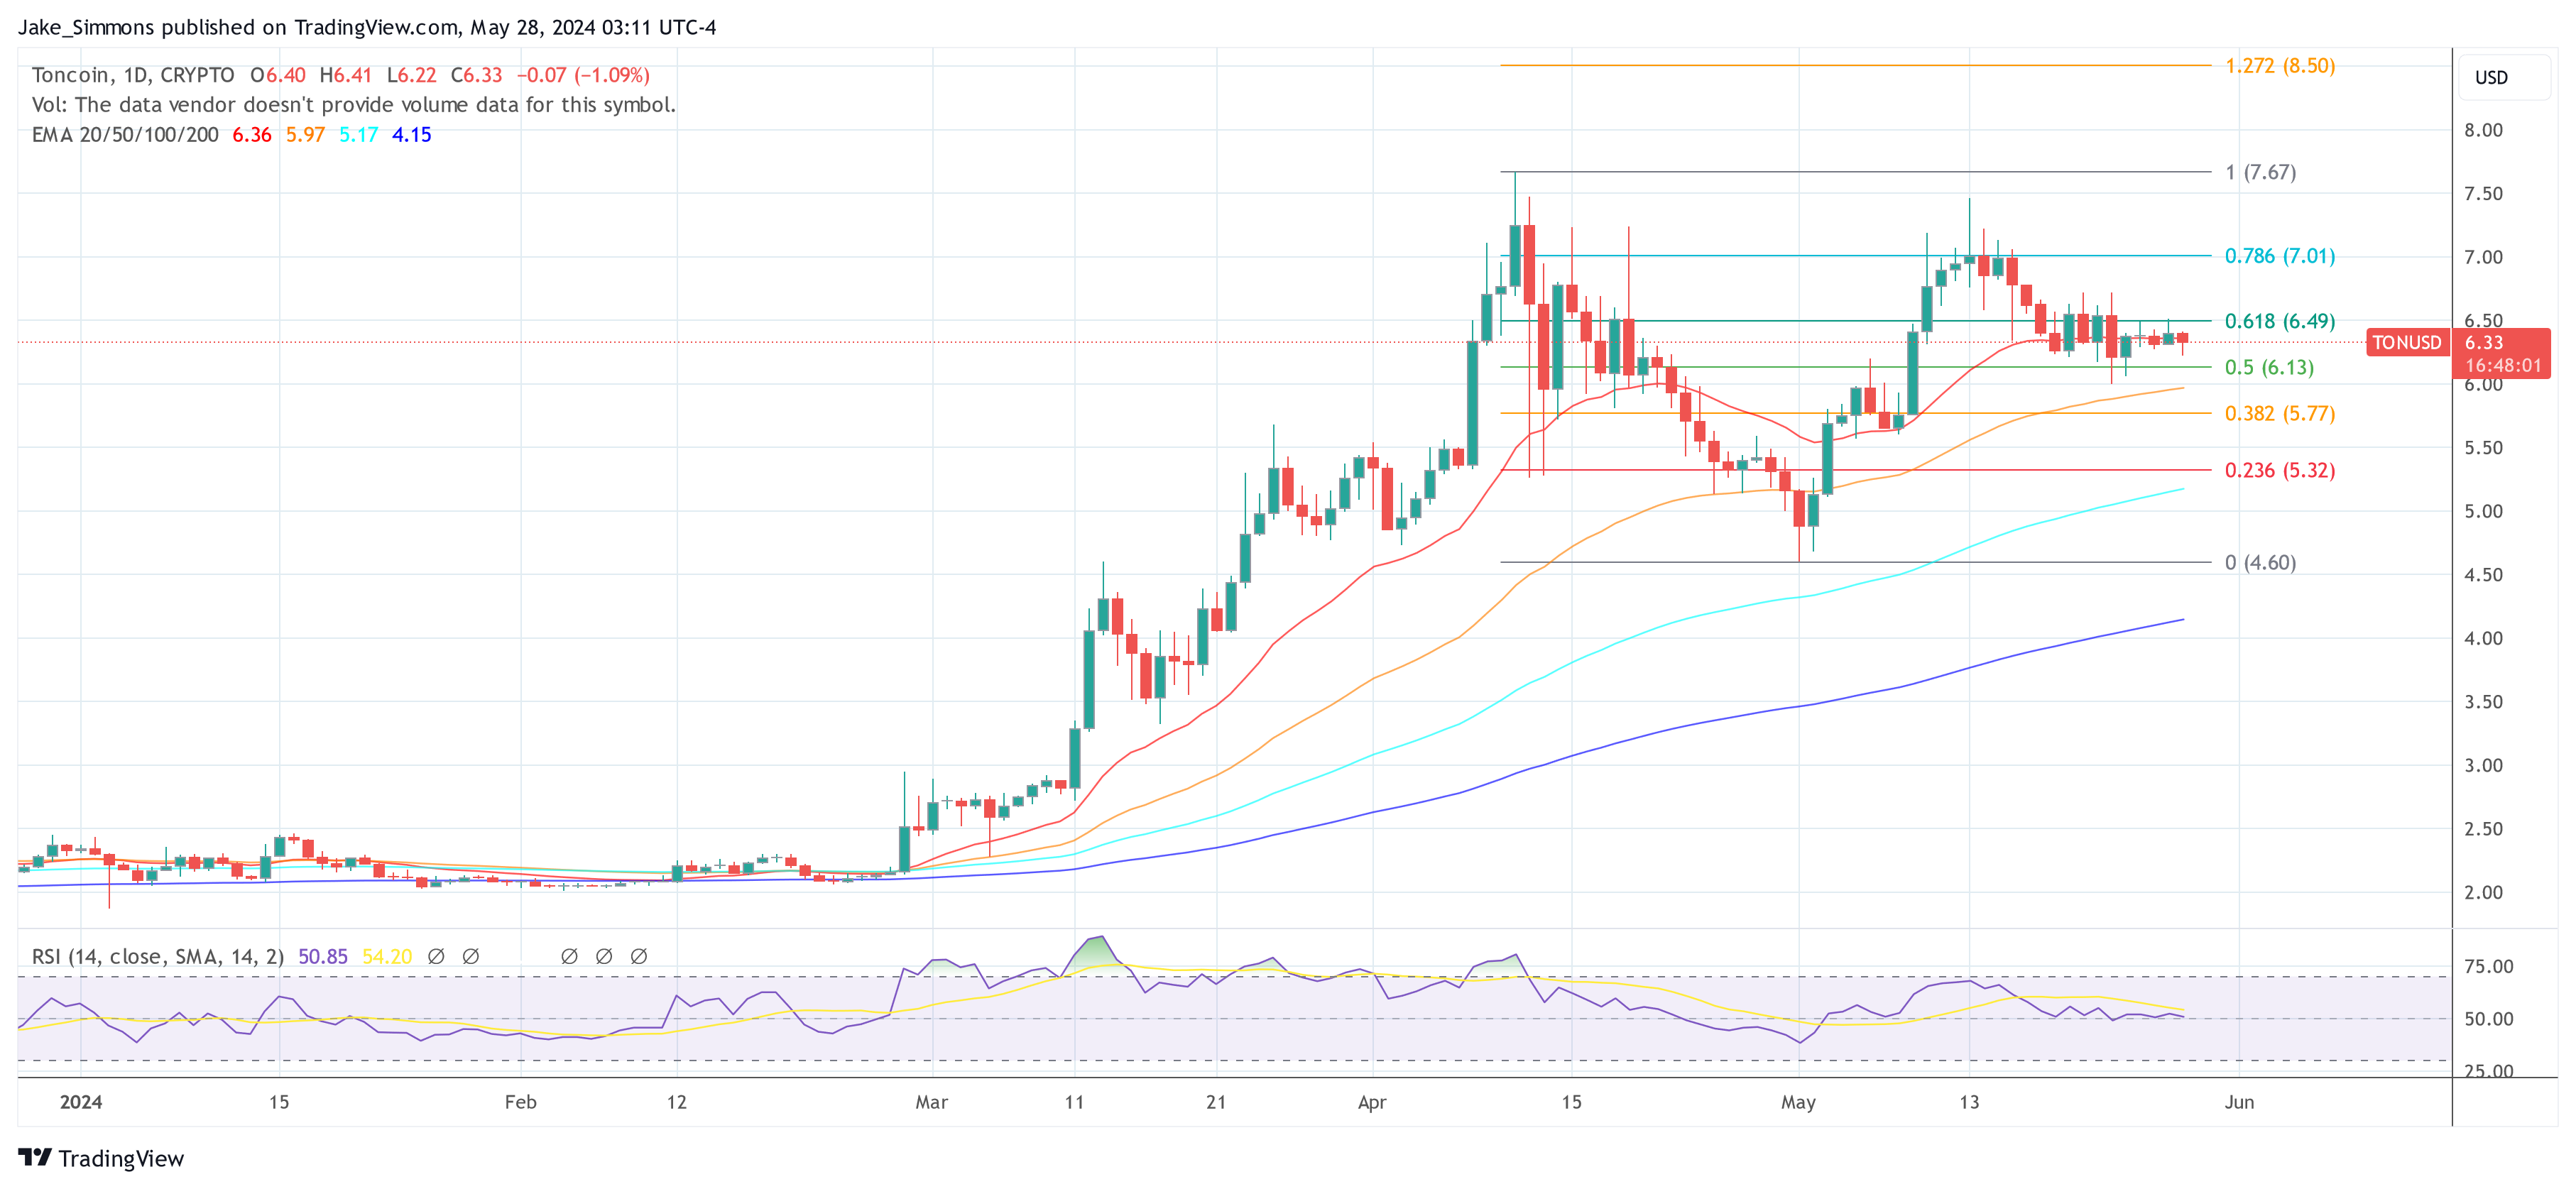
At press time, TON traded at $6.33.

Toncoin TON price

Ethereum Price Continues Its Climb: Bullish Momentum Drives Higher Gains

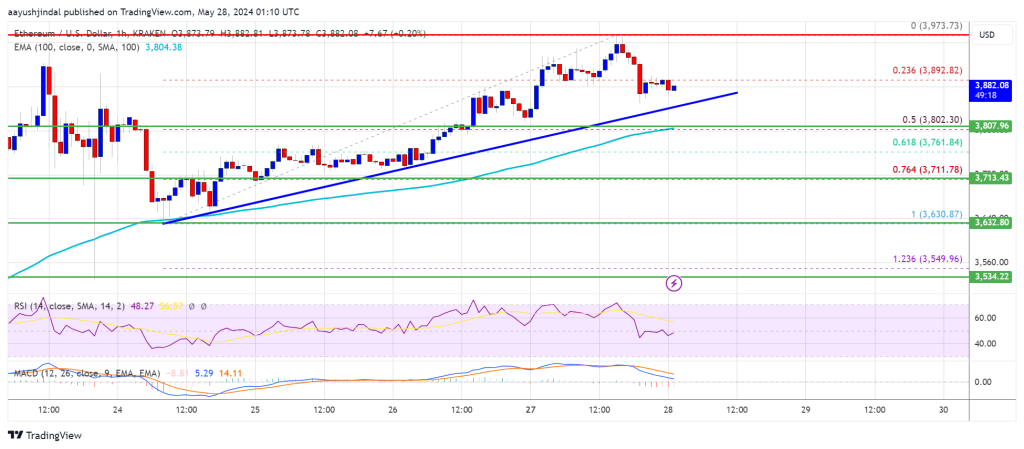
Ethereum price extended its increase above the $3,900 resistance. ETH is now consolidating near $3,880 and might continue to grind higher in the near term.

  • Ethereum started another increase above the $3,850 resistance.
  • The price is trading above $3,850 and the 100-hourly Simple Moving Average.
  • There is a major bullish trend line forming with support at $3,860 on the hourly chart of ETH/USD (data feed via Kraken).
  • The pair could continue to move up and test the $4,000 resistance zone in the near term.

Ethereum Price Eyes $4,000

Ethereum price remained supported above the $3,650 support zone. ETH started another increase, outperformed Bitcoin, and climbed above the $3,750 level.

There was a move above the $3,850 resistance. The bulls pushed the price above the $3,940 resistance. It traded close to the $4,000 resistance. A high was formed near $3,973 and the price is now correcting gains. There was a minor decline below the $3,920 level.

The price dipped below the 23.6% Fib retracement level of the upward move from the $3,630 swing low to the $3,973 high. Ethereum price is trading above $3,850 and the 100-hourly Simple Moving Average. There is also a major bullish trend line forming with support at $3,860 on the hourly chart of ETH/USD.

Immediate resistance is near the $3,940 level. The first major resistance is near the $3,970 level. An upside break above the $3,970 resistance might send the price higher. The next key resistance sits at $4,000, above which the price might gain traction and rise toward the $4,080 level.

Ethereum Price

If there is a clear move above the $4,080 level, the price might rise and test the $4,220 resistance. Any more gains could send Ether toward the $4,350 resistance zone.

Another Decline In ETH?

If Ethereum fails to clear the $3,940 resistance, it could continue to move down. Initial support on the downside is near the $3,860 level and the trend line.

The next major support is near the $3,800 zone or the 50% Fib retracement level of the upward move from the $3,630 swing low to the $3,973 high. A clear move below the $3,800 support might push the price toward $3,720. Any more losses might send the price toward the $3,630 level in the near term.

Technical Indicators

Hourly MACDThe MACD for ETH/USD is losing momentum in the bullish zone.

Hourly RSIThe RSI for ETH/USD is still above the 50 zone.

Major Support Level – $3,800

Major Resistance Level – $3,940

DeFiance Capital Foresees ETH Soaring To $4,500 Pre-Ethereum ETF Trading

As the US Securities and Exchange Commission (SEC) approved all the spot Ethereum ETF applications, despite increased regulatory uncertainty surrounding the cryptocurrency, investors are becoming more optimistic about the potential for ETH’s price to reach new heights. 

Bullish Sentiment Surrounds Ethereum ETF Approval 

DeFiance Capital Founder and CIO Arthur Cheong predicts that ETH could reach an annual high of $4,500 before the newly approved index funds begin trading, surpassing its mid-March high of $4,096. This projection falls just short of ETH’s all-time high of $4,878 during the 2021 bull run.

In addition, a survey conducted by WuBlockchain in the Chinese community revealed that 58% of respondents believe that ETH has the potential to rise to $10,000 or even higher in this market cycle. 

The recent regulatory pivot by the SEC towards approving Ether ETFs has intensified bets on further price gains. In the seven days following the announcement, ETH experienced a 26% surge, marking the largest weekly advance since the 2021 crypto bull market

This development brings hope to speculators, considering the success of US spot Bitcoin ETFs, which have amassed $59 billion in assets since their record-breaking debut in January. 

However, spot Ethereum ETFs will not participate in staking, earning rewards by pledging tokens to maintain the Ethereum blockchain. This omission could potentially dampen interest in these funds in comparison to holding the tokens directly.

Although additional SEC approvals are required before issuers such as BlackRock and Fidelity Investments can launch their products, the timeline for these releases remains uncertain. As of now, ETH is trading around $3,900, with expectations of further upside potential.

Ethereum ETF

Options Bets Signal Potential Climb To $5,000

According to a Bloomberg report, analysts such as Pepperstone Group Head of Research Chris Weston believe that pullbacks in ETH are buying opportunities as the risk remains skewed to the upside. 

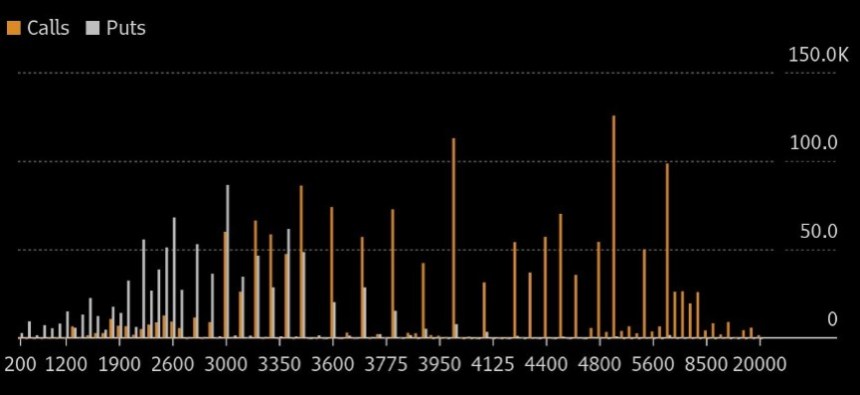
Interestingly, as seen in the chart below, some traders are placing bullish options bets, with concentrations signaling a potential climb to $5,000 or more.

Ethereum ETF

Furthermore, ETH’s volatility, as indicated by the T3 Ether Volatility Index, is expected to be greater than that of Bitcoin, highlighting the potential for larger price swings in the second-largest digital asset.

Insights from the futures market, particularly the level of open interest in Chicago Mercantile Exchange (CME) Ethereum futures, provide evidence of institutional demand for regulated exposure to cryptocurrencies. 

While open interest in CME Ether futures is growing, it remains significantly lower than that of CME Bitcoin futures. This suggests relatively less institutional exposure to Ether and could potentially impact initial inflows into Ether ETFs.

Nevertheless, as the approval of Ethereum ETFs opens up new avenues for investment and speculation, the market is closely watching ETH’s price performance, with bullish sentiment and optimistic predictions prevailing among investors.

Featured image from Shutterstock, chart from TradingView.com

Altcoin Season Soon? Quant Says This Ethereum Pattern Could Suggest So

A quant has explained how a pattern currently forming in the Ethereum Open Interest could imply the altcoin season is coming “sooner than expected.”

Altcoin Season May Be Approaching Soon Based On Ethereum Pattern

In a CryptoQuant Quicktake post, an analyst has discussed about why an altcoin season may be coming soon for the cryptocurrency sector, based on a trend taking place in a couple of Ethereum and Bitcoin indicators.

The first metric of relevance here is the “Open Interest,” which keeps track of the total amount of derivatives positions related to a given asset currently open on all centralized exchanges.

When the value of this metric goes up, it means the speculators are opening up fresh positions for the coin right now. On the other hand, a decline implies the users are either closing up their positions of their own volition or getting forcibly liquidated by their platform.

Now, here is a chart that shows how the trend in the Open Interest has compared between Bitcoin and Ethereum over the past year:

Ethereum & Bitcoin Open Interest

As displayed in the above graph, the Bitcoin Open Interest has been moving more or less sideways recently, while at the same time, the metric has registered growth for Ethereum.

This would suggest that ETH has been seeing more appetite for derivatives market contracts than the original cryptocurrency recently. One of the driving factors behind this could be the news cycle related to the approval of the spot exchange-traded funds (ETFs) for the asset.

In the same chart, the quant has also attached the data for another indicator: the Estimated Leverage Ratio (ELR). This metric measures the ratio between the Open Interest and the Exchange Reserve for any asset. The latter is naturally the total amount of the coin that’s currently sitting in the wallets of all centralized exchanges.

The ELR basically provides us with information about the amount of leverage that the average user in the derivatives market is opting for right now. From the graph, it’s visible that this ratio has seen a surge for Ethereum recently but has been showing flat action for Bitcoin.

Thus, it would appear that not only has ETH been seeing more speculative interest than BTC recently, but also these users opening contracts are going for higher risk as they are taking on more leverage.

The analyst believes that the fact that Ethereum has overtaken Bitcoin in these indicators could be a potential sign that an altcoin season may be approaching soon.

“If Ethereum’s price continues to consolidate in the current range, it’s very possible that the altcoin season will start sooner than expected,” notes the quant. It now remains to be seen how things play out in the market in the near future, given this shift of trend.

ETH Price

After seeing a slowdown earlier, Ethereum has been back on track in the past couple of days as its price has now climbed back above the $3,900 level.

Ethereum Price Chart

Ethereum Price Sets Sights on New Peaks: Anticipating a Bullish Breakout

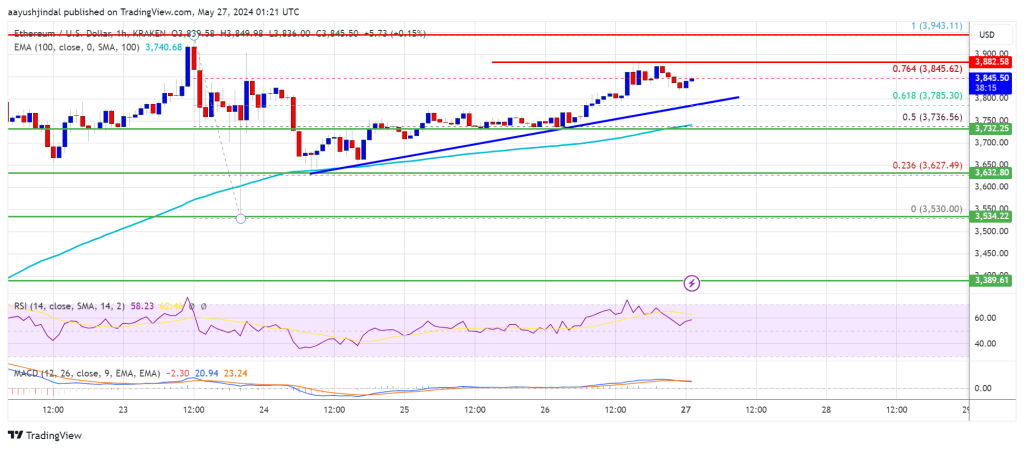
Ethereum price is again moving higher above the $3,800 resistance. ETH is now consolidating near $3,850 and is eyeing an upside break above $4,000 in the near term.

  • Ethereum started a fresh increase above the $3,750 resistance.
  • The price is trading above $3,750 and the 100-hourly Simple Moving Average.
  • There is a key bullish trend line forming with support at $3,780 on the hourly chart of ETH/USD (data feed via Kraken).
  • The pair could continue to move up unless there is a break below the $3,540 support.

Ethereum Price Remains Supported for More Upsides

Ethereum price remained stable above the $3,540 support zone. ETH formed a base, outperformed Bitcoin, and started another increase above the $3,650 level.

There was a move above the $3,750 resistance. The bulls pushed the price above the 50% Fib retracement level of the downward move from the $3,944 swing high to the $3,530 low. There is also a key bullish trend line forming with support at $3,780 on the hourly chart of ETH/USD.

Ethereum price is trading above $3,750 and the 100-hourly Simple Moving Average. It is also above the 76.4% Fib retracement level of the downward move from the $3,944 swing high to the $3,530 low.

Immediate resistance is near the $3,880 level. The first major resistance is near the $3,920 level. An upside break above the $3,920 resistance might send the price higher. The next key resistance sits at $4,000, above which the price might gain traction and rise toward the $4,080 level.

Ethereum Price

If there is a clear move above the $4,080 level, the price might rise and test the $4,220 resistance. Any more gains could send Ether toward the $4,350 resistance zone.

Another Drop In ETH?

If Ethereum fails to clear the $3,880 resistance, it could start another downside correction. Initial support on the downside is near the $3,800 level and the trend line.

The next major support is near the $3,735 zone. A clear move below the $3,735 support might push the price toward $3,630. Any more losses might send the price toward the $3,540 level in the near term.

Technical Indicators

Hourly MACDThe MACD for ETH/USD is gaining momentum in the bullish zone.

Hourly RSIThe RSI for ETH/USD is still above the 50 zone.

Major Support Level – $3,800

Major Resistance Level – $3,880

Ethereum Price Consolidates: Here Are The Next Key Levels To Watch

Over some days, the price of Ethereum has been in a consolidation zone, moving between $3,949 and $3,627. This is a result of the rally that happened a few days ago which led to the crypto asset’s price making over 10% movement on the upside. 

When prices are consolidating, it can only be considered that it is building momentum to either break above the consolidation zone or below it. At this point, we cannot tell the next action the price will take.

In this article, we will see the possible outcome if there is a break out from the consolidation. As of the time of writing, the price of ETH was up by 0.66%, trading around $3,752 above the 100-day Simple Moving Average (SMA) in the last 24 hours.

Ethereum On The 4-Hour Chart

Looking at Ethereum’s chart on the 4-hour timeframe, it can observed that the price is trading above the 100-day moving average, suggesting ETH’s price is on a bullish trend and could break above the consolidation zone.

Ethereum

Also, with the help of the MACD indicator, although the MACD histograms are trending below the MACD zero line, these are already showing signs of weakness as the histogram color is becoming faint.

The MACD line and the MACD signal line are also seen moving toward the MACD zero line but as long as they are still above the zero line, there could be a possible reverser.

With this MACD formation, it could be suggested that the price of Ethereum is still bullish and there is a possibility it could break above the consolidation zone

Finally, using the Relative Strength Index (RSI) also to analyze the price action in the 4-hour timeframe, it can be seen that the RSI line is attempting to back up after failing to cross below the 50 lines, suggesting that the price is still bullish.

Ethereum

Possible Outcomes If There Is A Breakout In Either Direction

Conclusively, if there is a break out above the consolidation zone, the price of ETH might continue to move upward toward the $4,094 resistance level. Should the price surpass this resistance level, it might move further upward to create a new high for the year.

On the contrary, if Ethereum breaks below the consolidation zone, the price might begin to move toward the $3,263 support level. A breakout below this level might cause a continuous downward movement toward the $2,864.04 support level.

Ethereum

Lido (LDO) Takes The Lead With 13% Surge Post Ethereum ETF Approval – Key Levels To Watch

Lido (LDO), the liquid staking protocol for the Ethereum (ETH) and Polygon (MATIC) blockchains, has seen a significant price spike in the last 24 hours following the long-awaited approval of spot Ethereum ETF applications by the US Securities and Exchange Commission (SEC) on Thursday.

The protocol’s native token, LDO, has successfully regained the $2.30 level and is looking to break out of its one-month downtrend structure that has been in place since the market correction in April. 

LSD Sector Set To Soar With Ethereum ETF Approval?

As reported by our sister website, Bitcoinist, the SEC’s approval of the Ethereum ETFs was detailed in an official filing, highlighting that the proposals meet the provisions of the Exchange Act and relevant regulations governing national securities exchanges. 

The Commission has determined that proposals from notable entities such as BlackRock, Grayscale, Bitwise, VanEck, Ark Invest/21Shares, Invesco Galaxy, Fidelity, and Franklin Templeton fulfill the requirements to prevent fraud and manipulation, protect investors, and safeguard the public interest.

Crypto analyst Daan Crypto Trades, commenting on the Ethereum ETF approval on X (formerly Twitter), pointed out that the new index funds approval has led to two sectors emerging as clear winners. 

One of these sectors is Liquid Staking Derivatives (LSD) coins, with Lido at the forefront. Lido provides staking support for the Ethereum blockchain without the need to lock tokens or maintain infrastructure, allowing participants to engage in on-chain activities such as lending and farming.

Key Levels To Watch For Lido

During the early hours of Friday, LDO reached a peak of $2.49 but has since retraced to its current trading price of $2.35. Large investors are interested in the token, as Spot On Chain data reveals that six fresh wallets/whales withdrew 4.3 million LDO ($9.59 million) from crypto exchange Binance over the past 24 hours. 

This indicates a growing interest in holding the token, as sentiment suggests a potential increase in price parallel to Ethereum once the newly approved index funds for the second-largest cryptocurrency enter the market in the coming months.

Moreover, CoinGecko data shows that Lido has experienced a trading volume of $350 million within the last 24 hours, marking a 78.60% increase compared to Thursday’s. However, the token remains 68% below its all-time high (ATH) of $7.30, achieved during the 2021 bull market.

Lido

Looking ahead, bullish investors should closely observe the next resistance level on the LDO/USD daily chart, situated at $2.55. Breaking this level is crucial for breaking the downtrend structure that has persisted over the past month, potentially leading to retests at $2.70 and $2.90.

Conversely, the $2.21 zone serves as a significant support level, as it acted as a strong barrier for Lido in the past week and a half before the breakout.

Featured image from Shutterstock, chart from TradingView.com 

Post-Ethereum ETF Analysis: ETH Price Seeks Bottom As Bulls Eye $5,000 Target

The recent approval of the Ethereum ETF applications by the US Securities and Exchange Commission (SEC) on Thursday has sparked speculation on the next price movements for the market’s second-largest cryptocurrency as the trading launch date approaches. 

However, significant transfers of Ethereum (ETH) to cryptocurrency exchanges have raised concerns about profit-taking, portfolio rebalancing, and potential market speculation. 

Sell-Off Amidst Ethereum ETF Greenlight?

According to crypto analyst Ali Martinez, these developments coincide with Ethereum founder Jeffrey Wilke transferring 10,000 ETH, valued at approximately $37.38 million, to the cryptocurrency exchange Kraken. 

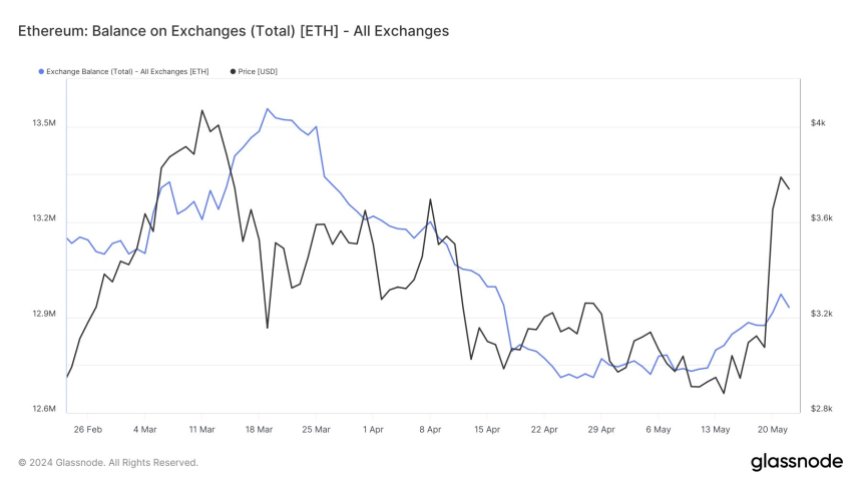
Furthermore, the surge in Ethereum balances on cryptocurrency exchanges indicates a notable increase in tokens available for sale. 

The chart below shows that more than 242,000 ETH have been transferred to cryptocurrency exchange wallets over the past two weeks, signaling increased trading activity that can contribute to price volatility. 

Ethereum ETF

This trend, coupled with Wilke’s transfer, suggests the possibility of a sell-off or an increase in profit-taking among market participants.

While industry experts like Anthony Pompliano view the Ethereum ETF approval as a positive sign for the entire industry, traders are advised to exercise caution. For Martinez, the growing number of ETH deposits to exchange wallets implies a potential market reaction characterized by profit-taking or selling pressure. 

Additionally, the analyst notes that the Tom DeMark (TD) Sequential indicator has presented a sell signal on Ethereum’s daily chart, indicating the potential for a retracement or a new downward countdown phase before the upward trend resumes.

Ethereum’s Price Outlook In Focus

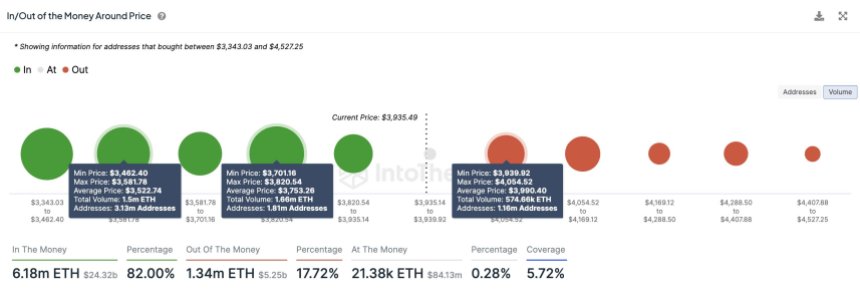
Diving into the price analysis, considering the IOMAP (Input-Output Model and Profitability) data, Martinez highlights that Ethereum has a strong demand zone between $3,820 and $3,700, where over 1.81 million addresses bought approximately 1.66 million ETH. 

Ethereum ETF

This range could provide support amid increasing selling pressure. However, if this zone fails to hold, the next key area of support lies between $3,580 and $3,462, where 3.13 million addresses acquired over 1.50 million ETH.

On the upside, Ethereum’s most significant resistance barrier is between $3,940 and $4,054, with over 1.16 million addresses purchasing around 574,660 ETH. 

Martinez suggests that a daily candlestick close above $4,170 would invalidate the bearish outlook and potentially trigger a new upward countdown phase, with a target towards $5,000.

Ethereum ETF

As of this writing, ETH’s price is $3,719, reflecting a 2.5% retracement over the past 24 hours. However, according to the analyst’s assessment, Ethereum remains within a crucial demand zone. 

As the market approaches the launch and commencement of trading for all eight spot Ethereum ETF applications by the world’s largest asset managers, the exact impact on price action is yet to be fully realized.

Featured image from Shutterstock, chart from TradingView.com

Analyst Says Ethereum Spot ETFs Approval Will See “Animal Spirits” Reignite Crypto – What This Means

A crypto analyst has made a rather cryptic prediction, suggesting that the approval of Ethereum Spot ETFs by the United States Securities and Exchange Commission (SEC) could unleash a new wave of “animal spirits.” This term in crypto is often used to describe an irrational exuberance and optimism that fuels financial markets. 

Ethereum Spot ETF To Reignite Animal Spirits

In an X (formerly Twitter) post on May 22, a crypto analyst identified as “the DeFi Villain,” made a bold forecast, anticipating the resurgence of the bull run altcoin season following the SEC’s approval of Ethereum Spot ETF. The analyst revealed that the approval could let loose “animal spirits,” driving renewed demand and positive sentiment in the market and possibly resulting in a bull market. 

The analyst outlined a long list of altcoins that outperformed and experienced remarkable rallies in 2021. These rallies propelled each of their market capitalizations from mere hundreds of millions to billions in the span of a few days and months. 

Among the cryptocurrencies highlighted by DeFi Villain, some notable altcoins recorded a massive rise in market capitalization, including Dogecoin (DOGE), THORChain (RUNE), Filecoin (FIL), Binance Coin (BNB), Axie Infinity (AXS), Shiba Inu (SHIB), and others.

According to the crypto analyst, Dogecoin witnessed a 10x increase in one day, in January 2021. While RUNE market capitalization surged from $200 million to $5 billion in just five months. 

One of the most remarkable increases was seen in Filecoin which almost reached the current market capitalization of Ethereum. The cryptocurrency had jumped close to a whopping $400 billion during the altcoin bull run in 2021. 

Other cryptocurrencies like AXS surged from a market capitalization of $200 million to $10 billion, with its Fully Diluted Value (FDV) topping $43 billion at some point. Additionally, Binance Coin, which was already worth $6 billion in early 2021 and among the top 20 cryptocurrencies, had witnessed a mega 8x pump in 20 days, reaching a staggering $50 billion in February 2021. 

Even popular meme coins like Shiba Inu (SHIB) had rallied hard, jumping from $4 billion to $40 billion in less than a month. Ethereum Cash (ETC) also saw its market capitalization rise from $600 million to $17 billion in five months.

These massive surges during the 2021 bull run underscore the potential altcoins have on the crypto market and how insane they can surge once the altcoin season hits and the dominance for Bitcoin shifts to lesser cryptocurrencies. 

DeFi Villain has predicted that the final leg for meme coins is likely going to be “Vertical and Brutal,” suggesting that these volatile cryptocurrencies could have another powerful rally to new highs this market cycle. 

ETF Approval Nullifies SEC’s Previous Security Claims?

Over the past few months, the US SEC has made claims implying that Ethereum, the second largest cryptocurrency, was considered a security. However following the authorization of Ethereum Spot ETFs, the SEC has finally recognized Ethereum as a non-security. 

Calling the regulator out on this contradiction, Paul Grewal, Chief Legal Officer (CLO) of Coinbase disclosed that if Ethereum which lacks “contractual agreement or undertaking,” is no longer considered a security by the SEC, then Bitcoin (BTC), which operates similarly without the above agreements, should also be a non-security.

Grewal posed a compelling question regarding the classification of 12 other cryptocurrencies, which can be compared to Ethereum and Bitcoin in terms of their non-security treatment by the SEC. The Coinbase CLO disclosed that the implications that these 12 other cryptocurrencies are considered securities despite also lacking contractual agreement or undertaking raises the question about the SEC’s possible lack of regulatory clarity and inconsistent regulatory approach to different crypto assets

Ethereum price chart from Tradingview.com

Ethereum Undergoes Major Breakout, Path To New All-Time High?

Ethereum has yet to witness a move on the upside today, following the historic approval of the ETH Spot Exchange-Traded Funds (ETFs). However, given the impact of the exchange funds, as seen with Bitcoin, several crypto analysts and market watchers anticipate a major rally for ETH in the upcoming months.

Joining the fray is popular cryptocurrency expert and trader Javon Marks, who has spotlighted a noteworthy breakout in the price action of Ethereum, speculating that the development may trigger a notable rally for the crypto asset.

Ethereum Breakout Signal New All-Time Highs

Marks’s prediction emphasizes the possibility that ETH could reach unprecedented price levels after the emergence of several distinct Bullish Metrics. He noted that shortly after exhibiting multiple distinct bullish metrics, ETH’s prices confirmed a major breakout. Due to this, a significant move in the upward trajectory could be underway.

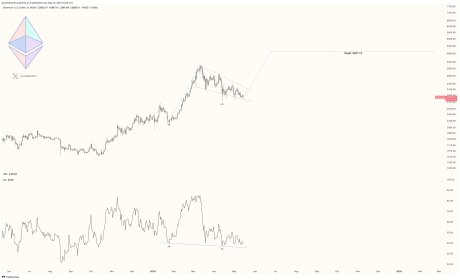
Earlier this month, Marks pointed out about four bullish metrics in the price of Ethereum. These include a Bull Flag-like price structure, Higher Lows in price action, Lower Lows in the Relative Strength Index (RSI), and Larger Upside price breakout to the $4,811 price mark.

Ethereum

Sharing insights on the Bull Flag-like pattern, Javon Marks claims a breakout could result in new all-time highs for ETH, and for the benefit of many Altcoins. However, a few days later, the analyst reported that Ethereum was getting close to the Bull Flag pattern’s breakout levels. Should a successful breakout take place, it will only kickstart the next stage of substantial growth. 

Specifically, in the event of a breakout, the price of ETH might rise by about +50% from the level then, to $4,811. Furthermore, it might potentially result in prices topping at $5,000 and setting new peaks. 

Meanwhile, less than 2 hours later the expert confirms the asset has broken out of the pattern at lightspeed and is surging in the upward direction. Thus following this breakout, ETH’s prices may be poised for another 23.4% from the current level to the aforementioned price targets, while suggesting that further growth could be on the horizon.

ETH Sees Bearish Movement

Currently, the digital asset is seeing a bearish movement after failing to break above the $4,000 mark once again. Even though the entire crypto market is experiencing a bearish momentum, a good recovery is still expected to happen soon.

Despite the approval of ETH spot ETFs, the coin has recorded a decline of over 5% in the last 24 hours. However, in the past week, ETH has amassed gains of more than 20%, showing resilience to attract more.

Its market capitalization has decreased by over 5% in the past day to $445.95 billion. Meanwhile, its trading volume is valued at $45.29 billion, indicating a more than 65% increase in the past day.

Ethereum

Ethereum Eyes $4,000 Comeback Fueled By Bullish Buying Spree

Ethereum (ETH), the world’s second-largest cryptocurrency, has been on a tear lately. After months of hovering, the coin has seen a surge in price, and analysts are now pointing to signs within the derivatives market suggesting this rally might have legs.

Taker Buy Sell Ratio Nears Equilibrium

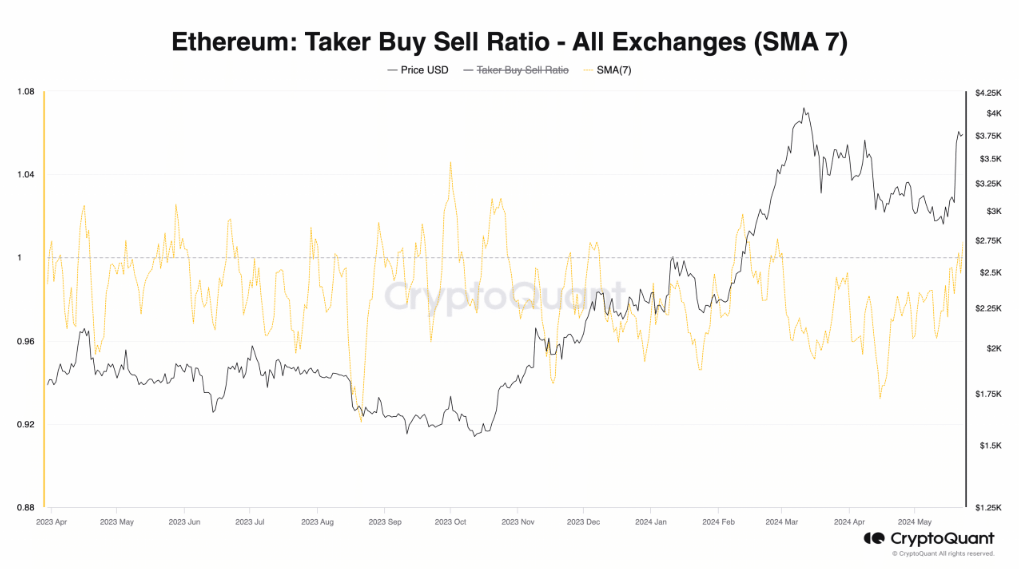
One key indicator is the Taker Buy Sell Ratio, a metric that tracks the volume of buy orders compared to sell orders in ETH’s perpetual futures market. Traditionally, a ratio below 1 suggests more sell orders are flooding the market, potentially driving the price down. Conversely, a ratio above 1 indicates a dominance of buy orders, often a bullish signal.

SEC Okays Spot Ethereum ETFs, Market Expectations Reversed

The news that the US SEC has approved spot Ethereum ETFs has caused a sharp reversal in the market’s expectations for Ethereum ETF rejection this week, and as a result, the price of Ethereum (ETH) is moving erratically in late Thursday activity.

As of right now, Ethereum was trading for about $3,770. That is both considerably higher than the previous session low of $3,500 and sharply lower than the previous session highs of over $4,000.

CryptoQuant, a leading crypto analytics platform, recently reported that ETH’s Taker Buy Sell Ratio, observed using a 7-day simple moving average, is poised to cross above its 1-center line. This signifies a decline in sell orders and a potential rise in buying pressure. This suggests that the coin may soon retake the $4,000 price level.

This upward trend in the Taker Buy Sell Ratio indicates a potential shift in market dynamics, noted ShayanBTC, a pseudonymous analyst at CryptoQuant. If the ratio continues to rise, it may signal a reduction in aggressive selling pressure, which could be a positive development for ETH’s price, ShayanBTC added.


Futures Open Interest Reaches New Highs

Another data point bolstering the bullish case comes from the Futures Open Interest metric. This metric tracks the total amount of outstanding futures contracts that haven’t been closed or settled. A rising Open Interest suggests more traders are entering new positions, potentially anticipating a price increase.

According to Coinglass, another crypto analytics platform, ETH’s Futures Open Interest has skyrocketed to a new all-time high of $16 billion. This signifies a surge in market participation, with more traders betting on ETH’s future.

The all-time high OI suggests a significant increase in investor confidence. This could be due to several factors, including growing institutional adoption of ETH and the upcoming Ethereum 2.0 upgrade.

Featured image from Explorersweb, chart from TradingView

When Spot Ethereum ETFs Go Live ‘Expect A Bloodbath’, Says Expert

Thomas Fahrer, co-founder of Apollo, a firm focused on Bitcoin adoption, has issued a stark warning regarding the potential market dynamics following the approval of spot Ethereum ETFs. As the market anticipates this new development, Fahrer suggests that the transition might not be smooth for Ethereum.

“The Grayscale Ethereum Trust launched in 2017 and accumulated most of its $9 billion dollars worth of ETH well before staking existed. These funds will be unlocked now. Expect a bloodbath. It will accelerate the ETH -> BTC Trade. Hold me to account if I’m wrong. But I doubt it,” Fahrer declared via social media platform X.

Spot Ethereum ETFs – A “Sell The News” Event?

The imminent approval of spot Ethereum ETFs, similar to earlier this year’s launch of spot Bitcoin ETFs, is expected to convert the $9 billion (approximately 2.94 million ETH) locked in Grayscale’s Ethereum Trust (ETHE) into one such ETF. Historical precedent with Bitcoin suggests potential volatility; after the approval of spot Bitcoin ETFs, Bitcoin experienced more than a 20% drop in value within 12 days amid significant sell-offs from similar conversions.

One of the main reasons the spot BTC ETF approval turned out to be a “sell the news” event was Grayscale’s transition from an Ethereum Trust to a spot ETF. Until now, Grayscale’s Bitcoin Trust (GBTC) saw outflows of more than 50% of its BTC holdings. And the ETHE could be reinforced by the fact that ETH staking is a lucrative option to earn an additional yield.

Currently, Grayscale holds over $9 billion in locked Ethereum that cannot be sold or traded until the ETF is operational. Should the approval go through, this large amount of Ethereum will suddenly become liquid, potentially leading to substantial market sell-offs if initial demand does not meet the volume of outflows from Grayscale’s new ETF.

Julio Moreno, head of research at CryptoQuant, highlighted a critical market indicator that could suggest the market has already begun to react. “Seems like the market has already priced the Ethereum spot ETF approval. Grayscale’s ETHE discount to ETH has significantly narrowed in the last few days. The same happened between GBTC and Bitcoin as the Bitcoin Spot ETF approval was nearing,” Moreno noted via X.

While the short-term impact might mirror the turbulent times seen during the Bitcoin ETF launch, the long-term implications for Ethereum could be different. Observers note that despite the initial downturns seen in Bitcoin’s valuation post-ETF, the introduction of a spot ETF was eventually beneficial, leading to greater market acceptance and a price surge.

“BTC rallied 75% in 63 days after the spot ETF was approved. If ETH follows the same trend (if approved), this would take it to $6,446 by July 23,” crypto analyst Miles Deutscher noted.

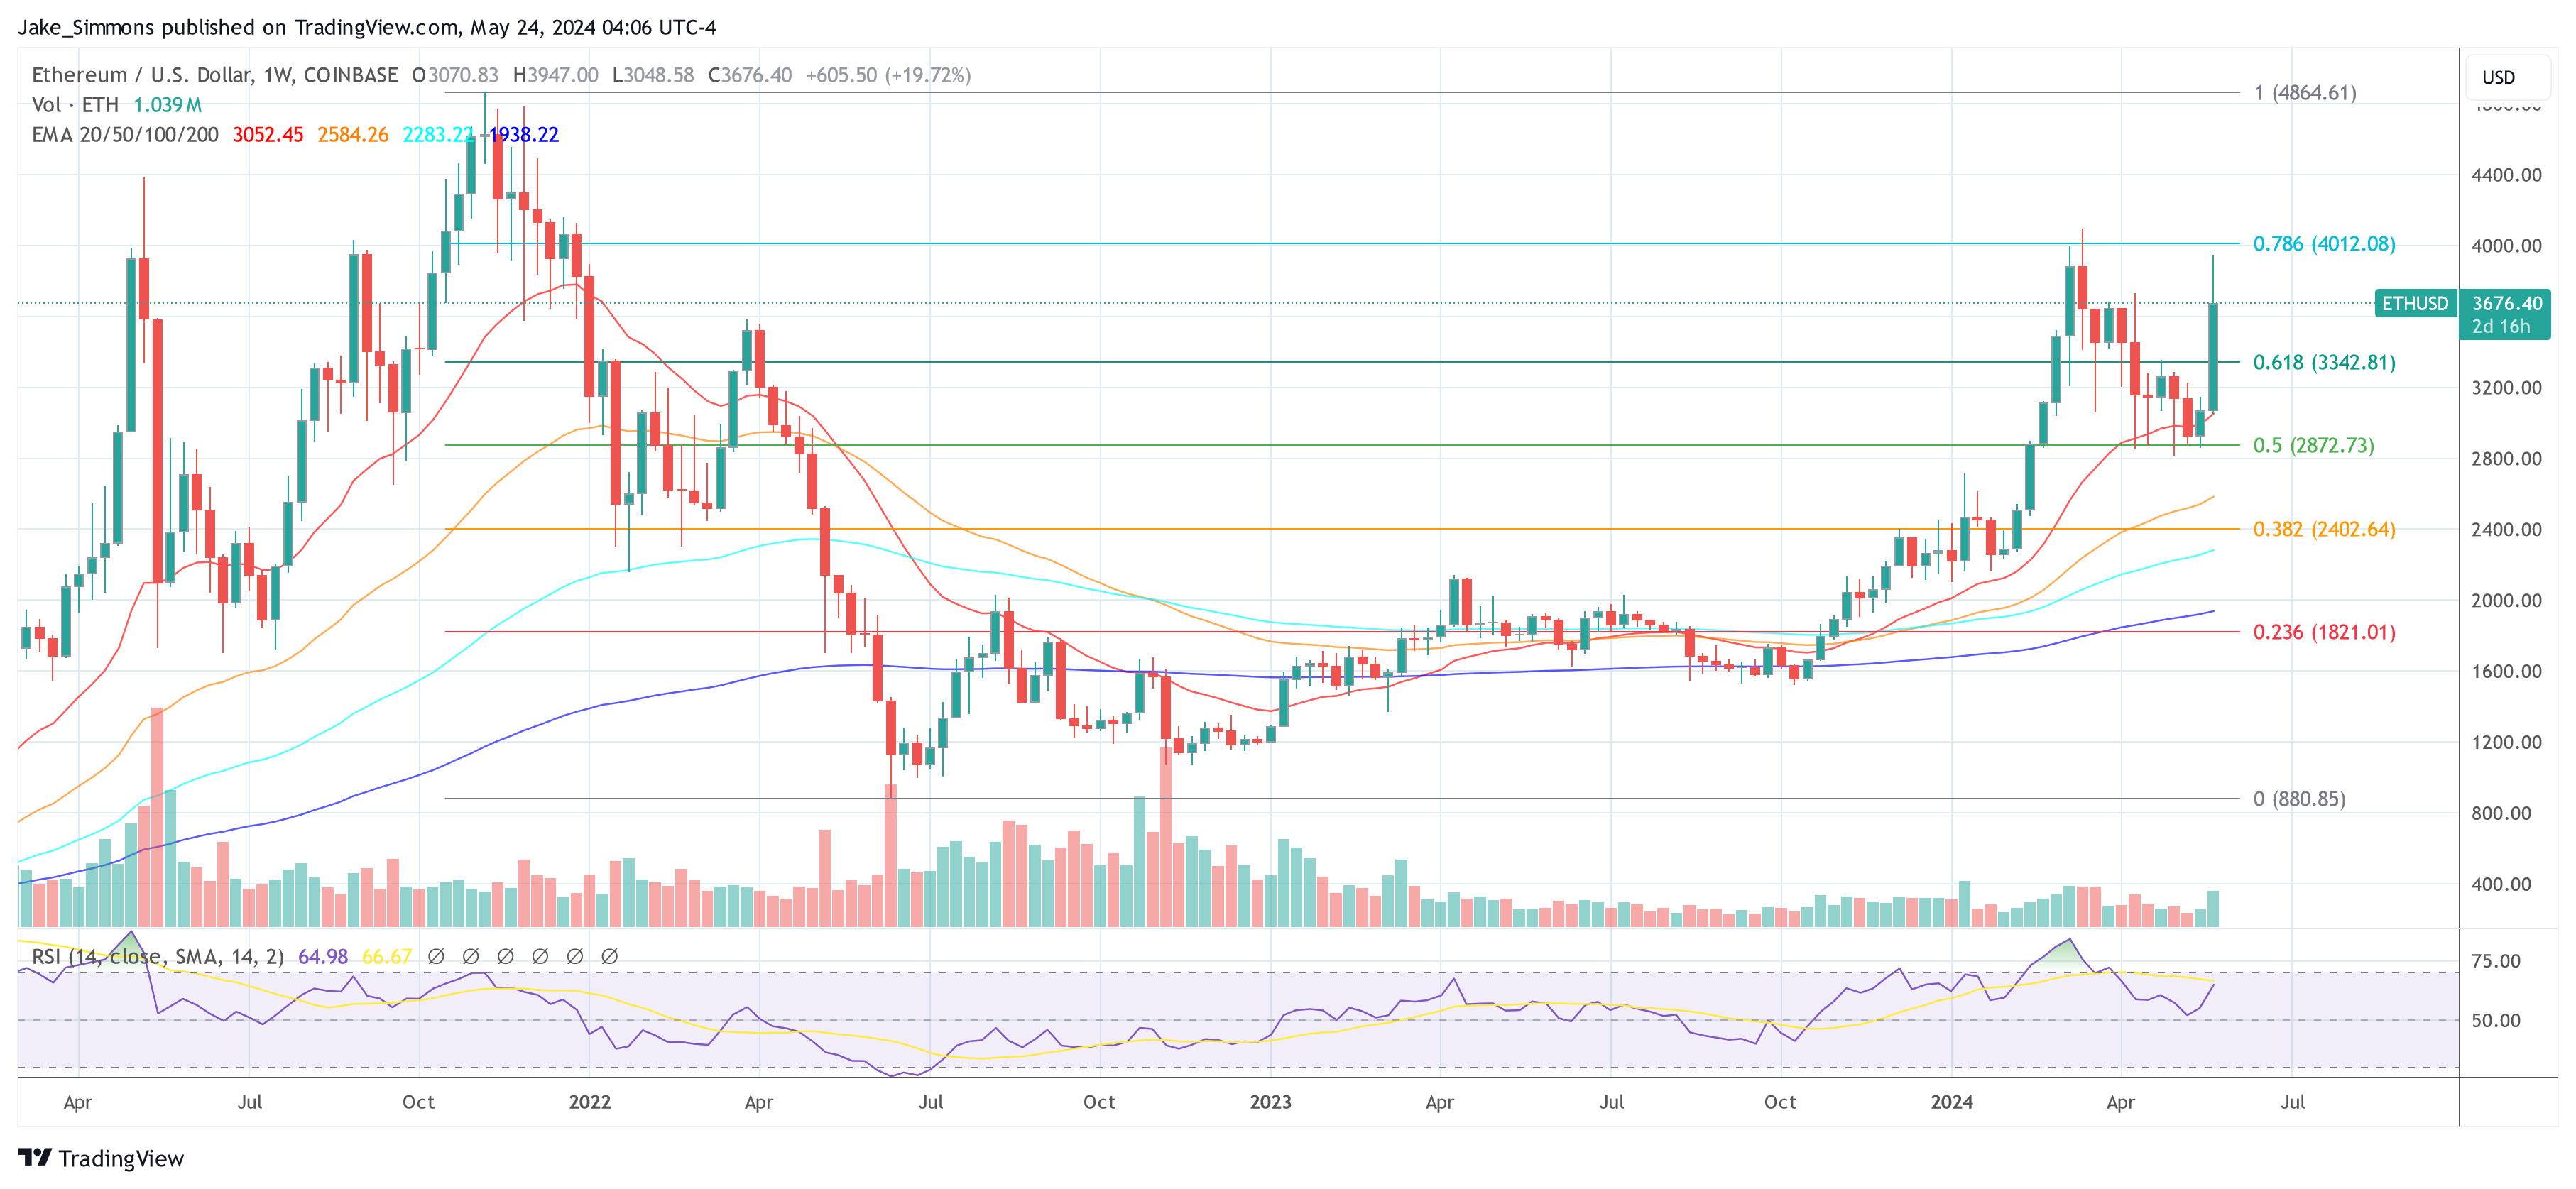
At press time, ETH traded at $3,676.

Ethereum price

FTM’s Key Support At Risk As Fantom Launches Sonic Foundation And Wraps $10M Funding

The Fantom Foundation has recently disclosed its plans to establish the Sonic Foundation and Sonic Labs in preparation for the launch of its Sonic blockchain. 

In an announcement on Thursday, the foundation expressed its commitment to leveraging its technology and revealed additional details about the upcoming developments.

Fantom Introduces Sonic Chain

According to the foundation’s blog post, with the completion of the upgrade for their Opera chain on the horizon, Fantom is directing its focus towards creating a new “high-throughput” chain called Sonic (S). 

The introduction of the Sonic network will coincide with the establishment of the Sonic Foundation, which will assume responsibility for governance and treasury management functions. Additionally, Sonic Labs will spearhead the growth of decentralized applications (dApps), partnerships, and user engagement.

Developed under the guidance of Professor Bernhard Scholz, a virtual machine developer, and led by decentralized finance (DeFi) expert Andre Cronje, the Sonic chain represents a new type of Layer-1 platform with a native Layer-2 bridge connected to the Ethereum (ETH) network.

The Sonic chain is reportedly designed to serve as a Layer 1 solution connected to Ethereum via a Layer 2 bridge. This integration is intended to allow Sonic to leverage Ethereum’s liquidity, user base, and protocols. 

As a result, the network will combine the benefits of a Layer-1 platform, such as affordability, scalability, and speed, with the security of a Layer-2 bridge, providing access to native ETH and other assets on Ethereum. 

$10 Million Raised In Strategic Funding Round

Regarding the “S” token, a recent governance vote has secured compatibility and migration between the decentralized platform’s native token FTM and S on a 1:1 basis. 

Fantom also announced the successful completion of a $10 million strategic funding round led by Hashed, one of Korea’s cryptocurrency funds. This funding initiative for the foundation is expected to expand further in the coming months. 

In addition to Hashed, UOB Ventures, Signum Capital, and Aave (AVE) Foundation, along with angel investors Stani Kulechov, Robert Leshner, Michael Egorov, Fernando Martinelli, Tarun Chitra, and Sam Kazemian, and individual partners from UOB, have all provided support during the funding round.

The capital raised in the latest round of funding will be used exclusively to support strategic growth initiatives and ecosystem development within the Fantom network, according to the foundation’s statement, which concluded by saying:

Our team is steadfast in exploring how the Sonic chain can impact and elevate several different DeFi and real-world use cases. Industries and applications such as real-world assets, perpetual DEXs, payments, trading, and high-transaction-based games, can be transformed by the speed and high throughput of Sonic.

FTM Faces Potential Downtrend Continuation

Despite these developments, the FTM token has exhibited a lackluster response to the successful funding round and the potential benefits of the Sonic chain. 

As a result, the token has declined by over 4% within a 24-hour period, putting a significant level of support for the native token at risk.

Currently trading at $0.8033, the FTM token’s immediate prospects hinge on the crucial $0.7994 support level. A breach of this support could lead to further price declines, with the next major support at $0.755.

Fantom

On the other hand, if renewed bullish momentum and increased buying pressure emerge, the token may encounter resistance at the $0.844 and $0.8750 levels before potentially retesting the key $0.9 zone. Reclaiming the $1 milestone remains pivotal for the token’s overall outlook.

Featured image from Shutterstock, chart from TradingView.com

Ethereum Price Dips, Then Rips: Exciting Trading Opportunities Ahead

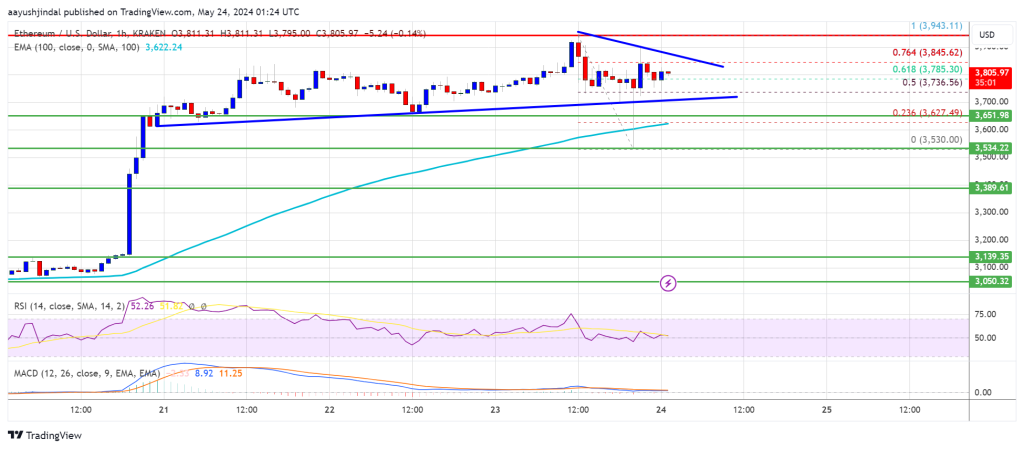
Ethereum price dipped sharply after it rallied toward $3,940. ETH is now consolidating near $3,850 and is eyeing more upsides in the near term.

  • Ethereum started a consolidation after it rallied toward the $3,940 resistance zone.
  • The price is trading above $3,720 and the 100-hourly Simple Moving Average.
  • There is a key bullish trend line forming with support at $3,720 on the hourly chart of ETH/USD (data feed via Kraken).
  • The pair could continue to move up unless there is a break below the $3,620 support.

Ethereum Price Eyes More Gains

Ethereum price extended its increase above the $3,700 and $3,750 resistance levels. ETH outperformed Bitcoin and even climbed above the $3,880 level. A new weekly high was formed at $3,943 before there was a sharp decline.

The price dived below the $3,800 and $3,750 levels. A low was formed at $3,530 level and the price recovered most losses. It is back above the 50% Fib retracement level of the downward move from the $3,943 swing high to the $3,530 low.

Ethereum is now trading above $3,720 and the 100-hourly Simple Moving Average. There is also a key bullish trend line forming with support at $3,720 on the hourly chart of ETH/USD.

Immediate resistance is near the $3,845 level or the 76.4% Fib retracement level of the downward move from the $3,943 swing high to the $3,530 low. The first major resistance is near the $3,880 level. An upside break above the $3,880 resistance might send the price higher.

Ethereum Price

The next key resistance sits at $3,940, above which the price might gain traction and rise toward the $4,000 level. If there is a clear move above the $4,000 level, the price might rise and test the $4,080 resistance. Any more gains could send Ether toward the $4,200 resistance zone.

Another Decline In ETH?

If Ethereum fails to clear the $3,840 resistance, it could start another downside correction. Initial support on the downside is near the $3,720 level and the trend line.

The next major support is near the $3,620 zone. A clear move below the $3,620 support might push the price toward $3,550. Any more losses might send the price toward the $3,390 level in the near term.

Technical Indicators

Hourly MACDThe MACD for ETH/USD is gaining momentum in the bullish zone.

Hourly RSIThe RSI for ETH/USD is still above the 50 zone.

Major Support Level – $3,720

Major Resistance Level – $3,880