Ethereum Retests Breakout Zone, Analyst Sets $3,500 Target

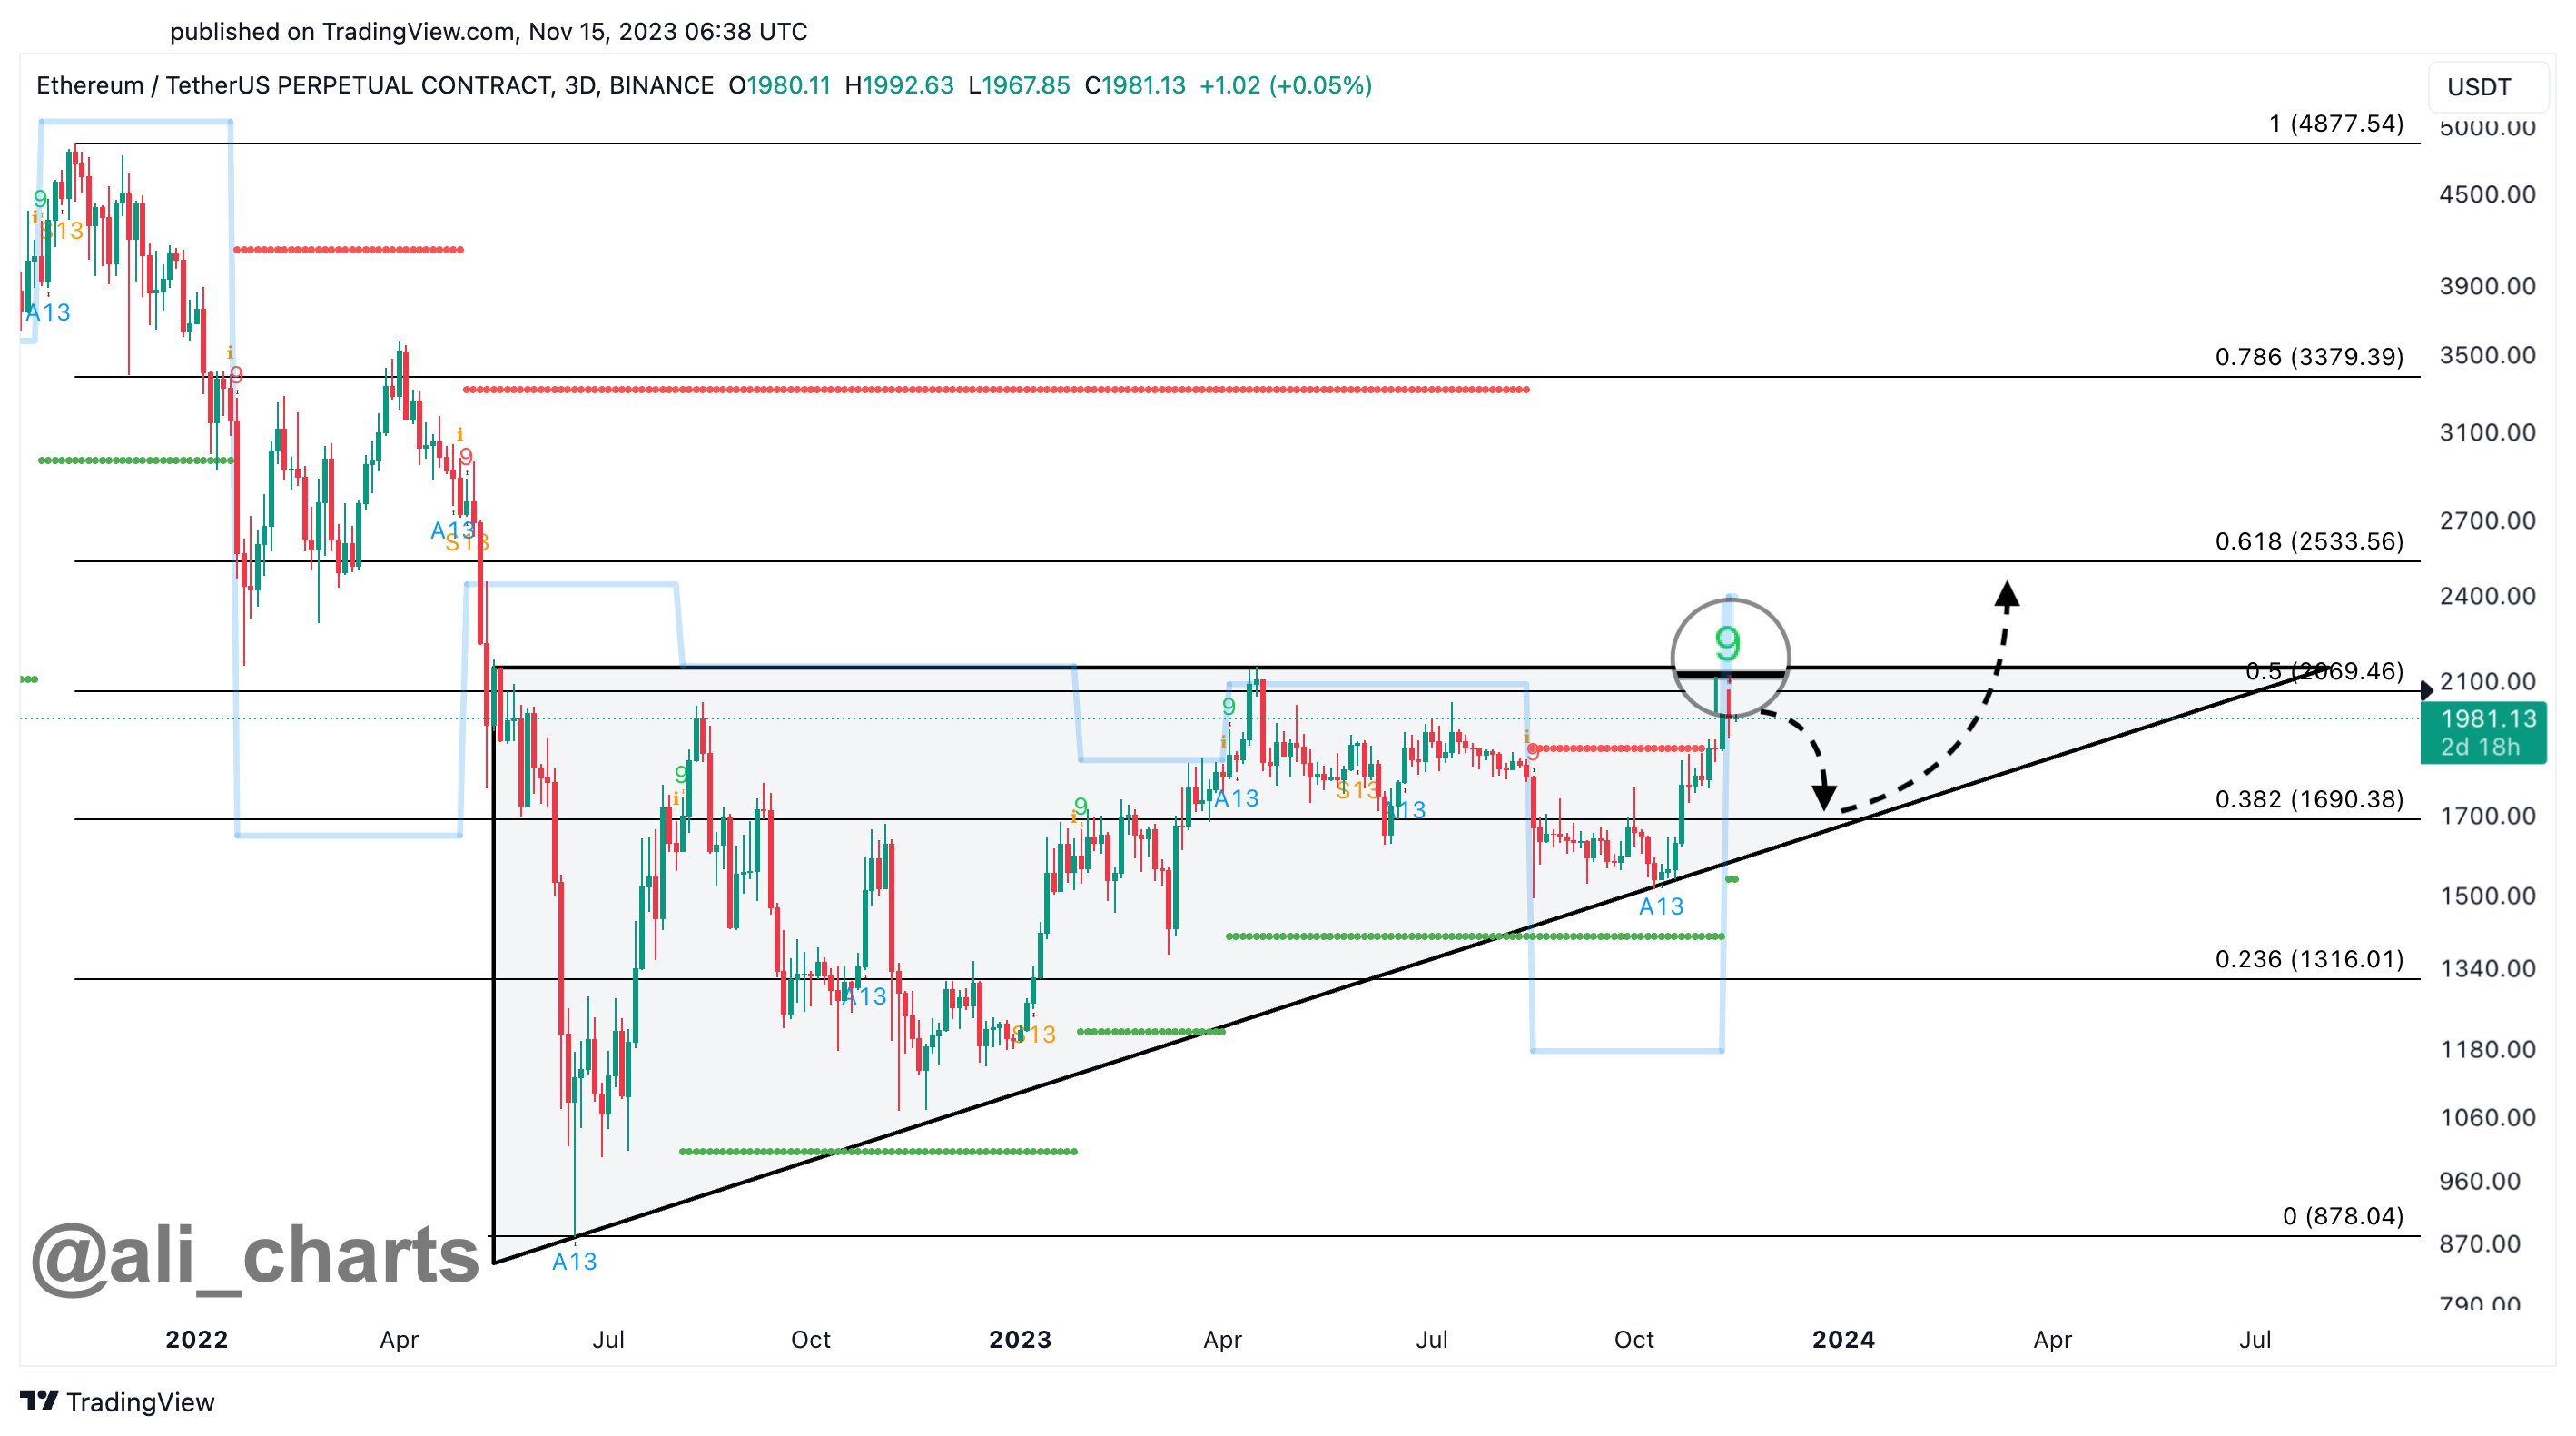
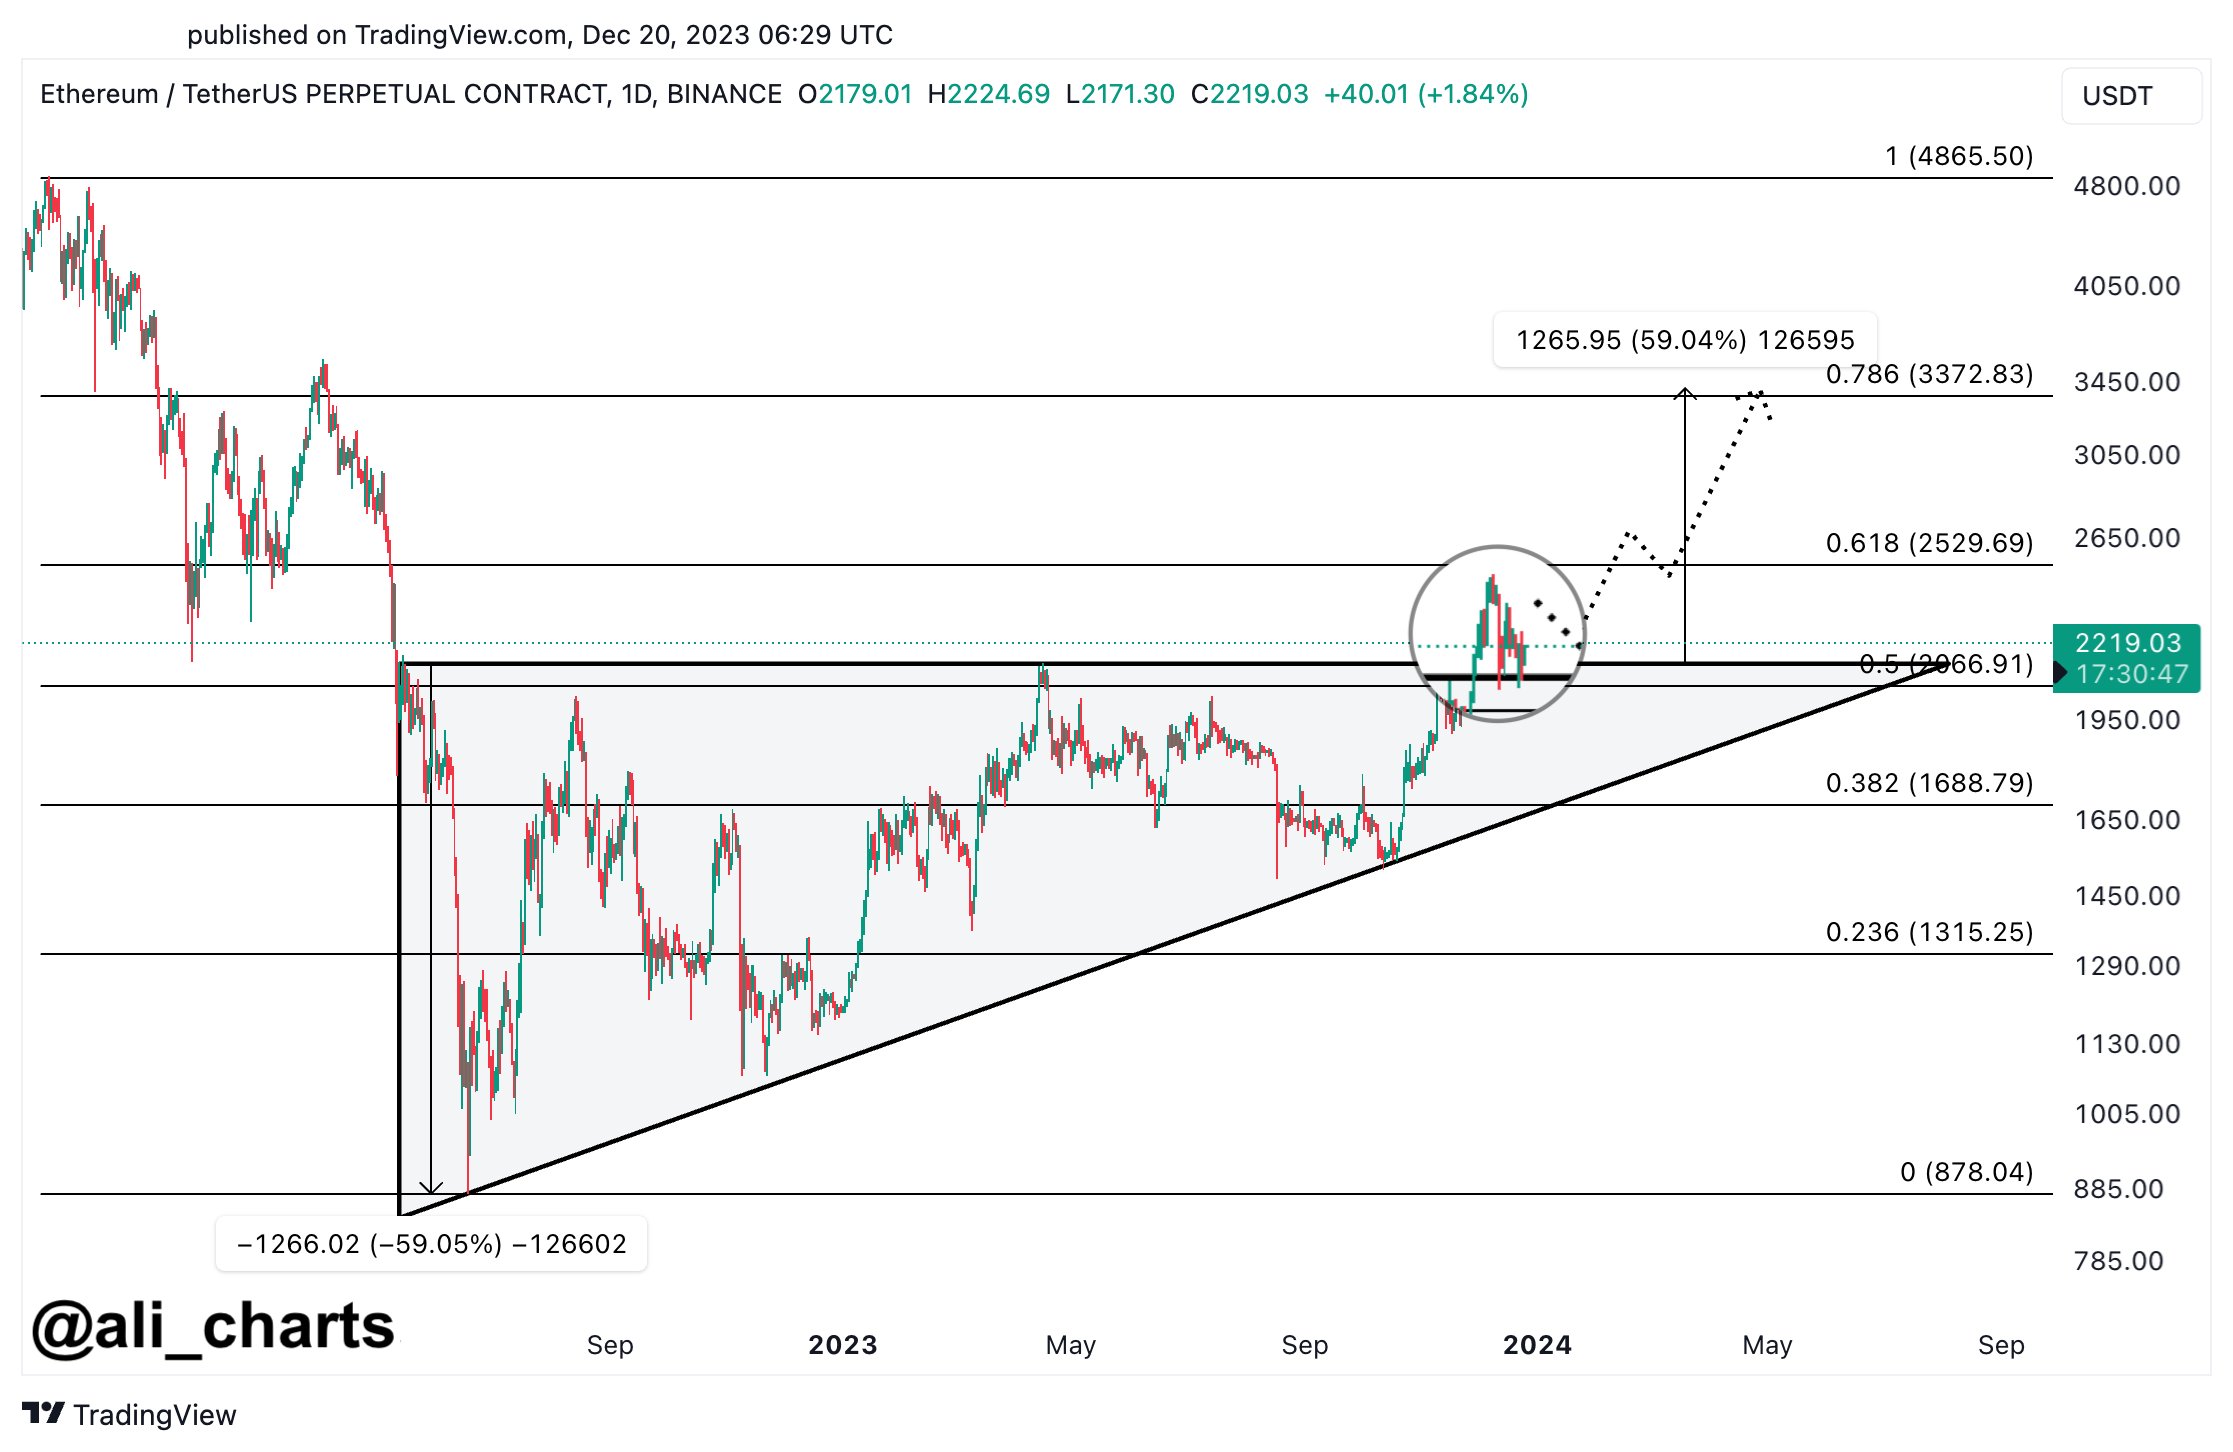
An analyst has explained how Ethereum is retesting a breakout zone currently and that this might lead toward a price target of $3,500.

Ethereum Is Retesting The Breakout Line Of An Ascending Triangle

As pointed out by analyst Ali in a new post on X, Ethereum may be preparing for a further climb right now as it’s retesting the breakout zone of an ascending triangle.

An “ascending triangle” is a pattern in technical analysis that, as its name implies, resembles a triangle. The pattern involves a horizontal line made by connecting highs and a slant line that strings together higher lows.

When the price retests the upper, horizontal level, it could be probable to feel some resistance. On the other hand, a touch of the lower level could lead to the price rebounding back up.

A break out of either of these lines suggests a potential sustained continuation of the trend. Naturally, an escape out of the triangle towards the upside implies bullish momentum, while a fall under means bearish momentum.

Like the ascending triangle, there is also the “descending triangle,” which is a similar pattern except for the fact that the two levels are switched around (as the prevailing trend is towards the downside).

Now, here is the chart shared by Ali that displays how the price is interacting with an ascending triangle right now:

Ethereum Ascending Triangle

As is visible in the graph, Ethereum found a bottom at the lower line of this ascending triangle pattern back in October. Following this low, the asset turned itself around with a sharp rally and went on to challenge the upper line.

The cryptocurrency succeeded in finding a break above the triangle and observed a continuation of the bullish momentum, exploring new highs for the year. Recently, though, the asset has slumped back again and has now fallen towards the triangle’s breakout line.

So far, the line has provided support to the asset, as its price has been able to remain above it. The analyst believes that this retest could be a sign that the coin is preparing for a further rally.

“The price range between $2,150 and $1,900 could be the ideal zone for accumulation before ETH sets its sights on a higher target of $3,500,” explains Ali. From the current price, such a target would mean a rally of almost 60% for the asset.

October, the month when Ethereum turned itself around off the triangle’s slope, was also an inflection point for the asset in terms of on-chain activity, as the analytics firm Glassnode has explained in its latest weekly report.

Ethereum On-Chain Activity

From the chart, it’s visible that the Ethereum transaction count and transfer volume have both been trending up since the inflection point a couple of months back, which could be bullish for the price.

ETH Price

Ethereum has gone a bit stale recently as it has been consolidating around the $2,200 mark.

Ethereum Price Chart

Ethereum Could Decline To $1,700 Based On This Pattern, Analyst Explains

An analyst has explained how a pattern forming in the 3-day Ethereum chart could signal that a decline toward $1,700 may be coming.

Ethereum Has Recently Formed A TD Sequential Sell Setup

In a new post on X, analyst Ali talked about a sell signal that has taken shape in the ETH 3-day chart. The relevant technical indicator here is the “Tom Demark (TD) Sequential,” which is used to spot reversals in the price of any asset.

The metric is made up of two phases; a setup phase and a countdown phase. In the former, candles of the same polarity are counted up to nine following a reversal in the price. Once the ninth candle is hit, the indicator signals a probable top or bottom for the asset (depending on whether the trend until now was towards up or down).

Once the setup is completed, the 13-candle-long countdown phase begins. At the end of these 13 candles, a potential reversal once again takes place for the asset.

Ethereum has registered a sharp rally recently, but according to the analyst, the cryptocurrency has now finished with the setup phase of the indicator, implying that the asset could be heading towards a period of downtrend.

The below chart shows this pattern in the 3-day price of the coin:

Bitcoin TD Sequential

In the same chart, the analyst has drawn an ascending triangle pattern for Ethereum. “Ascending triangles” are made up of two lines: one parallel to the x-axis drawn through the highs in the price, while the other is made by connecting higher lows.

Generally, the price feels resistance at the upper line and support at the lower one. A break out of either of these lines suggests a continuation of the trend: bullish in the case of a surge above the former, while bearish in the case of the latter.

From the graph, it’s visible that Ethereum has recently been retesting the $2,000 to $2,150 zone, which happens to align with the resistance level of this ascending triangle.

Thus, it’s interesting that the ETH TD Sequential setup phase has finished just as the coin has encountered this line that it has been rejected from in the past.

“A pullback from this resistance level could lead to a dip toward the triangle’s hypotenuse at $1,700, setting the stage for a potential uptrend continuation,” explains Ali.

The analyst also notes, however, that the $2,150 level could be one to keep an eye on as if the asset can see a 3-day candlestick close above this level in the coming days, the bearish outlook could be nullified.

ETH Price

Ethereum had risen above $2,100 recently, but the coin has seen some pullback in the past day, a potential sign that the sell signal may already be in effect.

Bitcoin Price Chart