Ethereum Could Decline To $1,700 Based On This Pattern, Analyst Explains

An analyst has explained how a pattern forming in the 3-day Ethereum chart could signal that a decline toward $1,700 may be coming.

Ethereum Has Recently Formed A TD Sequential Sell Setup

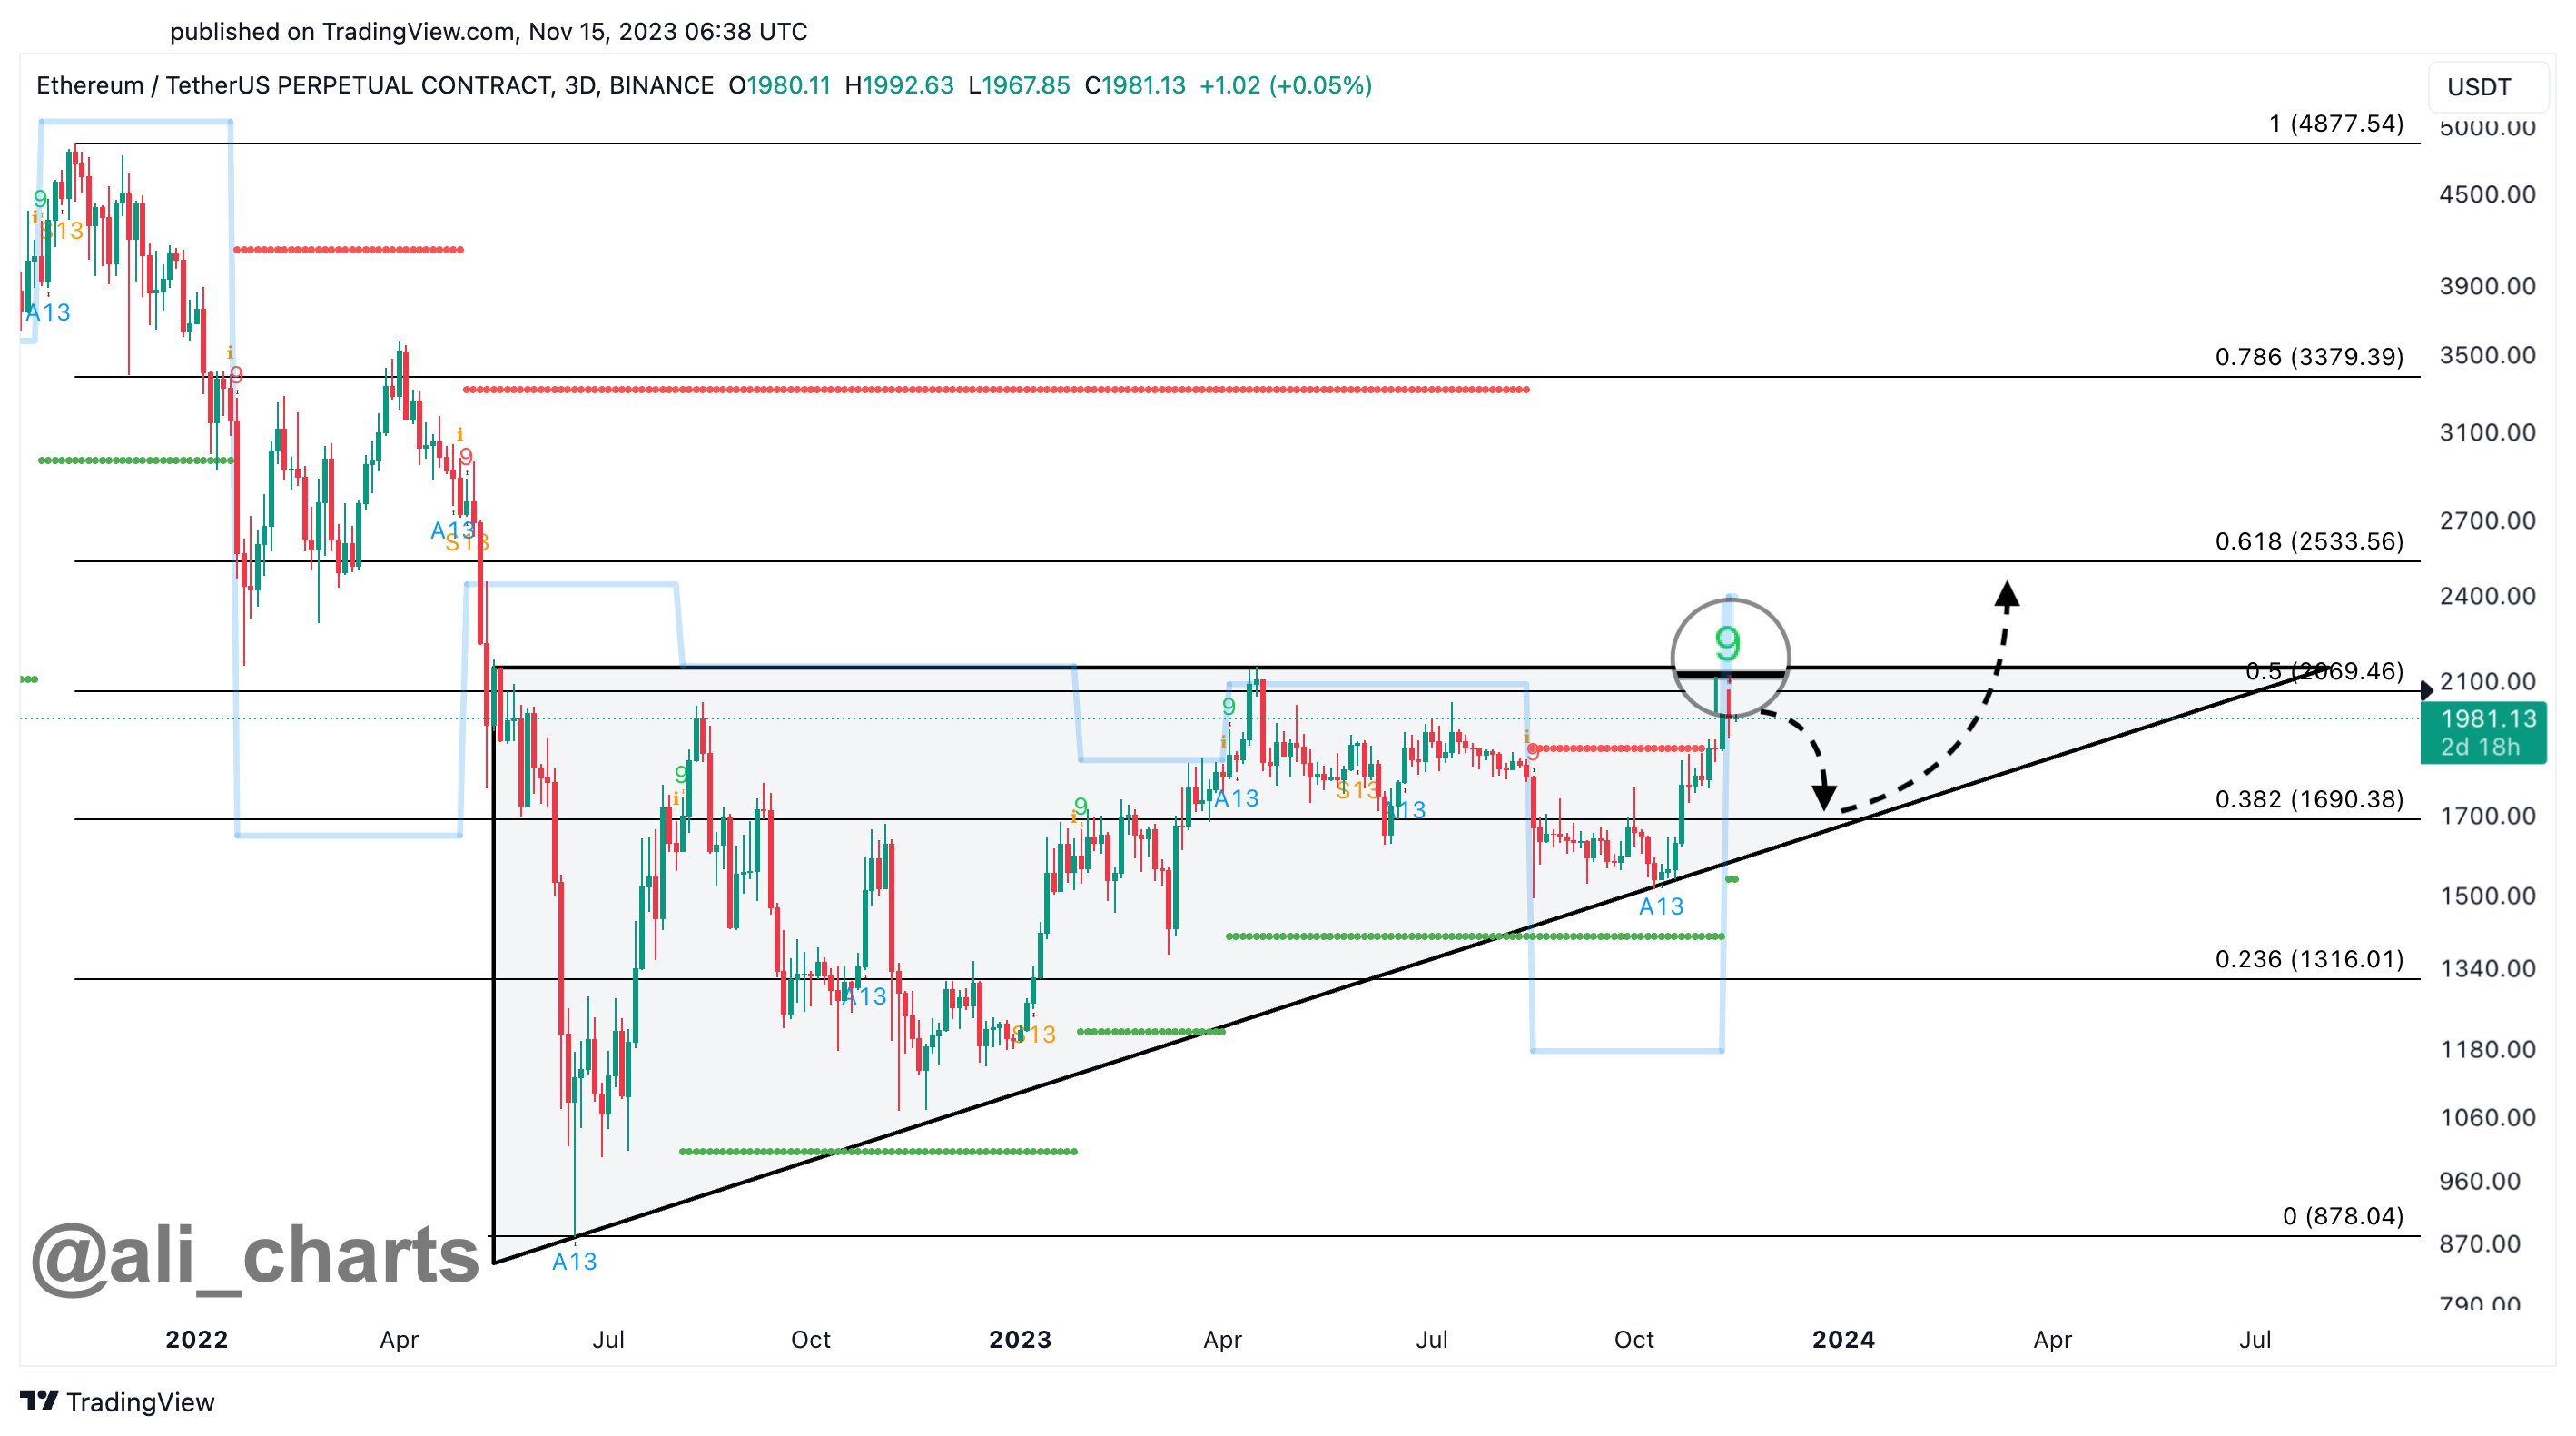
In a new post on X, analyst Ali talked about a sell signal that has taken shape in the ETH 3-day chart. The relevant technical indicator here is the “Tom Demark (TD) Sequential,” which is used to spot reversals in the price of any asset.

The metric is made up of two phases; a setup phase and a countdown phase. In the former, candles of the same polarity are counted up to nine following a reversal in the price. Once the ninth candle is hit, the indicator signals a probable top or bottom for the asset (depending on whether the trend until now was towards up or down).

Once the setup is completed, the 13-candle-long countdown phase begins. At the end of these 13 candles, a potential reversal once again takes place for the asset.

Ethereum has registered a sharp rally recently, but according to the analyst, the cryptocurrency has now finished with the setup phase of the indicator, implying that the asset could be heading towards a period of downtrend.

The below chart shows this pattern in the 3-day price of the coin:

Bitcoin TD Sequential

In the same chart, the analyst has drawn an ascending triangle pattern for Ethereum. “Ascending triangles” are made up of two lines: one parallel to the x-axis drawn through the highs in the price, while the other is made by connecting higher lows.

Generally, the price feels resistance at the upper line and support at the lower one. A break out of either of these lines suggests a continuation of the trend: bullish in the case of a surge above the former, while bearish in the case of the latter.

From the graph, it’s visible that Ethereum has recently been retesting the $2,000 to $2,150 zone, which happens to align with the resistance level of this ascending triangle.

Thus, it’s interesting that the ETH TD Sequential setup phase has finished just as the coin has encountered this line that it has been rejected from in the past.

“A pullback from this resistance level could lead to a dip toward the triangle’s hypotenuse at $1,700, setting the stage for a potential uptrend continuation,” explains Ali.

The analyst also notes, however, that the $2,150 level could be one to keep an eye on as if the asset can see a 3-day candlestick close above this level in the coming days, the bearish outlook could be nullified.

ETH Price

Ethereum had risen above $2,100 recently, but the coin has seen some pullback in the past day, a potential sign that the sell signal may already be in effect.
Bitcoin Price Chart

Ethereum Sees Inflows Of $505M Into Binance, Sign Of Selling?

On-chain data shows Ethereum has observed massive inflows of $505 million into Binance during the past day, a sign that selling may be going on.

Ethereum Exchange Inflows Have Shot Up During The Past Day

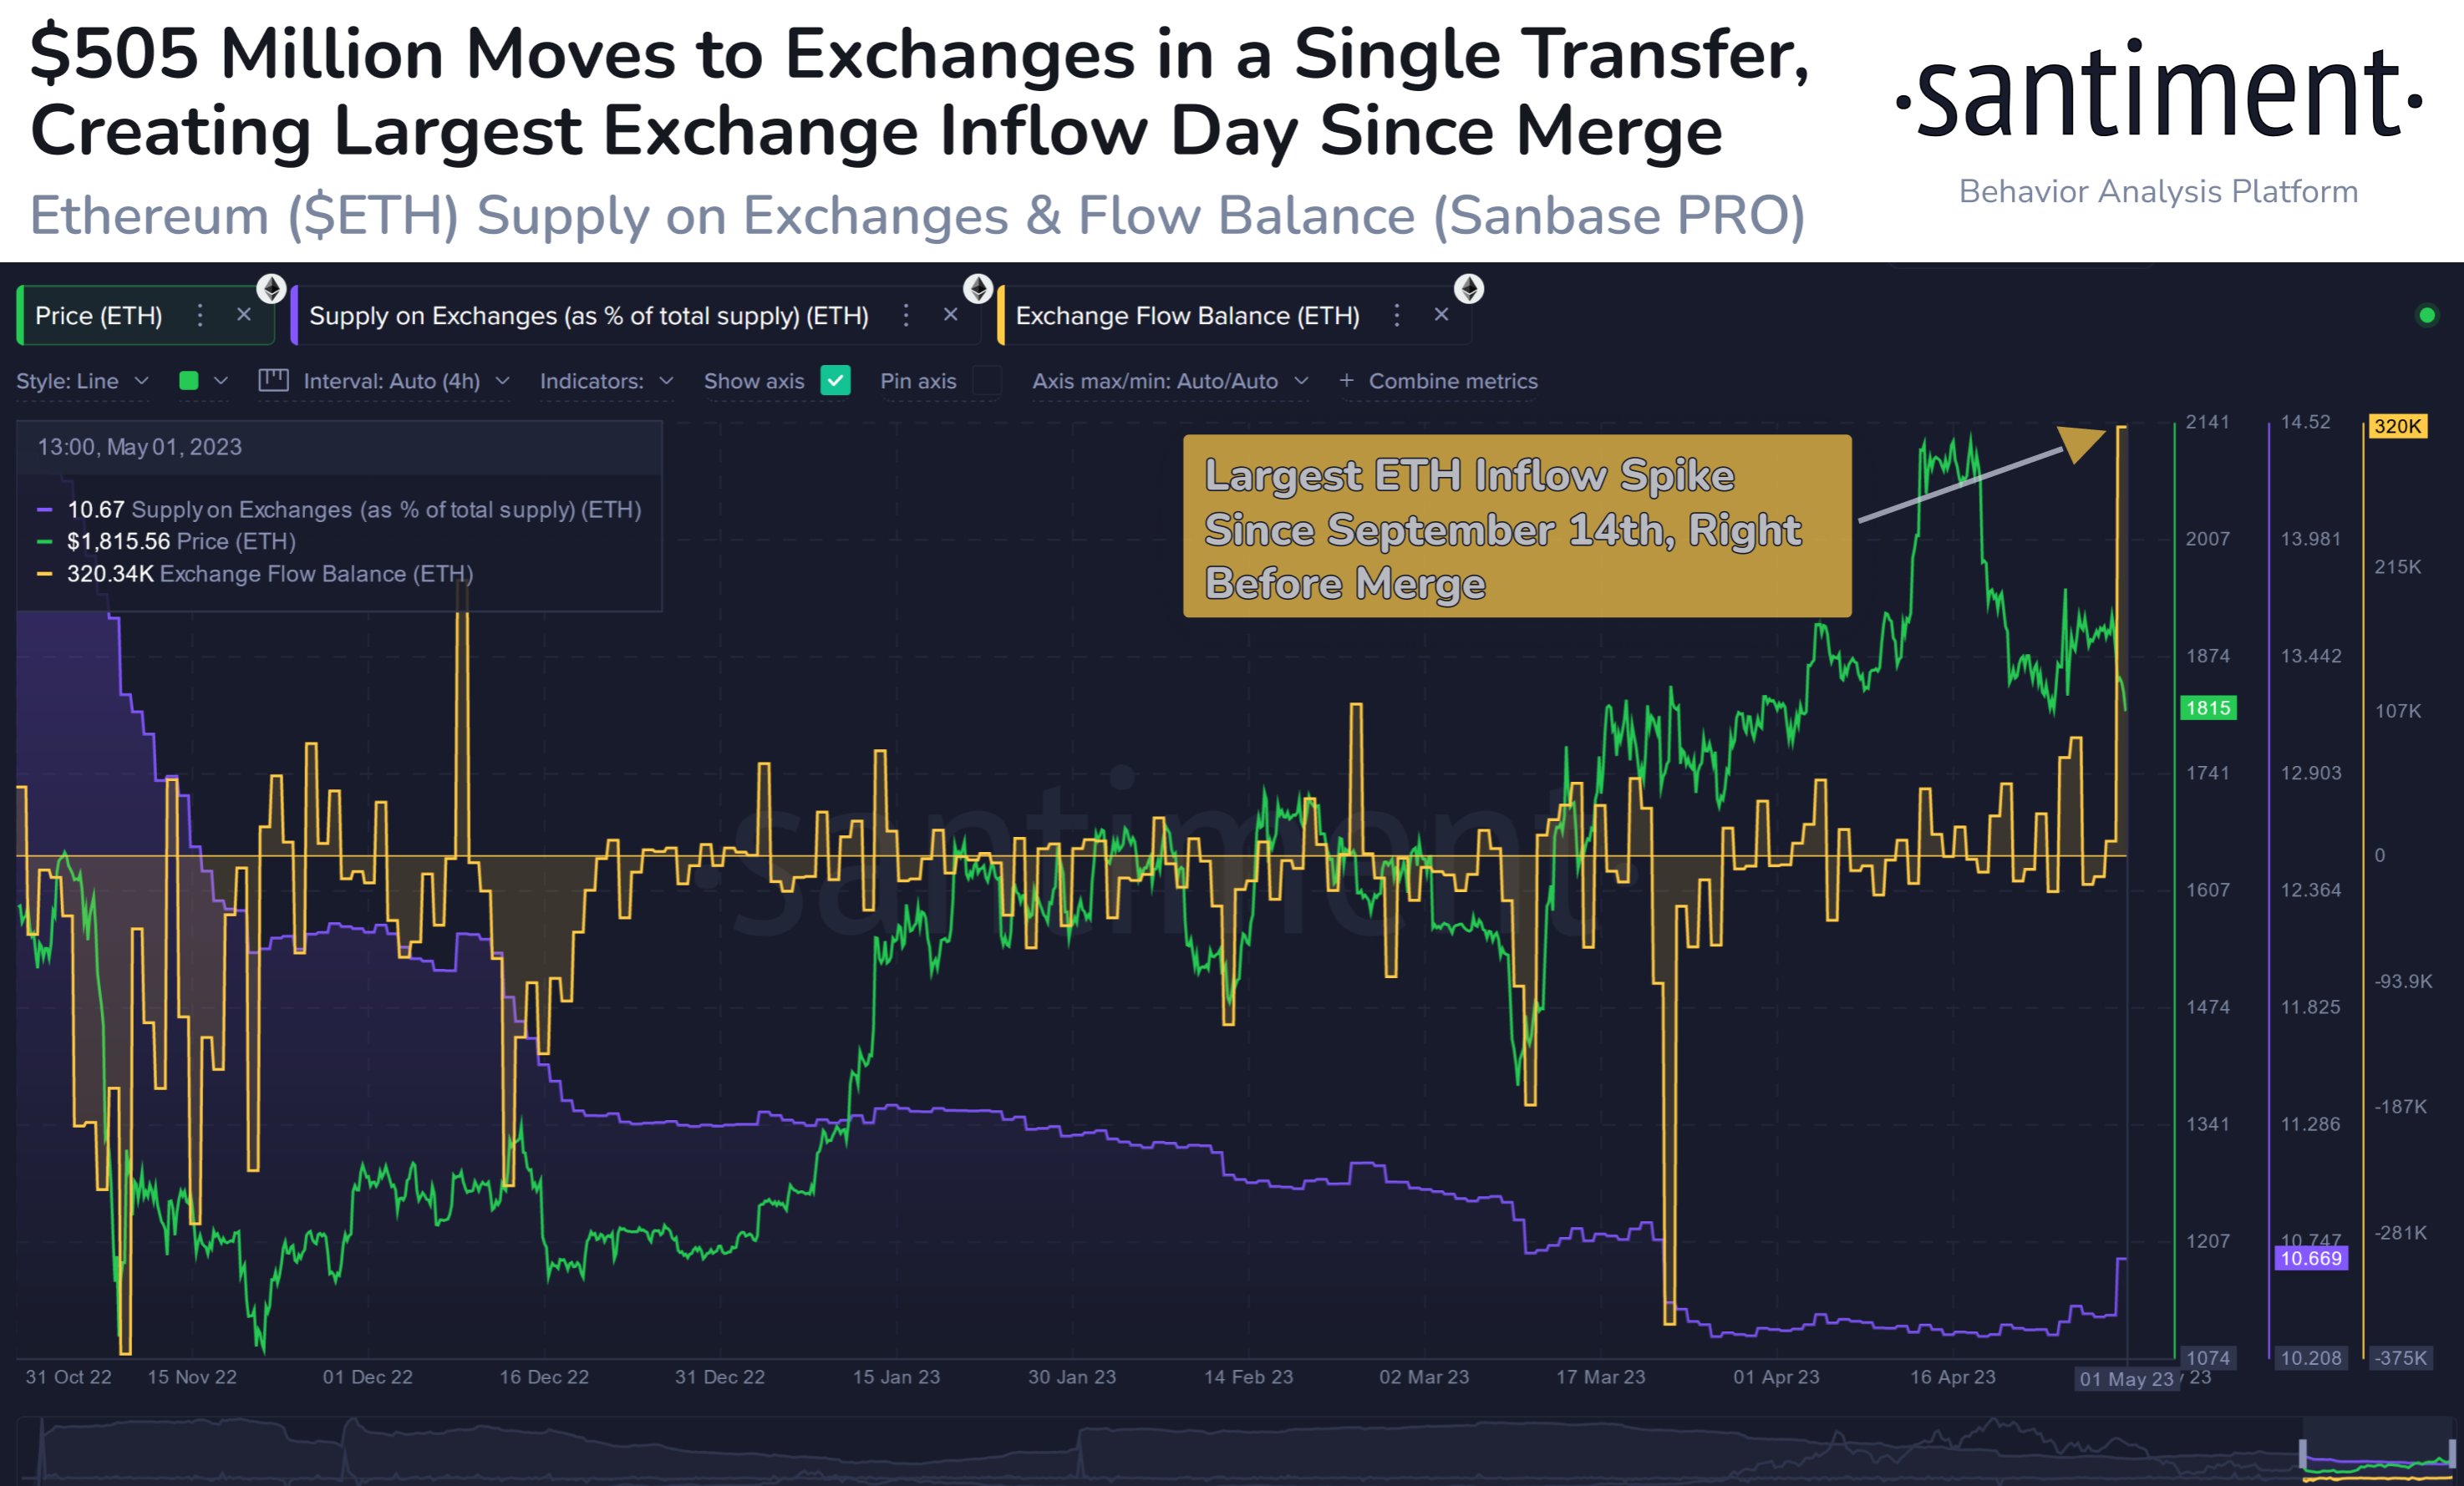
According to data from the on-chain analytics firm Santiment, this increase in the supply on exchanges is the largest observed since the day before the Merge. The “supply on exchanges” is an indicator that, as its name already implies, measures the percentage of the total Ethereum supply that’s currently sitting in the wallets of all centralized exchanges.

Related Reading: Bitcoin Bearish Signal: Miners Continue To Sell

When the value of this metric increases, it means investors are depositing some coins to exchanges right now. This kind of trend can have bearish consequences for the asset’s price as one of the main reasons why investors transfer their coins to exchanges is for selling-related purposes.

On the other hand, decreasing values of this indicator imply a net amount of ETH is exiting these platforms currently. Such withdrawals can be a sign that the holders are accumulating the cryptocurrency, which can naturally be bullish for the asset’s value in the long term.

Now, here is a chart that shows the trend in the Ethereum supply on exchanges over the last few months:

Ethereum Supply on Exchanges

As displayed in the above graph, the Ethereum supply on exchanges has observed a sharp rise in the past day, meaning that investors have deposited a large amount of ETH to these platforms.

In the chart, there is also the data for another ETH indicator: the “exchange flow balance.” This metric measures the net number of coins that are flowing into or out of exchanges, meaning that the exchange flow balance essentially tracks the changes happening in the supply on exchanges indicator.

During the past day, this metric has seen a large positive value, suggesting that inflows have far surpassed the outflows in this period. According to the metric, around 320,000 ETH ($584.6 million at the current price) has entered into the wallets of the exchanges with this spike.

This net increase in the exchange supply is in fact the largest that the cryptocurrency has seen since September 14, 2022, the day before the transition towards the proof-of-stake consensus mechanism took place.

Interestingly, the vast majority of the inflow spike has been contributed by just one transfer, as data from the cryptocurrency transaction tracker service Whale Alert shows.

This transfer to Binance was worth almost $505 million, and it is one of the largest transactions between an unknown wallet and an exchange observed during the last five years.

It’s uncertain whether the whale has made this deposit with the intention to sell, or for using any other of the services offered by the platform. However, if selling is truly the goal here, then this massive inflow can be bad news for the asset’s price.

ETH Price

At the time of writing, Ethereum is trading around $1,800, up 1% in the last week.

Ethereum Price Chart

Ethereum Bearish Signal: Netflows Turn Sharply Positive

On-chain data shows the Ethereum netflows are sharply turning positive, a sign that could prove to be bearish for the crypto.

Ethereum Exchange Reserve Rises As Netflows Become Positive

As pointed out by an analyst in a CryptoQuant post, exchanges have observed net ETH inflows recently, swelling up their reserves.

The “all exchanges netflow” is an indicator that measures the net amount of Ethereum moving into or out of wallets of all exchanges. The metric’s value is calculated by taking the difference between the inflows and the outflows.

When the value of the indicator is positive, it means exchanges are getting more inflows right now than outflows. Such a trend can be bearish for the price of the coin as investors usually deposit their ETH to exchanges for selling purposes.

On the other hand, negative netflow values imply that outflows are currently overwhelming the inflows. Sustained such values can be bullish for Ethereum as it may be a sign of accumulation.

Related Reading | Here Are Two Scenarios For Bitcoin A Month Prior To FED Announcing Possible Interest Rate Hike

Now, here is a chart that shows the trend in the ETH netflows over the past year:

Looks like the indicator’s value has recently risen above zero | Source: CryptoQuant

As you can see in the above graph, the Ethereum netflows have sharply increased to positive values in the past couple of weeks.

The effect of these net inflows can be seen through the exchange reserve indicator, which measures the total amount of ETH sitting on exchanges. Below is the chart for it.

The indicator seems to have surged up recently | Source: CryptoQuant

As the graph shows, the Ethereum exchange reserve has sharply increased in value in the past week. Which is expected, as the netflows have been positive lately.

Related Reading | Bitcoin Option Traders Seem Doubtful At Entering Directional Trades

The exchange reserve is often called the “sell supply” of the crypto. If the trend continues and the reserve keeps on going up, the near term outlook may be bearish for the price of the coin.

ETH Price

At the time of writing, Ethereum’s price floats around $3k, down 6% in the last seven days. Over the past month, the coin has parted with 8% in value.

The below chart shows the trend in the price of the crypto over the last five days.

The price of ETH seems to have dipped down over the past twenty-four hours | Source: ETHUSD on TradingView

Ethereum’s price had surged up to almost $3.2k a couple of days back, but has since come back down a bit to the current levels. At the moment, it’s unclear when the coin may show further recovery.

Featured image from Unsplash.com, charts from TradingView.com, CryptoQuant.com