Ethereum has once again broken above the $3,000 level after previous attempts ended in failure as FOMO took over the investors.
Ethereum Has Rallied 3% In Past Day To Break Back Above $3,000
Earlier, Ethereum had made two attempts at the $3,000 level, but both of them had turned out to be brief as the asset quickly retraced back to lower levels. In the past day, ETH has once again made a push towards the mark, as the chart below shows.
In this latest surge, ETH has seen a sharp recovery of more than 3% from around the $2,900 mark to the current levels. The coin is now up 8% in the past week, making it the second-best performer among the top 10 cryptocurrencies, just behind BNB’s 10% profits.
From the graph, it’s visible that Ethereum is now within touching distance of setting a new high for the year. But ETH investors would be wondering if this rally would sustain or if it would end up losing steam, just like the previous ones. If data is anything to go by, market sentiment may have been the reason behind the demise of the last surges.
ETH’s Previous Surges Topped Out As FOMO Took Over Traders
According to data from the analytics firm Santiment, the latest top above $3,000 occurred as the crowd euphoria spiked. The indicator of interest here is the “Social Volume,” which keeps track of the total amount of discussion that social media users are participating in around a given term or topic.
The metric calculates this value by counting up the number of posts/threads/messages across the major social media platforms that are making at least one mention of the topic.
The below chart shows the data of the Social Volume related to two Ethereum topics:
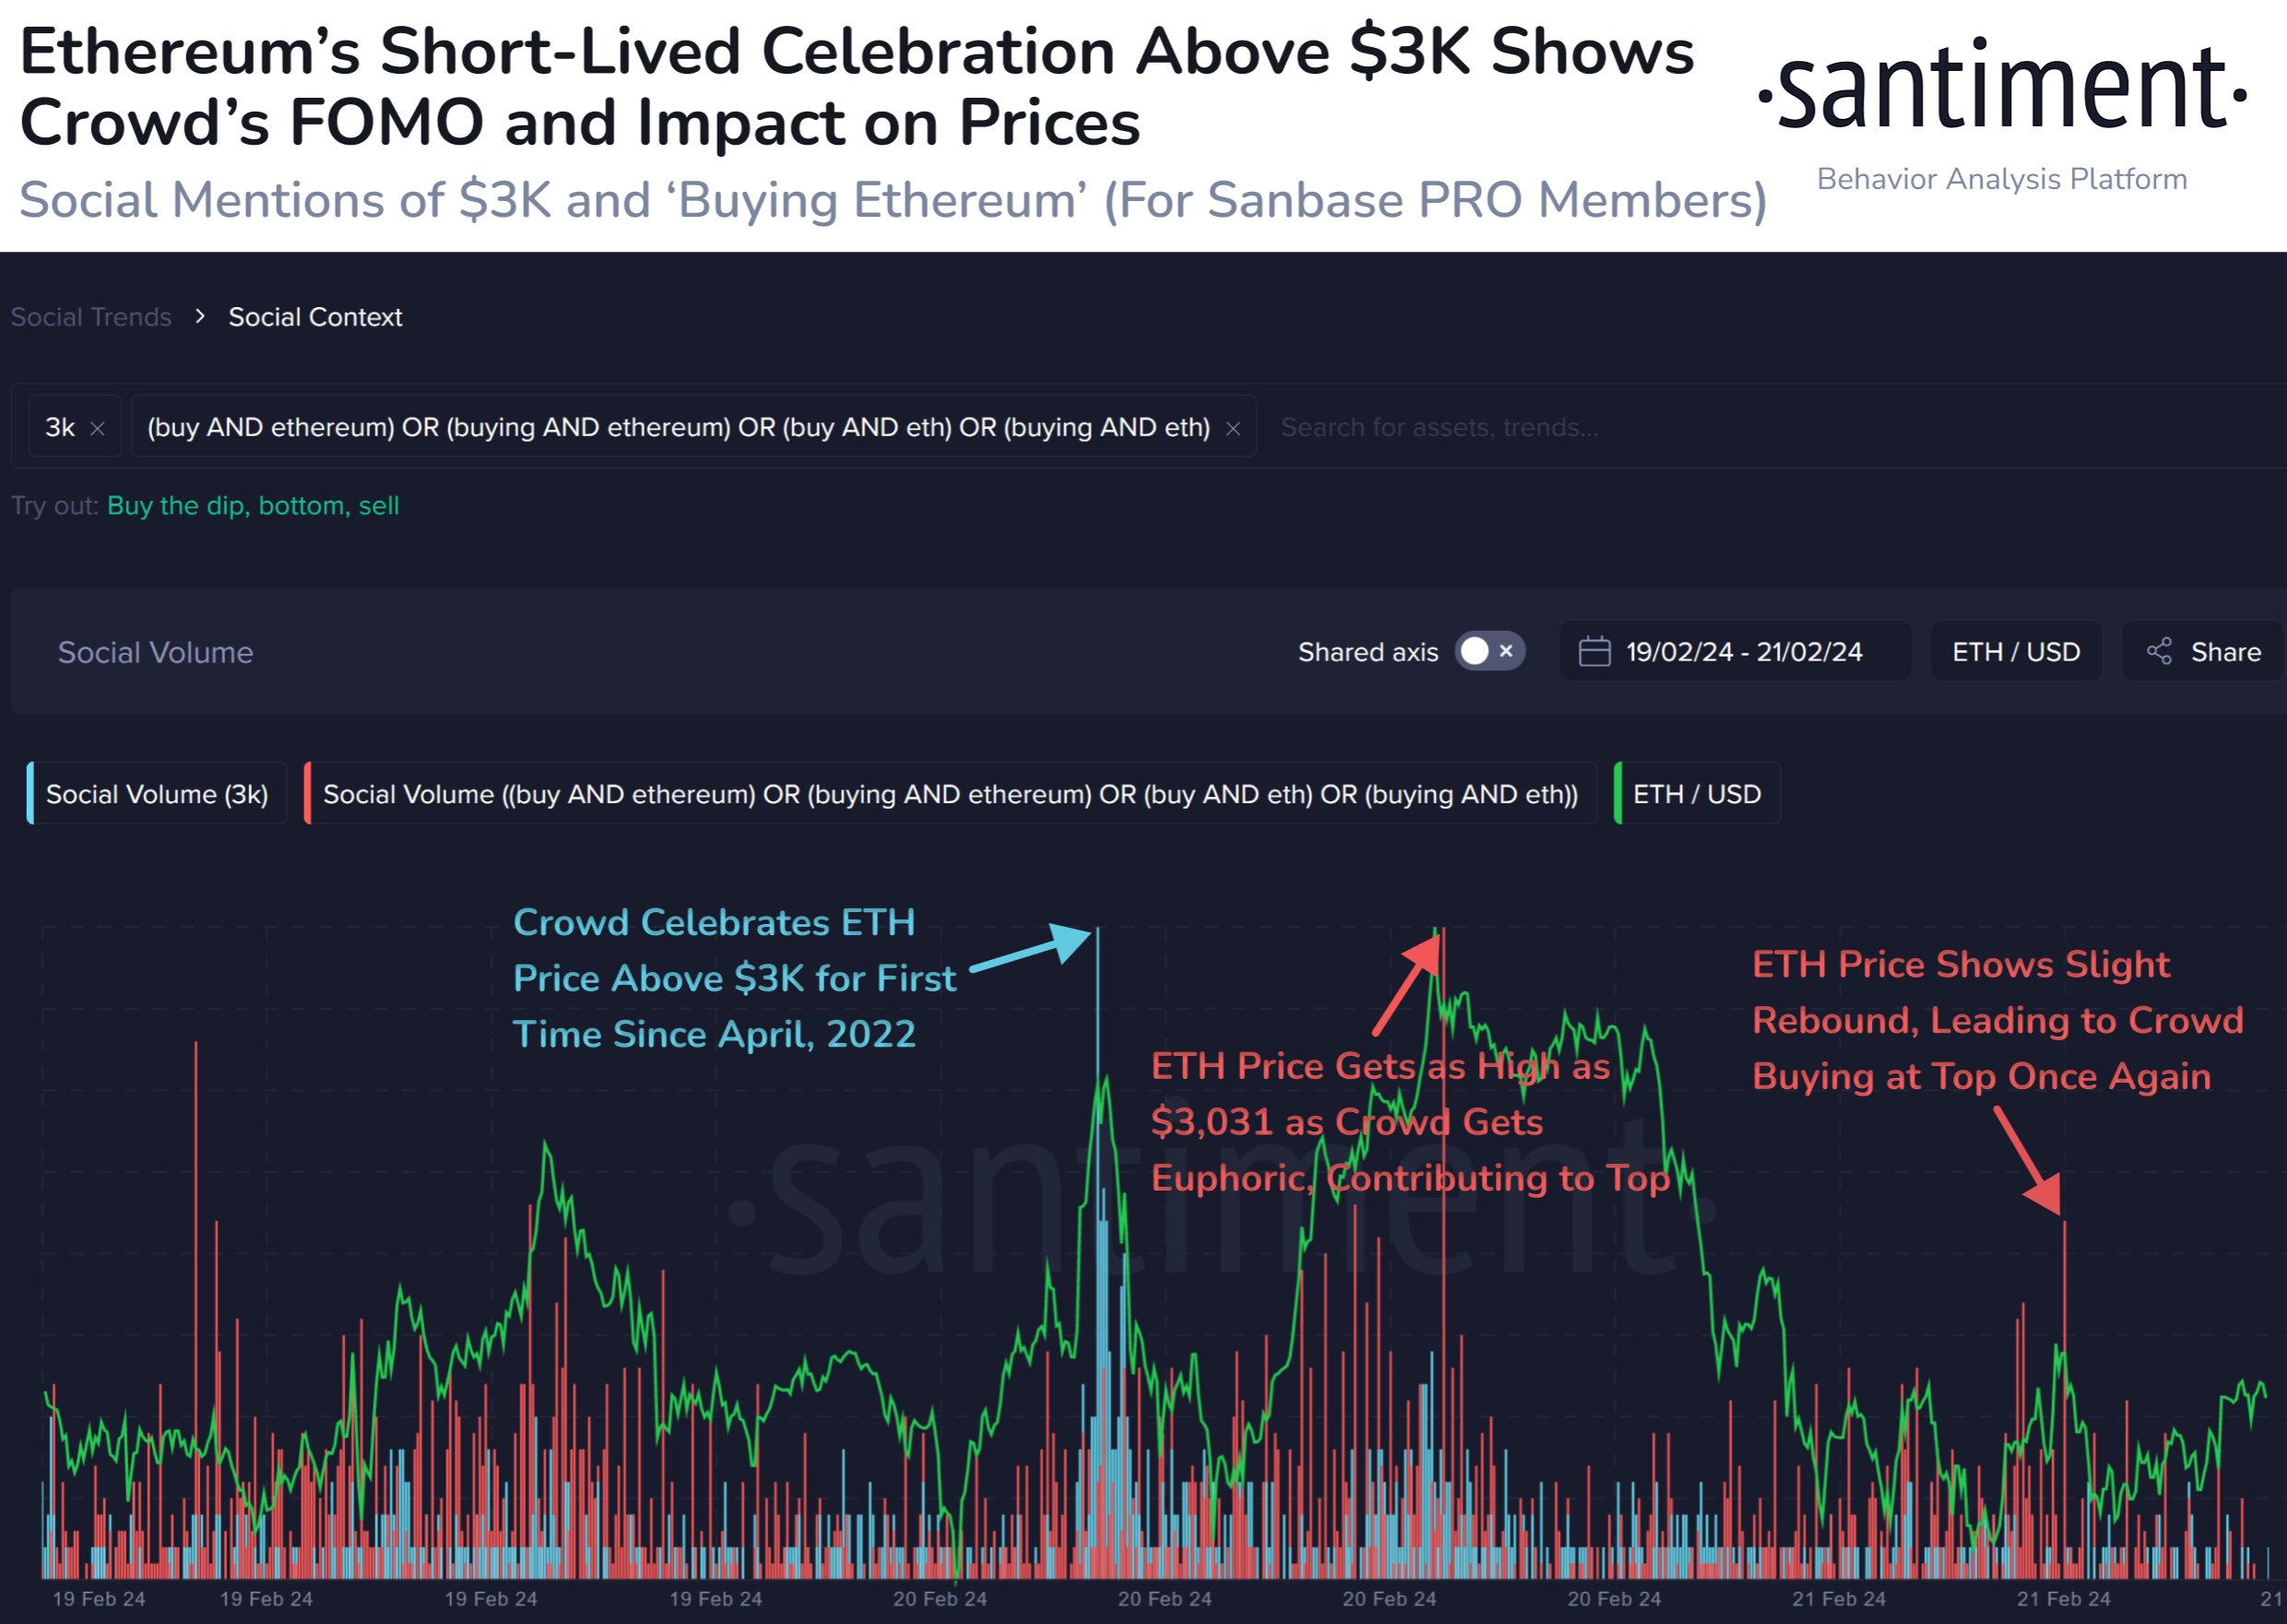
The first Social Volume here has been filtered for $3,000. As is visible in the graph, this metric spiked as ETH broke above $3,000 for the first time since April 2022 a couple of days back.
This would suggest that discussions around the topic had spiked high as traders had celebrated the break. As it had turned out, though, the surge was pretty short-lived.
In the second attempt, the Social Volume related to terms like “buy Ethereum” had registered a large spike, implying that FOMO had developed among the traders.
Historically, FOMO has been something that has made tops likely, as ETH’s price has tended to go contrary to the expectations of the crowd. This is likely the reason why the top coincided with this spike.
A similar phenomenon occurred with the small recovery surge observed yesterday, as Santiment has highlighted in the chart. It would seem that greed had once again led to the coin topping out.
It now remains to be seen how the market reacts to the latest rally above $3,000. If FOMO around Ethereum once again spikes on social media, then it may very well be a sign that this surge, too, may only be temporary.


