Ethereum Supply Turns Deflationary Post-Merge, Here’s How Much ETH Has Left Circulation

Ethereum has seen its deflationary status once again in the limelight as the network continues to see a significant decline in the number of ETH tokens in circulation. This comes on the back of the belief that the bull run and some other factors could help uphold this trend. 

More ETH Goes Out Of Circulation

According to data from Ultrasound Money, Ethereum has seen a decrease in its circulating supply in the last seven days, with over 14,160 ETH going out of circulation. This is a result of over 30,700 being burned during this period while only just over 16,500 ETH have been issued during this same timeframe. 

This development continues a growing trend where the number of tokens being burned outpaces the number of tokens being issued. NewsBTC had reported earlier this month how over 106,000 ETH had been burned in the last 30 days (between November 4 and December 4). At the same time, only just over 70,000 ETH had been issued. 

This deflationary trend has been attributed to the increasing number of validators exiting the Ethereum ecosystem. This trend is said to have begun at the start of October. Glassnode noted that the average number of validators exiting per day surged from 309 to 1018 validators per day at the start of October. 

This isn’t the only contributing factor, as network activity on Ethereum has picked up significantly. According to data from Etherscan, the daily number of transactions on the network has stood over a million in the last seven days. This has caused a spike in gas fees, causing more ETH to be burned with the EIP-1559 protocol.  

Ethereum price chart from Tradingview.com

Ethereum Deflationary Trend Expected To Continue

It is no coincidence that network activity on Ethereum has picked up as many continue to position themselves ahead of the imminent bull run, which is projected to kickstart in 2024. The recent surge in the trading volume of non-fungible tokens (NFTs) on Ethereum has also been a big factor. This is expected to continue once the bull market takes its full course. 

Another factor to consider is the fact that more liquidity is expected to flow into the Ethereum ecosystem if the pending Ethereum Spot ETFs applications get approved. This would likely spark a further increase in the trading activity on the network as many will look to invest in the second-largest cryptocurrency by market cap. 

ETH investors will undoubtedly be delighted at the fact that the future trajectory of ETH looks bullish. One can expect the crypto token’s value to rise as it continues to maintain this deflationary status. The less ETH in circulation, the more valuable it likely will be. 

At the time of writing, Ethereum is trading at around $2,270, up by over 4% in the last 24 hours, according to data from CoinMarketCap. 

Holesky Testnet Takes Flight On Merge Anniversary Amidst Ethereum 30-Day Slump

One year has passed since the Ethereum (ETH) Merge, which marked the integration of Ethereum’s proof-of-stake (PoS) Beacon Chain with the Ethereum Mainnet. 

This significant milestone facilitated the transition of the Ethereum blockchain from the legacy proof-of-work (PoW) system to a PoS model, giving rise to Ethereum 2.0.

The completion of the Merge on September 15, 2022, brought about a major shift in Ethereum’s energy consumption, with an expected reduction of 99.95%. Additionally, this transition opened up new possibilities for scaling the Ethereum ecosystem.

The merge involved migrating the entire blockchain to new PoS validator nodes, which require participants to stake or lock up 32 Ether (ETH) to participate in the network.

Importantly, this transition did not impact Ether tokens held by investors, and the operations of Ethereum-based applications remained unchanged. As Ethereum celebrated the first anniversary of The Merge, it introduced its latest testnet called Holesky.

The Future Of Ethereum Development And Testing?

Initially known as Holli, the Holesky testnet is designed to enhance the testing environment on Ethereum. Drawing inspiration from a vibrant neighborhood in Prague, Czech Republic, this new testnet offers various improvements over its predecessor, Goerli. 

According to a blog post from the software development firm Tatum, Holesky is set to replace Goerli as the primary testnet for staking, infrastructure, and protocol development. For testing decentralized applications, smart contracts, and other Ethereum Virtual Machine (EVM)-related functions, the Sepolia testnet remains the preferred choice.

Holesky, on the other hand, serves as Ethereum’s merged-from-genesis public testnet, mirroring mainnet functionalities and enabling precise evaluations through thorough staking trials, infrastructure assessments, and direct protocol developer testing. To ensure rigorous testing, Holesky aims to have twice as many active validators as the main Ethereum network. 

The network starts with a solid foundation of 1 million validators, encouraging teams to run a substantial number of validators, with each team handling around 100,000 validators. These measures contribute to the comprehensive evaluation of the testnet and intended functionality.

According to Tatum’s blog post, by introducing Holesky and refining inflation mechanisms based on the Sepolia testnet, Ethereum continues to evolve and improve its protocols. 

One Year After The Merge

In a recent post on X (Formerly Twitter), the self-proclaimed Ethereum Educator, who goes by the pseudonym “Sassal.eth,” highlighted some notable statistics on the first anniversary of The Merge. 

One significant achievement for Ethereum since the Merge is burning 980,000 ETH tokens, resulting in a permanent reduction of Ethereum’s total supply. Burning ETH involves removing tokens from circulation, contributing to potential scarcity and value. 

Additionally, the Ethereum 2.0 network has seen a significant 11.6 million ETH being staked, which involves locking up ETH as collateral to participate in the proof-of-stake consensus mechanism.

Moreover, according to Sassal, adding 362,000 new validators has strengthened the Ethereum network. Validators are crucial in proposing and validating new blocks, ensuring the network’s security and overall robustness. 

Ethereum

On the other hand, Ethereum’s native token, ETH, has experienced a tumultuous journey in terms of its price performance since the beginning of the year. Despite reaching an annual high of $2,144 on April 16, ETH has been impacted by the overall market trend, resulting in significant losses across various time frames.

Currently, ETH is trading at $1,619, representing a 1% decline in the past 24 hours. Similarly, over the past seven days, the token has recorded a decrease of 0.9%. 

Looking at the fourteen and 30-day time frames, ETH has experienced declines of 1% and 11.3%, respectively, underscoring the prevailing downward trend for the token’s value. 

However, it is worth noting that since the occurrence of The Merge, ETH has witnessed a moderate rise of 7.6% year to date, according to Coingecko data.

Featured image from iStock, chart from TradingView.com 

Ethereum Finishes 2022 With ATH Correlation To Bitcoin, Despite The Merge

Data shows Ethereum’s year of high correlation with Bitcoin is coming to an end with the metric hitting ATH values.

Ethereum Ends 2022 With All-Time High Correlation To Bitcoin

According to the year-end report from Arcane Research, the global markets have all fallen strongly correlated this year. The “30-day correlations” is an indicator that measures how in-tune Bitcoin has been with another asset in terms of price movement over a 30-day period.

When the value of this metric is greater than zero, it means there has been a positive correlation between BTC and the other asset in the past month. On the other hand, negative values imply that the price of the crypto has been reacting to changes in the value of the other asset by moving in the opposite direction.

Also, the higher the metric value (in either direction), the more the degree of the correlation. Naturally, the metric has a value equal to zero suggesting the two prices aren’t tied to each other at the moment.

Now, here is a chart that shows the trend in Bitcoin’s 30-day correlations with Ethereum, S&P 500, and Nasdaq over the past year:

Bitcoin And Ethereum Correlation

As the above graph displays, Bitcoin positively correlated with these three assets during 2022. BTC’s correlation has been around or above 0.5 for most of the year for the US equities, suggesting it has been decently tied with them.

The correlation with Ethereum, however, has been at values of around 0.9 or more, implying Bitcoin has been extremely correlated with it. Even now, as the year’s end, the correlation between these cryptos stands at 0.97, around ATH levels.

Back in September of this year, ETH successfully finished its much-anticipated transition to a Proof-of-Stake consensus system, an event known as the Merge. Since the Merge brought some developments unique to Ethereum, the correlation with BTC dropped, as is apparent in the chart.

However, it wasn’t long before the two started moving on the same wavelength again, so even the Merge wasn’t enough to cause sufficient impact to separate the coins.

Also, since Bitcoin is highly correlated with stocks, so is Ethereum. Though, Arcane Research expects that this correlation between the cryptos and the US equities will soften in the next year due to trading volumes in the crypto market declining substantially.

ETH Price

At the time of writing, Ethereum’s price floats around $1,200, down 2% in the last week.

Ethereum Price Chart

Ethereum Sees Surge In Number Of New Addresses – Will ETH Shine This October?

The Ethereum Merge upgrade is expected to haul in more new users on the network which happens to be true with the surge of new active wallet addresses on the platform.

  •  Ethereum’s new active wallet addresses climb to a new ATH of 3,001.804
  •  ETH seen to spike in terms of social media engagements and mentions
  •  ETH price up by 0.46% as of press time

According to a Twitter post by Glassnode shared on October 2, the number of new active wallet addresses on the Ethereum network recently climbed to a new ATH of 3,001.804.

While it’s true that this screams a boost in investor interest in the alt, the recent plunge in market volume and sentiment seems to be in contrast to everyone’s expectations to date.

The number of new active wallet addresses on the Ethereum platform is seen to have dropped in August and recovered since September.

Spike In Number Of ETH Addresses Trigger Increase In Social Metrics

The increase in the number of wallet addresses also triggered a spike in social media engagement of the altcoin. Ethereum has shown a significant improvement of 4.63% surge in terms of social mentions and also 27.6% in social engagements.

The Merge has created a lot of buzz on social media especially in the past month but the overall sentiment wasn’t purely positive. In fact, Ethereum is down in terms of weighted sentiment as seen in the last few days.

In addition, ETH value has also been moving downwards as seen in the past couple of days. The altcoin volume has retreated from 13.45 billion on September 30 to only 6.03 billion on October 2.

On the brighter side, even with the negative public sentiment, Ethereum still managed to attract more whale investors in the altcoin. Evidently, the top 500 ETH whales have gained interest in investing and buying the crypto.

The momentum of Ethereum has shown some growth as seen in the past three days indicating an increase in wallet transactions involving Ether.

Ethereum Development Activity Decreasing

More so, the altcoin also gained the approval of Deutsche Telekom following their announcement of planning to roll out an Ethereum validator.

On the other hand, the development activity on Ethereum has been spiraling down too which implies the decrease in activity on the GitHub.

The current market state has however negatively impacted Ethereum as even the Merge failed to meet expectations in terms of capital outflow.

Consequently, despite the growth in terms of wallet transactions and the rise in social media engagements, the price of ETH wasn’t able to keep up with the positive sentiment. 

The coin is seen to recover a bit and is in the green lane as of publication. According to CoinMarketCap, ETH price has soared by 0.46% or trading at $1,304.30 as of this writing.

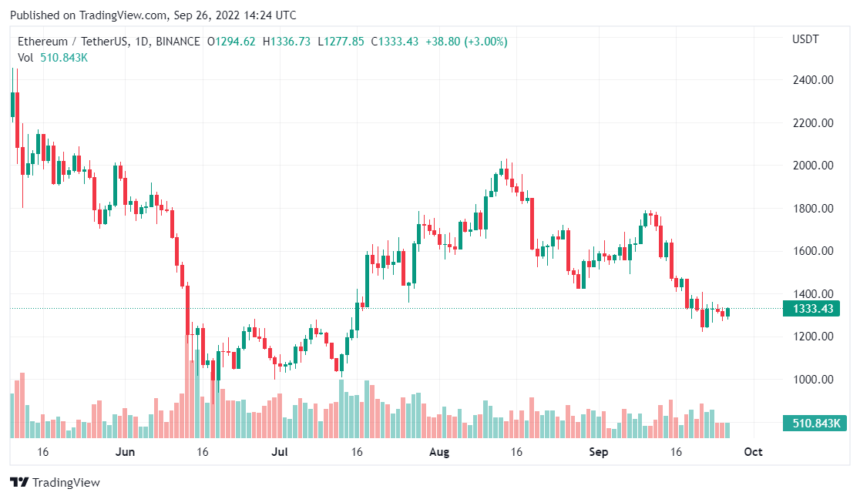
The ETHUSD pair is trying to break past the $1,317 level on the daily chart | Source: TradingView.com

Featured image from Top Trend Coins, chart from TradingView.com

Bitcoin Sees Massive Decline In On-Chain Activity

Bitcoin on-chain activity had been lit up like a Christmas tree over the weeks leading up to the Ethereum Merge. Even though the upgrade was not taking place on the bitcoin network, it was still significant for the crypto space, which led to increased activity across various networks. However, now that the Merge has been done and dusted, the network activity has begun to retrace to ‘normal’ levels, leading to a decline in on-chain activity.

Bitcoin Mining Hashrate Drops

For the first time in two months, the bitcoin mining difficulty had adjusted downward. Due to this downward difficulty adjustment of 2.1%, the block production rate remained low at 5.94 blocks produced per hour. It coincided with the bitcoin hash rate hitting a new all-time high before a reversal was recorded. 

Nevertheless, the difficultly adjustment has come as good news to bitcoin miners who have been watching their revenues plummet in the last week. The average transaction per block was down 1.55% in a 7-day period from 1,786 to 1,759.

BTC hash rate retraces from all-time high | Source: Arcane Research

Bitcoin’s mining hash rate has now returned to early September levels, showing a retracement back to pre-Merge levels. But this hash rate remains on the high side even through this, showing increased conviction from bitcoin miners during this time.

Revenues Take A Hit

Bitcoin miners are still feeling the heat since the bear market has refused to hit up. Daily miner revenues have now hit one of their lowest points in the last year, with a little above $17 million in daily revenues. This accounted for a 4.04% decline over a 7-day period.

Fees realized per day followed the same downward trend and dropped 19.49% to $254,199. This brought down the percentage of revenues made up by fees by another 0.28%, to come in at 1.48% of all revenues made up by fees.

BTC price trending at previous peak highs | Source: BTCUSD on TradingView.com

However, the largest declines for last week were recorded in the average transaction values and the daily transaction volumes. The former had ended up with a 37.61% decline in the last week, bringing the average transaction value to $12,304. At the same time, daily transaction volumes dropped 38.57%, from $5.023 billion to $3.085 billion. This was the largest drop that was recorded for the last week. Transactions per day were also down from $254,696 to $250,755, a 1.55% decline.

Bitcoin’s price has also followed this trend and has been struggling in the market. It had been unable to reclaim $20,000, now trading firmly at the previous cycle peak. Understandably, this has turned into a major support level for the bulls. 

Featured image from Bitcoinist, charts from Arcane Research and TradingView.com

Follow Best Owie on Twitter for market insights, updates, and the occasional funny tweet…

Staked ETH Nears 14 Million As Ethereum Readies For Breakout

Since the completion of the Ethereum Merge, sentiment among the community has remained positive. There had been no withdrawal mechanisms coded into the hard fork, which meant that the feared dump of millions of ETH into the market did not happen. What had happened is that the amount of ETH that was being staked on the network had continued to grow, now getting close to another important milestone for the network.

Staked ETH Almost At 14 Million

By the time the Merge was to be implemented, there had been more than 13 million ETH already staked on the network. This represented more than 11% of the total circulating ETH supply being taken out of circulation temporarily. 

Now, less than two weeks after the Merge was completed, the staked volume on the network is already ramping up. Since September 15th, there have been more than 200,000 ETH staked on the network. This has brought the total staked ETH to 13.979 million, leaving less than 27 ETH left for the network to reach the 14 million mark. This means that the addition of one more validator will push the staked amount above 14 million, meaning more than 11.5% of the total supply of ETH is now staked.

The accelerated rate of staking speaks volumes about the support that Ethereum is getting. Even though there are those who have lamented the network’s move to proof of stake, the improved capabilities of the network point to this being the right direction for it.

Ethereum Wants Another Breakout

The crypto market has been reeling from the crash, but it has seen some meaningful recovery in this time. One of the cryptocurrencies that continues to show great promise even through this bear run has been Ethereum, and this has everything to do with ETH staking.

Since more ETH is being staked on the network and there is no withdrawal mechanism in place, these ETH are being taken out of circulation and essentially reducing the supply. The ETH issuance since the Merge is also down 98%, meaning that the supply of ETH is declining by the day.

All of these point towards an incoming supply squeeze. When taking into account the fact that ETH continues to show accumulation trends and the support forming at $1,300, a breakout towards $1,500 is more likely at this point, as more investors move their coins out of centralized exchanges, as was seen in the last 7 days, the supply will get tighter, causing the value of the cryptocurrency to balloon. 

Featured image from Business 2 Community, charts from TradingView.com

Follow Best Owie on Twitter for market insights, updates, and the occasional funny tweet…

China Reports GPU Price Fall To All-Time Low Post Ethereum Merge

The successful Ethereum upgrade to proof-of-stake consensus is receiving more backlashes from the market. Therefore, the Ethereum upgrade should produce only positive feedback, but where there are merits, demerits must exist.

One of the aftermath challenges the industry faced since the Ethereum upgrade was the drop in GPU prices. Graphic Processing Units (GPUs) in crypto mining increased over the years because they proved very efficient.

GPU companies were earning huge profits due to the increased demand from ETH miners. However, it is no longer so, as the price of GPUs has dropped drastically over the past three months. Furthermore, the prices of GPUs dropped further after the upgrade.

Is Ethereum Merge Major Cause Of GPU price Crash?

South China Morning Post (SCMP) reported that GPU prices in China dropped to the lowest due to the Ethereum merge. ETH mining has reduced. So miners’ demand for GPU went low. Miners’ demands for expensive cards such as GeForce RTX 3080 and RTX 3090 became low and caused a reduction in price to trice the factory prices.

Also, due to the China mining ban and COVID lockdown, the demand for costly GPUs fell and worsened during the bear market. A Shanghai trader, Peng, told SCMP that RTX 3080 dropped by over 37% in the last three months.

According to Peng, the price of RTX 3080 went from 8000 yuan ($1,140) to less than 5000 yuan (%712). Peng attributed the drop in the price of GPUs to the poor condition of the crypto market.

Ethereum mining was one of the highest contributors to the high demand for GPUs in the past years. Traders noticed a slump in GPU prices as the Ethereum merge drew near.

Ethereum price climbs above $1,300 l ETHUSDT on Tradingview.com

SCMP reported that retailers at ‘Buy Now,’ a large electronics market in Shanghai, are experiencing low GPU demand.

Retailers Lower GPU Prices

Chinese retailers reduced factory-suggested GPU prices by over 33% in a few weeks to sell their equipment. The reason for this is the crypto bear market and GPU correction market.

According to data from Baidu, traders are losing the selling price compared to the factory cost of GPUs. Analysts estimated that the average price drop of GPUs per week is about 10%.

Some reports show that NVIDIA, a large GPU manufacturer, is reducing the price of their GPU for board partners. This report is still unconfirmed, but it would likely cause further reduction in the coming weeks.

Although the crash in GPU prices may adversely affect many businesses, others think it marks the end of two years of nightmare. Many GPU retailers would previously raise the prices as high as possible because of the high demand by miners.

The crash in GPU prices could prove beneficial to AI coders, gamers, and other users because Crypto miners caused an unnecessary increase in GPU prices.

Featured Image From Pixabay, Charts From Tradingview

Get Forked: Ethereum PoW Forks Fall 66% In Just Days

Data shows the Ethereum Proof-of-Work forks have sharply fallen down in the few days following the merge.

Ethereum PoW Forks Have Fallen 66% In Just Five Days

According to the latest weekly report from Arcane Research, the ETH PoW forks have performed very poorly against ETH since the merge.

The much talked-about event transitioned Ethereum to a Proof-of-Stake consensus mechanism, essentially obfuscating the use of miners on the network.

However, some communities that were in favor of the old PoW-based system decided to create forks as the merge came approaching.

These new forks still rely on mining for reaching consensus on the network and have therefore naturally attracted the stranded ETH miners.

Here is a chart that shows how some of the most popular forks (ETC, ETHW, and ETF) have compared versus Ethereum in the last five days:

Looks like the worst performer out of these was ETF | Source: Arcane Research’s The Weekly Update – Week 37, 2022

As you can see in the above graph, Ethereum has been struggling since the merge, registering around 17% in negative returns.

The PoW forks, however, have been even worse. ETHW has noted losses upwards of 66%, while ETF investors have been yet deeper into the red with their holdings going down by more than 72% during the period.

The best of this bunch was Ethereum Classic, being down “only” 25% in the last five days. This performance was much better than the other two forks, but still noticeably lower than ETH’s returns.

The report notes that this wasn’t something unpredictable as the forks were expected to struggle with amassing any meaningful adoption and to view almost no significant DeFi activity.

The current selling pressure in these cryptos is likely coming from Ethereum holders selling off their airdrops, as per the report.

ETC saw a large amount of ETH miners connecting to the network, leading to a hashrate, and hence a difficulty, explosion for the coin.

Since Ethereum Classic’s miner revenues are less than $1 million per day, while they were more than $20 million for ETH, mining the crypto isn’t viable on the same scale as ETH’s in the long term.

ETH Price

At the time of writing, Ether’s price floats around $19.1k, down 5% in the last seven days. Over the past month, the crypto has lost 10% in value.

The below chart shows the trend in the price of the coin over the last five days.

The value of the crypto seems to have failed to recover from the plunge a few days back | Source: BTCUSD on TradingView
Featured image from Kanchanara on Unsplash.com, charts from TradingView.com, Arcane Research

Post-Merge Profit-Taking Cuts 13% Off Ethereum Ratio Against BTC

We’re in a post-merge world, and the lessons keep arriving. As it turns out, the mythical Merge was a sell-the-news event for Ethereum. Technically, the event was a success and Ethereum kept a 100% uptime as optimistically predicted. Economically, the asset has been bleeding for the whole post-merge season. As a result, Ethereum lost ground against bitcoin, and bitcoin dominance is back up.

Let’s go to Arcane Research’s The Weekly Update for the exact stats and numbers: 

“Since the merge, Ether (ETH) is down 17% in USD and down 13% compared to BTC, with ETHBTC currently trading at 0.07. ETH has found support at 0.07 ETHBTC, which represents the average ETHBTC price over the last 365 days.”

Will this become a tendency or are these just the post-merge jitters? 

The Post-Merge Post-Mortem

For a rational analysis, let’s quote The Weekly Update:

“Ether traded idly after the merge, and volatility remained low until U.S. markets opened down. The ETH blow was related to a correlated environment to risk assets, but excess leverage from long traders contributed to exacerbating Ether’s relative underperformance versus BTC.”

And the fact of the matter is that the old adage “buy the rumor, sell the news” applies perfectly here. Fuelled by hype, Ethereum’s price ballooned before the event. It was still far away from its all-time high of around $4,8K, but $1.7K was great for the market we’re in. The asset outperformed bitcoin and threatened its dominance. It was overbought, though. Post-merge, people sold and ETH is now in a downtrend. Textbook behavior that shouldn’t surprise a soul.

The chart to watch, though, is that of Ethereum’s issuance. The main difference between the post-merge Ethereum and its predecessor is that the new coin will be much more scarce. And that could affect the price tremendously.

ETH price chart for 09/21/2022 on Bittrex | Source: ETH/USD on TradingView.com
State Of The Ethereum Forks

One of the drivers of the pre-merge rally was the expectation that there might be forks and there might be airdrops. Two brand new Ethereum forks emerged from the messy situation. Those two suffered the most during this post-merge period. Back to The Weekly Update:

“Ether has not struggled in isolation, Ether forks have experienced severe headwinds, and both ETHW and Poloniex’s competitor fork EthereumFair (ETF) have seen more than two-thirds of their valuation slashed since launch.”

This brutal smackdown was to be expected. All forks generate something akin to an airdrop, as people received the equivalent to the ETH they had in ETHW and ETF. Users exchanged that free money for harder currencies pretty fast. And now it’s time for those forks, who the all-powerful stablecoins don’t support, to prove their worth.

An older fork was also in the news because of the merge and has been struggling as much as its cousins. 

“Ethereum Classic has also underperformed versus ETH. Amid the merge, many miners migrated to ETC, leading ETC’s hashrate to peak at 300 TH/s. However, as the difficulty has increased in ETC, the hashrate in ETC has declined to 186 TH/s”

Some people thought that Ethereum Classic, who remains a Proof-Of-Work blockchain, was going to thrive post-merge. So far, they’ve been proven wrong. But we’re in the early innings and things might drastically change for old reliable Ethereum Classic. 

ETHBTC price chart on Binance | Source: The Weekly Update
Conclusions

Apparently, the merge was a success but the price didn’t hear the news. However, we should take into account that September is usually a bad month for cryptocurrencies in general. That, mixed with the classic “buy the rumor, sell the news” behavior have ETH against the ropes. For now.

Featured Image by Gerd Altmann from Pixabay | Charts by TradingView and The Weekly Update

Quant Explains How Whales Moved Before And After Ethereum Merge

A quant has explained how the movement of whales differed between before and after the Ethereum merge went live.

Ethereum Funding Rates Reached An All-Time Low Just Before The Merge

As pointed out by an analyst in a CryptoQuant post, a lot of ETH investors bet on the price going down around the merge’s completion.

The relevant indicator here is the “funding rate,” which measures the periodic fee that perpetual futures contract traders exchange between each other.

When the value of this metric is positive, it means long investors are paying a premium to the short holders right now to hold onto their positions. Such a trend shows a bullish sentiment is more dominant in the market currently.

On the other hand, negative values of the indicator suggest shorts are overwhelming the longs at the moment as the majority are feeling bearish.

Now, here is a chart that shows the trend in the Ethereum funding rates over the last few days:

Looks like the metric had a deep red value not too long ago | Source: CryptoQuant

As you can see in the above graph, the Ethereum funding rates had been going down only a couple of days back, and reached a new negative peak right as the merge arrived.

The quant explains that this was because investors thought the PoS transition hype had already impacted the market, and so they bet on short positions, believing that the price would go down during the aftermath of the much anticipated event.

But just following the merge, the price actually rather saw a slight improvement. Seeing that the decline they had waited for didn’t come, these short holders quickly started closing up their positions, leading to the funding rates sharply moving up.

Right as this happened, the whales who had been waiting jumped in and dumped their ETH, causing the price to plunge down hard. The analyst notes that this is a display of whales trying to make a move in such a way that nets them the largest gains. “To read those moves, we need to utilize both on-chain data and charts,” says the quant.

ETH Price

At the time of writing, Ethereum’s price floats around $1.4k, down 7% in the last seven days. Over the past month, the crypto has lost 24% in value.

The below chart shows the trend in the price of the coin over the last five days.

The value of the crypto seems to have been going down during the last few days | Source: ETHUSD on TradingView

Ethereum has been trending down since the merge took place, and right now it’s unclear when the crypto may show some reversal.

Featured image from Thomas Lipke on Unsplash.com, charts from TradingView.com, CryptoQuant.com

Bitcoin Monthly Stats: Cost Basis, Long-Term Holders, And The Cyclical Bottom

In this month’s The Bitcoin Monthly, ARK Invest focused on Ethereum and the Merge. As a side dish, they did publish some premium and review-worthy stats that we’re about to cover. Never mind the market, the Bitcoin network keeps producing block after block regardless. The stats that this whole activity produces can be critical in understanding the market, though.

That’s where ARK Invest’s The Bitcoin Monthly comes in. The publication defines itself as “an “earnings report” that details on-chain activity and showcases the openness, transparency, and accessibility of blockchain data.” So, the data we’re about to cover is The Bitcoin Monthly’s reason to be. 

The Bitcoin Monthly: 200-Week Moving Average And Investor Cost Basis

  • “After closing above its 200-week moving average in July,1 bitcoin’s price reversed and slipped below it in August. Currently at $22,680, the 200-week moving average now seems to be resistance.”

The center couldn’t hold. The price’s recovery was short-lived. Markets are red across the board and bitcoin is no exception. At the time of writing, bitcoin trades at $19,874. For those keeping score, that’s just below last cycle’s all-time high of $20K. Something that shouldn’t happen, but a few degrees of error are always understandable. 

  • “Bitcoin currently trades above investor cost basis at $19,360, its strongest on-chain support level (…) Importantly, throughout bitcoin’s history, trading at investor price usually marks a bottoming process.”

Times are tough, but bitcoin still trades above investor cost basis. The Bitcoin Monthly clarifies, “Investor price is calculated by subtracting the cost basis of miners from the general cost basis of the market.” As we see it, The Bitcoin Monthly is calling the bottom. They didn’t say it in those exact words, but they certainly insinuated it. 

Is the bottom really in, though?

BTC price chart for 09/17/2022 on Gemini | Source: BTC/USD on TradingView.com
The Bitcoin Monthly: Short-Term Holder Vs. Long-Term Holder

  • “The short-term-holder (STH) cost basis is approaching its longterm-holder (LTH) cost basis ––an event that has marked cyclical bottoms in the past. (…) Since the end of July, the difference between short- and long-term holders’ cost basis has shrunk from $5,840 to $2,500”

The Bitcoin Monthly sees it as a sign that “the market typically is capitulating and shifting back to long-term participation.” Bitcoin’s consolidation process might be ending soon. We could stay for a while in the bottom area, though. That has happened before. The point is, all of the indicators The Bitcoin Monthly highlighted this month point in the same direction. To the bottom.

  • “The supply held by long-term bitcoin holders is 34,500 coins away from reaching 13.55 million– its all-time high. Long-term-holder supply constitutes 70.6% of total outstanding supply.

This one is the most bullish of all the featured stats. To clarify, coins that haven’t moved in 155 days or more qualify as “long-term holder supply.” The tourists and the people with high hopes left a long time ago. And the lion’s share of the bitcoin supply is now in the true believers’ possession. A remarkable situation that doesn’t get mentioned enough.

About The Ethereum Merge

  • “In August, ether outperformed bitcoin by 7.6% (…) Historically, ether has outperformed bitcoin during “riskon” bull markets and underperformed during “risk-off” bear markets.”

The merge’s effects affected the market throughout the whole narrative. Even though we’re in a “risk-off bear market,” ETH took over and lead the market for a while there. They accomplished the mythical feat and… the market turned on them. After what seemed like mission accomplished, ETH’s price started to bleed.

Hidden behind a secret door, that’s what The Bitcoin Monthly contained.

Featured Image by Maxim Hopman on Unsplash | Charts by TradingView

Ethereum Merge Fails To Move ETH Price, $2,000 Remains Elusive

The price of Ethereum continues to struggle below $1,600 despite the Merge being successful. As pointed out previously, the Ethereum Merge had looked to be a “buy the rumor, sell the news” event, which seems to be playing out, but the lack of highly fluctuating prices suggests that even the expected sell-offs seemed not to have happened. Instead, it looks to be that momentum is currently muted, making it impossible for the price to swing either way.

Merge Is Priced In

During the rallies that led up to the Ethereum Merge, there were debates on whether the upgrade had been finally priced into the value of the digital asset. At one point, ETH had rode the wave up to $2,000 but quickly lost its footing. Given this, it was a matter of what would be best for the digital asset.

Now, after the Merge has been completed, it seems more settled that the price had already been priced in. For market analyst Julius Baer, he says that the best-case scenario would have been for the Merge to end up being a non-event. If this is true, then the current resistance to any sort of significant movement on the part of the digital asset is a good thing. 

Merge fails to move ETH price | Source: ETHUSD on TradingView.com

However, it is concerning that such a highly anticipated event seemed to have no bearing whatsoever on the price movement of the digital asset. But the market decline that followed the release of the CPI data earlier in the week has likely led to fatigue in the market. 

Can Ethereum Rebound From Here?

Before the Merge, the price target from Ethereum had been $2,000, given the upward momentum that was recorded during that time. However, the dip in price has put the digital asset in an especially difficult position.

With the price dropping to the $1,590 territory, the cryptocurrency is unable to properly clear important technical levels like the 50-day moving average. Additionally, the 100-day moving average looks worse. This spells the likelihood of more bearish movement over the next week.

The sell-offs have also not eased over the last couple of weeks. Ethereum had recorded massive exchange inflows leading up to the Merge, bringing the 7-day inflow volume to $11.52 billion. This large inflow volume, coupled with the decline below the 50-day moving average, has caused the 50-day MACD to skew heavily towards the selling pressure.

The next major support level for the digital asset now lies at $1,500. However, a failure to properly hold this level will likely see Ethereum test the $1,300 territory once more. 

Featured image from CNBC, chart from TradingView.com

Follow Best Owie on Twitter for market insights, updates, and the occasional funny tweet…