Ethereum’s Wild Fluctuations: Here’s What ETH Implied Volatility Tells Us

The cryptocurrency market has recently exhibited distinct divergences in the behavior of its two leading assets, Bitcoin and Ethereum. While Bitcoin appears to be stepping into a phase of relative stability, Ethereum’s journey paints a contrasting picture of sustained uncertainty, particularly in its options market.

This divergence is highlighted by the sustained high levels of implied volatility associated with Ethereum options, signaling a cautious outlook among investors regarding its future price movements.

Ethereum Persisting Volatility: A Comparative Analysis

Implied volatility (IV) serves as a crucial indicator in the options market, providing insights into the expected price fluctuations of an asset over a specific period. It reflects the market’s temperature, gauging the intensity of potential price movements traders anticipate.

Recent analyses suggest that while Bitcoin’s implied volatility has settled down significantly post-halving, Ethereum’s has not followed suit. As Bitcoin’s IV dipped to a multi-month low, indicating a calming market, Ethereum’s IV remains stubbornly high.

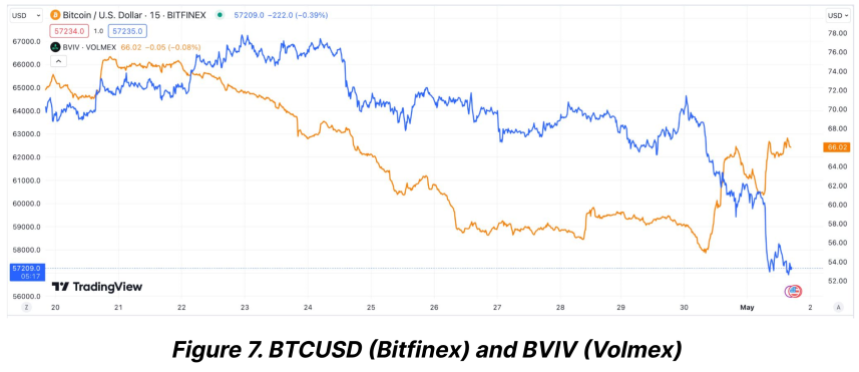
Contrary to the calming waves in the Bitcoin market, Ethereum wrestles with heightened volatility. According to data from Bitfinex Alpha Report, Bitcoin’s volatility index sharply declined from 72% at the time of its latest halving event to about 55%.

Bitcoin (BTC) implied volatility.

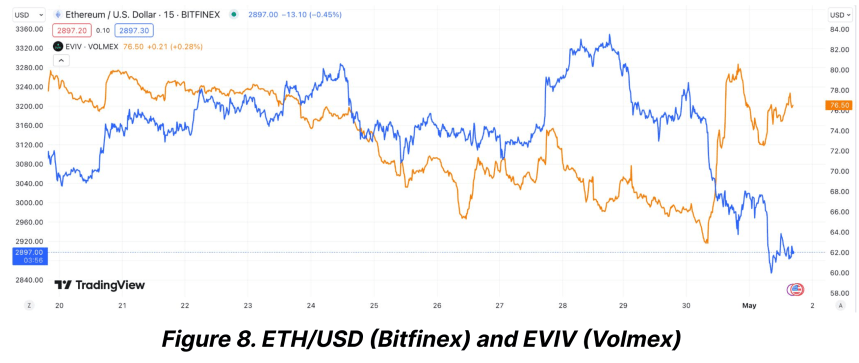
On the other hand, Ethereum saw a more modest reduction in its volatility index, dropping from 76% to 65% in the same period. This persistent volatility in Ethereum’s market is primarily fueled by uncertainties surrounding significant upcoming regulatory decisions and broader market implications.

Ethereum (ETH) implied volatility.

The Ethereum market is particularly jittery in anticipation of the US Securities and Exchange Commission’s (SEC) impending decision on two spot Ethereum ETFs, slated for late May 2024.

This upcoming regulatory milestone is considered a critical event that could either catalyze a major market move or exacerbate the current volatility.

The Bitfinex Alpha report underscores that regulatory uncertainty is a primary driver behind Ethereum’s less significant drop in its Volatility Risk Premium (VRP) compared to Bitcoin’s.

ETH And BTC Show Signs of Recovery Amid Volatility

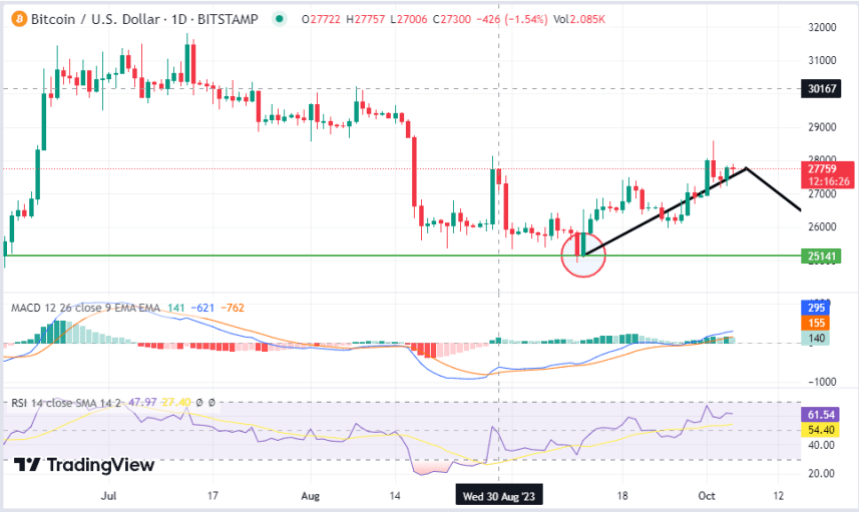
Ethereum and Bitcoin have shown signs of recovery over the past week in terms of trading performance. Bitcoin has seen a 4.1% increase, while Ethereum reported a more modest gain of 2.4%.

Ethereum (ETH) price chart on TradingView

However, the last 24 hours have been less favorable for Ethereum, with a slight dip of 0.7%, underscoring the ongoing volatility and investor caution.

Moreover, Ethereum’s network dynamics also reflect a subdued activity with a marked decrease in ETH burn rate attributed to reduced transaction fees.

This technical aspect further complements a cautious Ethereum market narrative, poised on the brink of potentially significant shifts depending on external regulatory actions.

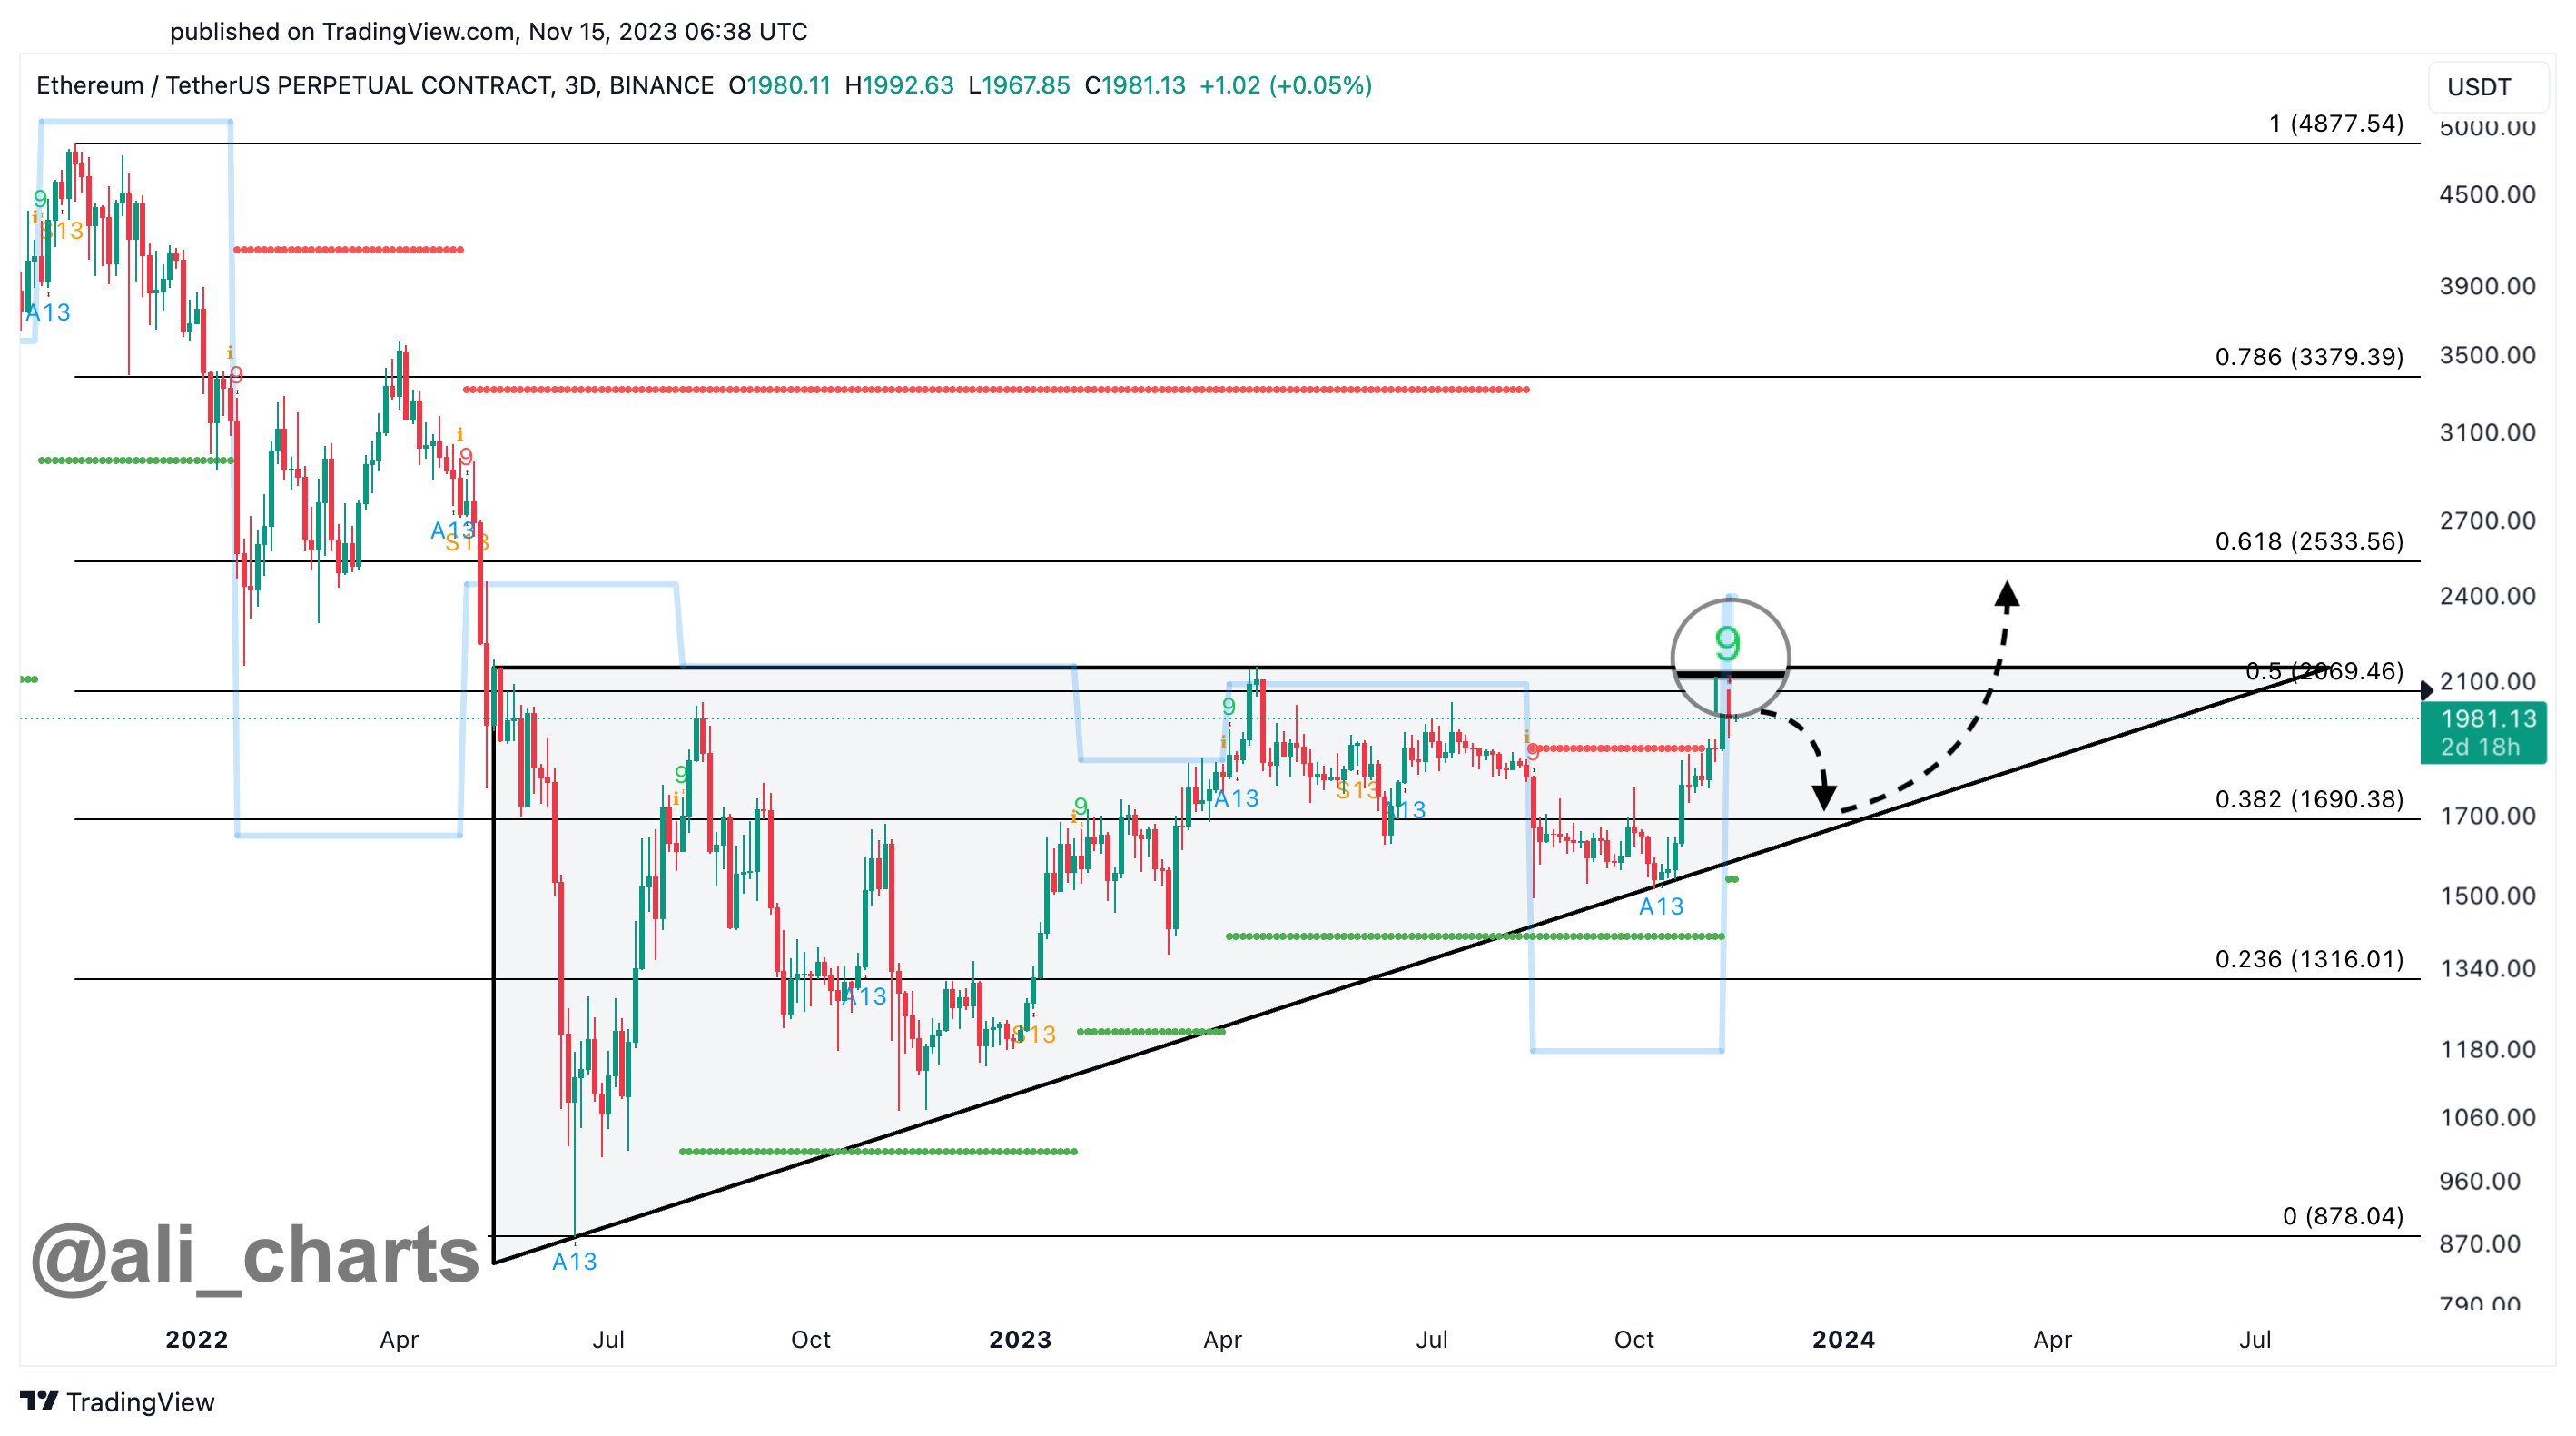
Despite all these, analysts like Ashcrypto suggest that the current volatility could set the stage for a strong rebound in the year’s third quarter. Drawing on historical patterns, Ethereum’s speculative forecast is potentially reaching the $4,000 mark, provided market conditions align favorably.

Featured image from Unsplash, Chart from TradingView

Ethereum’s Dive To 3-Year Low Against Bitcoin, Is This A Bear Trap? Trading Guru Weighs In

Trading Guru Peter Brandt has recently commented on the Ethereum vs. Bitcoin chart, offering intriguing insights into market developments.

Brandt’s remark comes after his prior critiques of Ethereum, denigrating it as a “junk coin” and its proponents as “Etheridiots.” However, amidst Ethereum’s recent descent to its lowest position against Bitcoin in nearly three years, Brandt’s stance seems to have transformed.

Ethereum Plunges Against Bitcoin: A Bear Trap?

Upon analyzing the Ethereum-to-BTC chart, Brandt suggested the presence of a “bear trap,” indicating that the ongoing decline in Ethereum’s value compared to Bitcoin might entice sellers into additional short positions.

However, this could lead to an unexpected reversal, turning the apparent breakdown in support into a false signal.

Brandt’s observation of a potential bear trap highlights the complexities within the cryptocurrency market and the importance of considering multiple factors when analyzing price movements.

While Ethereum may be experiencing a period of relative weakness against Bitcoin, Brandt’s cautious optimism suggests that there may be opportunities for a reversal shortly.

Bullish Signals Amid ETH/BTC Downturn

Despite Ethereum’s recent challenges, bullish signals have emerged, hinting at a potential turnaround. The options market, in particular, has shown optimism, with a significant portion of Ethereum options open interest expiring by the end of April being bullish bets on price.

Ethereum open interest by expiration.

Deribit data reveals that about $3.3 billion worth of notional ether options are scheduled to expire, with approximately two-thirds of this sum allocated to calls. Moreover, the Ethereum put-call ratio for the April expiration stands at 0.45, signaling a slightly more bullish stance than Bitcoin options.

Notably, a put-call options ratio below one suggests bullish sentiment, with traders favoring call options over put options. Moreover, the emergence of two new Ethereum whales, according to the crypto tracking platform Spot On Chain, identified as 0x666 and 0x435, adds to Ethereum’s bullish sentiment.

These entities collectively withdrew a substantial amount of ETH from a major exchange, suggesting growing confidence in Ethereum’s prospects despite its recent downtrend.

While Ethereum faces downward pressure against Bitcoin, Bitcoin’s resilience in the market is evident. Crypto analyst Ali has highlighted that Bitcoin appears to be breaking out, with a potential upside target of $85,000 if it can hold above $70,800.

When writing, Bitcoin trades above this critical level with a current market price of $71,621, indicating a possible climb towards $85,000 shortly.

Featured image from Unsplash, Chart from TradingView

Ethereum Faces Market Tremors As Celsius Offloads $1 Billion in ETH

Ethereum (ETH) is about witnessing a potential sell-off worth $1 billion. This significant transaction is rooted in actions by Celsius, a bankrupt crypto lender. Reports from on-chain analyst Lookonchain indicate that Celsius initiated the transfer of 459,561 ETH, estimated to be worth around $1.014 billion, to various exchanges.

The breakdown of this large-scale distribution includes 297,454 ETH ($656.5 million) moved to Coinbase Prime, 146,507 ETH to Paxos Treasury, and smaller sums totaling 7,800 ETH ($17.2 million) sent to FalconX and Coinbase, respectively. Despite this transfer, Lookonchain disclosed that Celsius still maintains a reserve of 62,468 ETH, valued at roughly $139 million.

This significant transfer carries significant weight in the Ethereum market. It poses a challenge as it exerts considerable pressure on Ethereum’s price, with potential implications for broader market sentiment. Ethereum could see a significant plunge if the $1.014 billion worth of ETH is sold simultaneously.

Celsius’ Previous Ethereum Transactions

Celsius’ latest Ethereum transactions aren’t isolated events. LookonChain has previously spotted significant transfers linked to Celsius, including a deposit of 13,000 ETH ($30 million) on Coinbase and 2,200 ETH ($5 million) to FalconX.

While these moves indicate Celsius’ proactive strategy in managing its financial challenges, they also signal potential volatility for Ethereum’s market value.

Furthermore, Arkham Intelligence reports that between January 8 and January 12, Celsius liquidated over $125 million worth of Ethereum. The primary objective of these sales is to fulfill obligations to creditors.

Dune Analytics also highlighted the pattern of large-scale Ethereum redemptions, noting redemptions exceeding $1.6 billion. Since last year’s Shanghai update, this figure represents the highest Ethereum redemptions recorded.

As part of its bankruptcy proceedings, Celsius continues liquidating Ethereum holdings to pay off debts.

Ethereum’s Market Reaction

In the aftermath of Celsius’s Ethereum transactions, the asset has seen a nearly 10% decline in value over the past week, dropping from a high above $2,600 to around $2,186 yesterday. However, Ethereum has slightly recovered, rising by 2.2% in the past 24 hours, with a trading price of $2,258 at the time of writing.

Ethereum (ETH) price chart on TradingView.com

Amid these market developments, Michael van de Poppe, a renowned crypto analyst, has identified three key factors that could signal a bullish phase for ETH. A significant element is Bitcoin’s market behavior, often setting the tone for altcoins.

Van de Poppe notes that Bitcoin’s indications of bottoming out usually precede rallies in altcoins, suggesting a potential upturn for Ethereum. He also emphasizes the increasing excitement around spot Ethereum ETFs, which could catalyze Ethereum’s market value in the coming weeks.

Additionally, Ethereum’s impending network upgrades, which aim to reduce transaction costs significantly, are expected to enhance the network’s efficiency and scalability, potentially boosting its market appeal.

Featured image Unsplash, Chart from TradingView

Ethereum’s Path To Recovery: Analyst Highlights 3 Key Factors Pointing To A Price Boom

Michael van de Poppe, a prominent crypto analyst, recently outlined three key factors that could herald a bullish phase for Ethereum, the second-largest crypto by market capitalization. One crucial factor he identifies is Bitcoin’s current behavior.

The analyst pointed out that as the market leader, Bitcoin’s recent signs of bottoming out tend to precede altcoin rallies, hinting at a potential upswing for Ethereum. Moreover, Van de Poppe highlights the growing anticipation surrounding spot Ethereum exchange-traded funds (ETFs).

According to Van de Poppe, the increasing buzz about these spot ETFs is a significant catalyst that could drive Ethereum’s value over the coming weeks.

Additionally, Ethereum is on the cusp of rolling out critical network upgrades. These updates, aimed at reducing transaction costs by up to 90%, are expected to improve the network’s efficiency and scalability significantly.

Latest Update On Ethereum Deacon Upgrade

Regarding updates, Ethereum’s development team is making strides with the upcoming Dencun upgrade, a significant “hard fork” that aims to enhance the blockchain’s efficiency.

Tim Beiko, a core Ethereum developer, updated the community earlier today on the progress. Dencun, which incorporates “proto-danksharding,” is set to reduce transaction costs on layer 2 solutions, making Ethereum more accessible and affordable for users.

According to the developer, the upgrade is scheduled to activate on the Sepolia testnet on January 30 and the Holesky testnet on February 7, with mainnet implementation following if these tests succeed.

Brighter Future Ahead

Despite these positive developments, Ethereum’s market performance mirrors the overall bearish sentiment in the crypto market, led by Bitcoin. ETH has seen a 13.7% decline in the past week, currently trading at $2,216.

Ethereum (ETH) price chart on TradingView.com

However, analysts like Van de Poppe urge caution, particularly regarding the impact of the Bitcoin spot ETF. While there may be short-term selling pressure, Van de Poppe remains optimistic about the long-term prospects.

The analyst suggests that the influx of new capital from diverse market participants could propel Bitcoin, and by extension, Ethereum, to new heights.

Featured image from Unsplash, Chart from TradingView

Ethereum’s Tipping Point: Analyst Warns Of Steep Drop To $2,000

Since Ethereum (ETH) peaked at $2,717 in the last two weeks, the asset has experienced a gradual decline, culminating in its arrival at a key demand zone, which could be instrumental in determining its imminent price trajectory, according to a prominent crypto analyst.

Critical Support Zone Flags Continuous Bearish Move

Renowned crypto analyst Ali has pinpointed a critical demand zone for ETH, ranging between $2,388 and $2,460. The resilience of this support level could pave the way for an upward trajectory, offering Ethereum a much-needed respite from bearish pressures.

However, should Ethereum falter, a bearish slide to the next major support level of around $2,000 may be imminent. Such a decline would represent a significant drop of nearly 20% from its current price around the $2,300 mark, posing a stern test for Ethereum’s market upward stability.

Over the past 24 hours, Ethereum has witnessed a noticeable 4.3% decrease in value, breaching Ali’s critical demand zone. Currently, ETH trades at $2,368, signaling a possibility of a further plunge from here.

Ethereum price chart on TradingView

This price dip is mirrored in Ethereum’s trading volume, which has seen a significant decrease from $19 billion last Monday to just over $10 billion today, indicating lesser trading activity and a shift in investor sentiment.

Ethereum’s Market Dynamics: Whales Buying Dip and Rising Dominance

The current market dip has not gone unnoticed by savvy investors. According to Lookonchain, a crypto analytics platform, a prominent Ethereum whale has capitalized on the opportunity, acquiring 3,600 ETH valued at around $8.9 million.

This strategic move is part of a larger pattern observed in the whale’s trading history, marked by buying low and selling high. This tactic has reportedly amassed profits estimated at $25.8 million.

Amid this bearishness, Ethereum has shown resilience in terms of market dominance. A recent report by analytics firm Santiment reveals that Ethereum’s market share, relative to the total crypto market capitalization, has surged by roughly 22.4% in just one week.

This growth is complemented by a significant increase in active Ethereum addresses, with an average of 89,400 new addresses joining the network daily, reaching a peak of 96,300 new addresses in a single day.

These figures suggest a growing interest and engagement in the Ethereum ecosystem despite the current market conditions.

Featured image from Unsplash, Chart from TradingView

Here Are The Most Bullish Predictions For ETH Price As Ethereum Dominance Rises Against Bitcoin

The sentiments around Ethereum look to be very bullish at the moment as the second-largest crypto token by market cap has seen its dominance surge against Bitcoin. Ethereum’s rise against the flagship crypto token is also significant, as crypto analyst Jaydee recently suggested that it could usher in the altcoin season. 

Bullish Predictions For Ethereum’s Price

Crypto analyst Ali Martinez recently highlighted the fact that Ethereum broke out from an ascending triangle on the weekly chart. According to him, the crypto token has its eyes on the $3,400 price level despite the short-term volatility. Backing Ali’s analysis, crypto analyst Mayne shared their belief that $3,400 remains a viable target for ETH’s price.

Interestingly, Mayne hinted that “ETH betas” could run alongside ETH when this significant price surge begins to happen. These ETH betas include tokens like the native tokens of Ethereum’s layer-2 networks Optimism and Arbitrum. 

Crypto analyst Ash Crypto also offered a bullish prediction for ETH’s price while commenting on the state of the market. He remarked that money was currently flowing from Bitcoin to Ethereum and that it shouldn’t be long before the latter trades above $3,200. 

ETH trading above the $3,000 price level looks to be the consensus going by these predictions. The CEO and founder of MN Trading, Michaël van de Poppe, had before now suggested that ETH was also going to rise above $3,000 on its way to $3,500. Then, Poppe boldly claimed that this price prediction would materialize in the first quarter of 2024.

Meanwhile, crypto analyst ColdBloodedShill stated in a recent X post that ETH is likely planning for higher prices as long as it remains above $2,400. The $2,400 price range looks to be an important support level as ETH looks to break out. Crypto analyst Bluntz Capital also highlighted that price range ($2,495 specifically) as he noted that there will be an eventual breakout as long as ETH holds above that level. 

Ethereum price chart from Tradingview.com

Conviction On Ethereum Getting Stronger

Market intelligence platform Santiment recently revealed that the number of new ETH addresses is on the rise as Ethereum continues to outperform Bitcoin. 89.4 thousand addresses are said to have been created daily during this stretch. This represents a significant increase from late last year, when 70.4 addresses were created daily in early November.

Santiment also added that ETH’s supply on exchanges had reduced drastically to 8.10%, almost getting close to its all-time low (since the opening week of trading) of 8.05%. Such a development usually suggests that ETH holders are looking to hold for the long term as they move their holdings to self-custody.

Crypto Analyst Unveils Bullish End Of Year Predictions For Ethereum

Crypto Expert Anthony Sassano has provided a bullish narrative for the Ethereum ecosystem. Based on this, he believes that Ethereum could hit a new all-time high (ATH) this year. The analyst also went as far as predicting what price level ETH could hit in particular. 

ETH Could Rise To As High As $10,000 This Year

Sassano stated that ETH could hit $10,000 if the Ethereum Spot ETF hype were to get “ahead of itself.” These ETFs are believed to be next in line for an approval order by the Securities and Exchange Commission (SEC). That could explain why the crypto expert has handpicked them as the catalyst for this massive increase in ETH’s price. 

Meanwhile, even if the $10,000 price level isn’t attained, Sassano believes that ETH could still rise to as high as $6,000 before the year runs out. Before making these price predictions, he had explained why he was so bullish on the Ethereum ecosystem. According to him, Ethereum is going to gain a lot of interest from institutions because of the yield it affords them. 

Ethereum, being a proof-of-stake network, provides an opportunity for investors to stake their ETH tokens and earn some rewards in return. This institutional interest in Ethereum is going to be further driven by the launch of Ethereum Spot ETFs, Sassano opined. He further suggested these yields will also give Ethereum an edge over Bitcoin. 

Interestingly, crypto analyst Altcoin Daily had before now stated that ETH hitting $10,000 was “programmed.” He alluded to the higher yields on the network as one of the reasons for his assertion. However, unlike Sassano, Altcoin Daily didn’t suggest a timeline for when the crypto token will hit this price level. 

Ethereum price chart from Tradingview.com

Is The Market’s Attention Turning To Ethereum?

ETH rallied following the SEC’s approval of the Spot Bitcoin ETFs on January 10, while Bitcoin didn’t see much action. That could suggest that the market was already turning its attention to the Ethereum Spot ETFs. It also shows that the Bitcoin market was likely already priced in before the approval came in. 

If that is the case, the second-largest crypto token by market cap could begin to post some major gains ahead of a potential approval of the Ethereum ETFs in May. This would be something similar to what happened with Bitcoin, which resurged on the back of rumors involving the Spot Bitcoin ETFs. 

At the time of writing, ETH is trading at around $2,580, down in the last 24 hours, according to data from CoinMarketCap. 

Ethereum’s Bullish Breakout: Analysts Predict Surge To $3,500 – Here’s Why

Ethereum, the second-largest crypto by market capitalization, is currently exhibiting signs of a bullish breakout, as observed by two prominent analysts in the crypto space. According to World Of Charts, Ethereum shows consolidation within a bullish pennant pattern.

This technical formation typically suggests continuing an upward trend in Ethereum’s case. According to the analyst, if Ethereum successfully breaks out of this pattern, it could surge toward a significant level of $3,500.

Crucial Resistance Zone: Ethereum Path To Breakout

Adding to World Of Charts’ optimistic outlook, crypto trader Skew has identified the $2,320–$2,382 range as a key resistance zone for Ethereum. This price range has historically acted as a barrier to Ethereum’s upward movement, with “numerous rejections” witnessed at these levels.

Skew emphasizes the importance of Ethereum closing above $2,400 on the 1-hour and 4-hour charts. This decisive move would breach the resistance zone and confirm Ethereum’s bullish momentum.

Skew also noted that technical indicators such as the Relative Strength Index (RSI) and stochastics still display significant momentum, supporting the potential for Ethereum’s continued upward trend.

Ethereum’s Solo Bull Run Amid Market Turbulence

Despite recent market turbulence, including the plunge of several cryptocurrencies, including BTC, following the Securities and Exchange Commission’s (SEC) fake spot ETF approval announcement, Ethereum has shown resilience and is currently in the green.

Over the past 24 hours, Ethereum has climbed by 5.5%, surpassing the $2,400 mark before a slight retracement to around $2,381 at the time of writing. This bullish trend is further supported by increased trading volume, which surged below $30 billion to approximately $39 billion in the past day.

Ethereum (ETH) price chart on TradingView

Skew suggests that Ethereum’s bullish momentum could receive an additional boost from the potential approval of a Spot BTC ETF. If such approval were to come to fruition, it could further support Ethereum’s upward trajectory.

This sentiment is echoed by Michaël van de Poppe, another renowned crypto analyst, who also foresees Ethereum’s approach to its 2022 low as a precursor to a potential breakout. Van de Poppe believes that Ethereum’s current positioning near last year’s low could be crucial in absorbing liquidity and fueling a bullish breakout.

Van de Poppe’s analysis highlights the broader market context, specifically the awaited decision on a spot Bitcoin ETF in the US. An approval, he predicts, could notably impact the ETH/BTC trading pair, potentially triggering a sharp price movement known as a liquidation candle.

Following this, Van de Poppe anticipates a significant reallocation of funds into Ethereum, accompanied by a bullish weekly divergence, propelling Ethereum onto an upward trajectory.

Featured image from Unsplash, Chart from TradingView

Ready For Liftoff: Ethereum Eyes Breakthrough As Analyst Signals Upward Trend

Ethereum (ETH) is currently at a crossroads that could define its trajectory in the coming weeks. Renowned crypto analyst Michaël van de Poppe has shared a notably bullish perspective, highlighting Ethereum’s approach to its 2022 low as a potential springboard for a breakout.

In his analysis, Van de Poppe underscores the importance of Ethereum’s current positioning, suggesting that its proximity to last year’s low could be a catalyst for absorbing liquidity and igniting a bullish trend.

Analyst’ Ethereum Bullish Projection Amid Market Movements

Van de Poppe’s forecast hinges on the broader market context, particularly the potential approval of a spot Bitcoin exchange-traded fund (ETF) in the US. Should this approval materialize, he anticipates a significant impact on the ETH/BTC trading pair, potentially leading to a liquidation candle – a sharp price movement.

Subsequently, Van de Poppe predicts a substantial shift in market dynamics with funds rotating into Ethereum. This move, he believes, will be accompanied by a “bullish weekly divergence,” setting Ethereum on an upward trajectory.

Meanwhile, Ethereum appears to be struggling to catch up with Bitcoin’s price performance. It recently surpassed the $2,300 mark, echoing Bitcoin’s surge above $47,000 – its highest since April 2022.

However, Ethereum has seen a slight retracement and is currently trading around $2,249. This slight dip comes amid a week when the asset experienced a 5.8% decline, contrasting with its significant trading volume surge from $13 billion last Tuesday to over $23 billion today.

Ethereum (ETH) price chart on TradingView

Upward Swing With Potential Spot Bitcoin ETF Approval

The critical factor in Van de Poppe’s analysis is the potential approval of a spot Bitcoin ETF in the US. The market is on edge, with major players like BlackRock leading the spot ETF race alongside others like Grayscale Investments, Valkyrie, and ARK 21Shares.

These firms have recently submitted updated 19b-4 filings for their proposed Bitcoin ETFs, with the market sentiment heavily leaning towards a positive outcome.

BlackRock, in particular, has stirred significant optimism in this spot Bitcoin ETF race. With an approval decision expected by January 10, tomorrow, such a development could bolster Bitcoin and catalyze a fund rotation into Ethereum.

Van de Poppe isn’t alone in his bullish stance on Ethereum. Crypto Tony, another prominent crypto analyst, shares a similar outlook. Tony posits that Ethereum’s path to a bullish phase could commence if it maintains above the key level of $2,130.

Currently trading above this crucial point, Ethereum’s stability at or above this level is considered a sign of market strength, potentially paving the way for future gains. Furthermore, a push towards and above the $2,500 mark could significantly bolster Ethereum’s bullish momentum, as highlighted by Crypto Tony.

Featured image from Unsplash, Chart from TradingView

Ethereum Poised For Breakout? Analyst Pinpoint Key Levels For Monumental Surge

So far, Ethereum appears to be showing signs of an impending bullish run, according to Crypto Tony, a renowned analyst in the crypto space. Crypto Tony suggests that Ethereum’s journey to bullish momentum could commence if it successfully maintains its position above the crucial level of $2,130.

Fortunately, the asset trades above this price level and appears to be climbing further above it, with its current trading price of $2,264 at the time of writing.

Key Levels For Major ETH Rally

The $2,130 price mark, as disclosed by Crypto Tony, is seen as a pivotal point for Ethereum, as maintaining this level could signal “strength and stability,” setting the stage for further gains.

This optimism further escalates should Ethereum reclaim the range high at $2,500, a price level Crypto Tony revealed that would reinforce the bullish sentiment in the Ethereum market. Notably, Crypto Tony’s bullish outlook aligns with the sentiments of other analysts in the crypto community.

For instance, Ali Chart, another notable crypto analyst, has identified $3,830 and $5,100 price levels as Ethereum’s following major targets based on the Market Value to Realized Value (MVRV) price bands.

For context, MVRV is a key on-chain metric or indicator that compares a cryptocurrency’s market value (market cap) to its realized value, offering an alternative approach to assess the network’s valuation by considering the price at which each unit last moved.

The MVRV ratio is a crucial indicator that can be utilized especially for gauging the relative valuation of a crypto asset like Ethereum. When the MVRV ratio is high, it often suggests that the cryptocurrency’s price may be overvalued, and when it’s low, the asset could be undervalued.

According to a chart recently shared by Ali Chart on X, Ethereum is currently on an upward trajectory, with the next significant MVRV Pricing Bands at 2.4 and 3.2. These levels indicate that Ethereum may become overvalued, correlating to Ali’s price targets for Ethereum at around $3,830 and $5,100, respectively.

Ethereum Whale Movements Backs Bullish Sentiment

Adding to the bullish sentiments are recent whale movements. Spot On Chain has disclosed that an Ethereum whale, identified as ‘0x931’, made a significant purchase of 21,192 ETH, valued at approximately $48 million, at an average price of $2,265.

This accumulation of ETH is a strong indicator of confidence in Ethereum’s future performance, as the whale has now held roughly 79,500 ETH since January 2023, sitting on an unrealized profit of $36.84 million.

Moreover, last week’s on-chain data from Santiment revealed that Ethereum’s largest private wallets now hold a record 56.25 million ETH, representing 46.8% of the crypto’s total circulating supply. This concentration of ETH in large wallets could be interpreted as a sign of long-term holding strategies among major investors.

Amid these developments, Ethereum has been showing signs of recovery from its recent retracement. Despite a week of decline, the altcoin is beginning to exhibit an upward trajectory, with a near 2% increase in the past 24 hours, trading at around $2,272.

Ethereum (ETH) price chart on TradingView

This recovery is further evidenced by a surge in trading volume, which has surged from a low of $11 billion last Monday to over $20 billion, indicating a possible increasing buying activity.

Featured image from Unsplash, Chart from TradingView

Ethereum’s 2024 Forecast: Analyst Predicts Major Surge Sparked By This Catalyst

As the crypto industry marches into 2024, Ethereum draws significant attention from analysts and investors alike. Amidst the swirling currents of the crypto market, Ethereum stands at the cusp of what some analysts are predicting to be a ‘transformative period.’

This anticipation stems from two crucial developments: an impending network upgrade and the potential approval of Ethereum-based spot ETFs, according to renowned analyst CryptosRUs.

Catalysts For Growth: Upgrades And Spot ETF Approval

The Ethereum network is gearing up for its next major upgrade, slated for January 2024. This upgrade, known in the crypto community as the Dencun Upgrade, is expected to usher in a range of enhancements to boost network efficiency.

Key among these improvements are features designed to shrink transaction fees on the Ethereum mainnet. This move could significantly ease congestion issues that have long been a concern for users and developers.

Additionally, modifications to smart contract operations and enhancements to staking protocols are on the cards, setting the stage for an optimized Ethereum ecosystem.

According to CryptosRUs, the anticipated Dencun Upgrade is not the only factor fueling optimism for Ethereum’s growth in 2024. The analyst has further highlighted the potential impact of approving a spot exchange-traded fund (ETF) for Ethereum.

Such a development could mark a pivotal moment for Ethereum, potentially driving widespread adoption and significant price appreciation.  The analyst points out that approving an Ethereum spot ETF could mirror the influence seen in other markets, substantially boosting investor confidence and market liquidity.

Regulatory Hurdles And Ethereum Growth Trajectory

So far, the path to a spot ETF approval appears to be intertwined with regulatory processes. The US Securities and Exchange Commission (SEC) has been extending its timeline for decision-making on both Bitcoin and Ethereum spot ETFs.

With numerous applications pending, the crypto market awaits the SEC’s verdict, which is anticipated to arrive in 2024. The SEC noted in a recent filing:

The Commission finds it appropriate to designate a longer period within which to take action on the proposed rule change so that it has sufficient time to consider the proposed rule change and issues raised therein.

Meanwhile, Ethereum’s performance continues to exhibit resilience and growth. Over the past year, Ethereum’s value has increased by 88.2%, with a continued upward trajectory evident in recent trading periods. At the time of writing, ETH has experienced a 5.3% surge in the last 24 hours, trading at $2,346.

Ethereum (ETH) price chart on TradingView

Furthermore, CryptosRUs analysis also extends to ETH, which has shown price movements analogous to Solana’s (SOL) recent surge. SOL’s value has soared by over 100% in the past month, leading the analyst to draw parallels with Ethereum’s potential price trajectory.

CryptosRUs suggest that ETH may exhibit a bull flag pattern as it heads into the upcoming upgrade and possibly spots ETF approval, mirroring Solana’s recent performance.

Featured image from Unsplash, Chart from TradingView

Ethereum To $36,800? Token Terminal Predicts When This Will Happen

Blockchain analytics platform Token Terminal has provided insight into the future trajectory of the second largest cryptocurrency by market cap, Ethereum (ETH). Interestingly, they predict that the crypto token could rise as high as $36,800.

When Ethereum Will Hit $36,800

In the research paper released by the platform, Ethereum is billed to hit the $36,800 mark by 2030. However, this prediction is made in the best-case scenario of 2030 being a bull market season. One of the ways in which they analyzed ETH’s future value was with the total Addressable Market analysis. 

They looked at the industries already adopting blockchains while forecasting how much of them will move on-chain by 2030. In line with this, they considered the role Ethereum could play in this in terms of tokenization. Token Terminal believes that all assets could be tokenized on the network, playing an integral role in the finance industry. 

The finance industry apparently does over $28 trillion in annual revenues at the moment and is growing at a compound annual rate of 7.5%. With this in mind, Token Terminal foresees that the finance industry and Ethereum could form a mutually beneficial relationship. For one, a majority of the liquidity in the industry could become consolidated on the Ethereum network


Etheeum $36,000

Alongside the prediction of $36,800 in 2030, the blockchain analytics platform projects that Ethereum could also enjoy an 80% market share among Layer 1 networks. The network could reach a monthly revenue of $109,668 in the best-case scenario (dependent on 2030 being a bull year).

Ethereum’s Price In The Next Bull Cycle

Meanwhile, Token Terminal also gave an insight into what Ethereum’s price could look like in the next bull run. According to the platform, the crypto token could rise to as high as $13,000 at the peak of the bull market. From their projection, the Bitcoin Halving is seen as a catalyst that could spark the next cycle. 

Ethereum

The next Bitcoin Halving is expected to take place on April 4, 2024. Based on Token Terminal’s analysis, Ethereum’s price could rise to $2,300 by then. From that moment, ETH is projected to see an increase of over 469% as it surges to over $13,000 at the peak of the next bull cycle. 

The future of Ethereum looks really promising based on these forecasts. Above all, Token Terminal expects the network to continue to dominate its competitors in terms of the economic opportunity on it. They predict that new use cases on Ethereum will spur it to “grow exponentially larger” in the coming years. 

Ethereum price chart from Tradingview.com

Ethereum Could Decline To $1,700 Based On This Pattern, Analyst Explains

An analyst has explained how a pattern forming in the 3-day Ethereum chart could signal that a decline toward $1,700 may be coming.

Ethereum Has Recently Formed A TD Sequential Sell Setup

In a new post on X, analyst Ali talked about a sell signal that has taken shape in the ETH 3-day chart. The relevant technical indicator here is the “Tom Demark (TD) Sequential,” which is used to spot reversals in the price of any asset.

The metric is made up of two phases; a setup phase and a countdown phase. In the former, candles of the same polarity are counted up to nine following a reversal in the price. Once the ninth candle is hit, the indicator signals a probable top or bottom for the asset (depending on whether the trend until now was towards up or down).

Once the setup is completed, the 13-candle-long countdown phase begins. At the end of these 13 candles, a potential reversal once again takes place for the asset.

Ethereum has registered a sharp rally recently, but according to the analyst, the cryptocurrency has now finished with the setup phase of the indicator, implying that the asset could be heading towards a period of downtrend.

The below chart shows this pattern in the 3-day price of the coin:

Bitcoin TD Sequential

In the same chart, the analyst has drawn an ascending triangle pattern for Ethereum. “Ascending triangles” are made up of two lines: one parallel to the x-axis drawn through the highs in the price, while the other is made by connecting higher lows.

Generally, the price feels resistance at the upper line and support at the lower one. A break out of either of these lines suggests a continuation of the trend: bullish in the case of a surge above the former, while bearish in the case of the latter.

From the graph, it’s visible that Ethereum has recently been retesting the $2,000 to $2,150 zone, which happens to align with the resistance level of this ascending triangle.

Thus, it’s interesting that the ETH TD Sequential setup phase has finished just as the coin has encountered this line that it has been rejected from in the past.

“A pullback from this resistance level could lead to a dip toward the triangle’s hypotenuse at $1,700, setting the stage for a potential uptrend continuation,” explains Ali.

The analyst also notes, however, that the $2,150 level could be one to keep an eye on as if the asset can see a 3-day candlestick close above this level in the coming days, the bearish outlook could be nullified.

ETH Price

Ethereum had risen above $2,100 recently, but the coin has seen some pullback in the past day, a potential sign that the sell signal may already be in effect.

Bitcoin Price Chart

History’s Warning: Is Ethereum Set For A Huge Plunge? Here Is What This Analyst Predicts

Ethereum (ETH) has maintained its spot as a leading altcoin. However, a recent analysis from Benjamin Cowen indicates that its journey, at least in comparison to Bitcoin (BTC), could have followed a better trajectory. 

In a space where past trends can sometimes indicate future outcomes, ETH’s price behavior, when viewed against BTC, offers a tale of potential concern.

Ethereum Stumbling Blocks In 2023

A leading voice in the crypto analytical community, Benjamin Cowen, expressed his lack of enthusiasm for ETH’s performance in 2023 during a YouTube video. The ETH / BTC valuation, a critical metric for gauging relative performance, is the bedrock for his statements.

According to his observations from monthly charts, Cowen’s analysis primarily orbits around the ETH / Bitcoin valuation, which has trended downwards.

Ethereum/Bitcoin (ETH/BTC) price chart on TradingView

The analyst cites patterns from 2019, a pre-halving year, where ETH’s value relative to BTC fell significantly. That year alone, the ETH / BTC valuation declined by about 49%.

According to the analyst, fast forward to 2023, and ETH’s comparative valuation has already plummeted by 20.56%. If Cowen’s prediction and the patterns from 2019 hold any water, Ethereum could be staring down a deeper abyss.

Yet, it’s not all bleak. Cowen remains measured, as he acknowledges the change the nature of “The Merge” brought on Ethereum’s ecosystem, believing it is a “game changer.” While Cowen wasn’t overly optimistic, the analyst refrained from forecasting ETH’s next moves, primarily due to the unpredictable ripple effects of The Merge.

The Merge: A Game-Changing Variable?

The Merge, a much-anticipated Ethereum upgrade, has already marked its influence on the ETH / BTC valuation. Ethereum’s weekly charts have been in a continuous downtrend following its implementation, creating further lows.

Ethereum/Bitcoin (ETH/BTC) price chart on TradingView

Cowen recognizes that The Merge, with its deflationary component, could mean ETH might not toe its historical line. This deflationary aspect could be Ethereum’s wild card, making its trajectory even more elusive.

Notably, while many parallels might be drawn between 2019 and 2023, such updates as The Merge means that Ethereum’s journey this year might still hold a few surprises.

Meanwhile, the Ethereum price against the US dollar has seen quite a bearish trend, particularly over the past week. The second largest crypto by market capitalization has plunged nearly 5% in the past 7 days, bringing its price to fall below $1,600 with a current trading price of $1,569.

Ethereum (ETH) price chart on TradingView

Featured image from Unsplash, Chart from TradingView

2024 Crypto Cliffhanger: VC Firm Co-Founder Warns of Bitcoin, Ethereum Collapse

In a recent post, investor Chris Burniske expressed the belief that a bottom is looming for the top cryptocurrencies. Burniske predicts that Bitcoin and Ethereum could dip as low as $20,000 and $1,000, respectively, with top altcoins, except Solana (SOL), hitting new lows.

Notably, BTC retraced from $28,000 to slightly above $27,600, with ETH seeing a similar decline in the past few days. 

Crypto Analysts Predicts Market Bottom Ahead Of Bull Run

According to the founder of Placeholder Capital, Chris Burniske, a bull market will likely begin soon. However, the analyst believes the upcoming bull run will be preceded by a bottom cycle in the present financial quarter (Q4 2023). Furthermore, Burniske believes that this bottom will lead to declining crypto prices. 

According to his analysis, fear is high but only temporarily, as sellers are exhausted. Burniske believes the predicted lows for the top cryptocurrencies will present attractive buying opportunities in preparation for the upcoming bull market.

The crypto analyst supported his predictions with Linear charts, stating that it is easy to spot tops and bottoms with such charts. For context, Linear charts show the change in the price of an asset. Burniske believes it is up to traders to choose their accumulation style with patience and persistence. 

What Lies Ahead For Bitcoin And Ethereum?

Bitcoin trades at $27,697, with a 0.56% price increase in the last 24 hours. Ethereum’s, on the other hand, is $1,639, with a 0.45% 24-hour decline.

Meanwhile, BTC has encountered stiff resistance at $28,000, leading to a decline to $27,000 in the last few days. The asset formed a bottom on the daily chart on September 11 before the buyers forced a price recovery. 

Although BTC recovered slightly, the sellers have continued to re-enforce the $28,000 resistance. If the selling pressure increases, a decline to the $25,141 support level is possible in the coming days. 

Bitcoin chart

Moreover, the green MACD Histogram bars have faded, confirming a drop in buying pressure as sellers reclaim dominion. Also, the RSI is dropping from the buy zone and displays a value of 61.54. 

If the RSI drops below 50, BTC may resume the downtrend in the coming days. If Bitcoin drops further, a bottom cycle will likely begin in the crypto market. 

The potential decline to the $25,142 support level could facilitate a bull cycle. The reason is that it presents an attractive entry level for the accumulation phase. 

Ethereum To Follow Similar Trend As Bitcoin

Also, ETH displays a similar price trend to Bitcoin, with a prominent dip likely to occur in the coming weeks. ETH is in a downtrend on the daily chart, forming lower lows as sellers continue to dominate the market. 

Ethereum chart

Based on its historical data, it formed a bottom on September 11, after a similar decline before rallying on September 12. Therefore, ETH will likely return to the $1551 support level to form a double-bottom pattern before another rally. 

Also, its Moving Average Convergence/Divergence (MACD) shows a weak buy signal with fading bullish histogram bars. Additionally, the Relative Strength Index (RSI) indicator displays a value of 49 and will likely drop to the oversold region. 

Based on ETH’s past price action, traders should expect further decline in the coming weeks before a recovery.

Bitcoin, Ethereum Show More Potential For Downside Despite Recent Bounce – Analyst

A prominent cryptocurrency analyst, Bluntz, has expressed skepticism about the recent uptrend that increased Bitcoin and Ethereum prices by more than 5%. The pseudonymous analyst told his over 224,000 Twitter followers that the flagship crypto assets may face more downturns. 

Applying the Elliott Wave theory in his analysis, Bluntz predicted that Ethereum is about to complete a five-wave pattern. According to him, Ethereum will decline to $1,450 on completing the wave pattern marked 1, 2, 3, 4, and 5.

Bitcoin And Ether Could Face More Downturn Before A Bounce

In Bluntz’s technical analysis, the five-wave chart pattern exists within a larger three-wave pattern marked A, B, and C. And this three-wave pattern is also on a downtrend. He noted that ETH and BTC must complete this wave pattern before a bullish upturn.

However, while this analysis projects a bearish trend for ETH and BTC, Bluntz believes there is potential for a bullish breakout. He said the theory becomes invalid if ETH breaks above $1,804 or Bitcoin surpasses the $28,770 price level.

Bluntz noted:

Invalidation of this thesis is if we break $1,804 for ETH or $28,770 for BTC as wave-4 can’t go within wave-1 territory,

BTCUSD price chart

Bears Intent On More Downturns For ETH And BTC; Any Hope For A Rebound?

Meanwhile, Bitcoin and Ethereum are exhibiting a slightly bearish outlook at press time. Bitcoin trades at $27,211, with a nearly 1% decline, while Ethereum price is down by 0.89%, at $1,704. Bitcoin had also been under bearish pressure over the past seven days after slipping off the $29,000 support level on August 16.

As the bears pressed on, the flagship cryptocurrency traded within the $26,000 price level, occasionally regressing to $25,900. The downturn was in tune with the bearish sentiment in the cryptocurrency market over the past few days.

However, on August 29, the news of the court ruling in favor of Grayscale Investment in its case against the US SEC broke out. This news generated a buzz in the crypto market, leading to an uptick in market capitalization. 

As a result, Bitcoin recorded a sharp spike that returned its value to the $28,000 price mark. At the time, BTC’s price surged 8%, climbing from a week low of $25,860 to a high of $28,010. But the bulls couldn’t sustain the momentum as Bitcoin quickly regressed, dipping to $27,394.

Bitcoin now consolidates around the $27,000 price zone, awaiting a bullish turn to trigger a rally. 

Ethereum Market Outlook

Ethereum also met a similar fate as Bitcoin, exhibiting the same chart pattern and price movement in the last week. The second-largest cryptocurrency by market cap remained on a bearish trend in line with the broader crypto market.

Ether’s price slipped off the $1,800 support on August 17, accompanied by a prolonged bearish momentum that pushed it to $1,600. 

Just like Bitcoin, Ethereum reacted to the brief market recovery, pushing above $1,740 on August 29. While ETH’s rally has relapsed, it maintains a price level above $1,700, holding over 2% of its past week’s gains. However, ETH’s latest strides suggest the bulls are up for a recovery.

Ethereum And Crypto Market Might See Higher Price Rallies This Month, Says Analyst

As September 13th, the date of the much anticipated Ethereum mainnet merge approaches, the crypto community believes it will determine the fate of both the Ethereum blockchain and the wider crypto ecosystem. However, there is another event set to take place on the same day that may impact the market, the release of the US CPI and inflation data.

Crypto Analyst: The Merge Will Not Impact The Fate of ETH And The Wider Crypto Market

The reputable crypto analyst, Cred, has evaluated the hype surrounding the upcoming Ethereum Merge event. He concluded that it would have no bearing on the crypto market and ETH price, whatever happens. 

Related Reading: Why Ethereum Price Longs Might Profit Ahead Of “The Merge”

The Merge is set to go live on the 13th of September after several test nets have successfully launched. It would finally ease the Ethereum Blockchain off its previous energy-intensive PoW consensus mechanism and onto the PoS mechanism with 99.95% less energy consumption.

The merge has already caused the price of ETH to spike over 40% from around $1000 to $1500 in July. Then it went from $1600 to $2000 mid-August when the final Goerli testnet ran successfully. Supporters of the Merge have proposed that when it completely rolls out, it will cause both ETH and the general crypto market to spike.

Ethereum’s price is currently trading above $1,600. | Source: ETHUSD price chart from TradingView.com
The Real Game Changer: CPI And Inflation Data Publication

However, according to Cred, the actual event that would make the difference, happening the same day, is the release of the latest inflation data. 

The US Consumer Price Index (CPI) publication and inflation data are also going live on the 13th of September. If the Fed softens its stance and goes dovish, things will look up for ETH and crypto in general. If the Federal Reserve retains its hawkish outlook or stays neutral, the crypto winter might tarry longer. 

Cred: The Market Will Credit The Wrong Catalyst

However, the analyst predicts that the crypto community will likely credit the Ethereum Merge for whatever happens rather than examining macroeconomic data. That’s because the last time that ETH rallied was due to the “big counter-trend rally in stocks” caused by “macro” that bounced into Ethereum. Cred believes the same will happen in the merge coinciding with the inflation data print.

Related Reading: Why Extreme Fear Is Back In Crypto In A Big Way

According to the crypto analyst,

“if ETH dumps, as a result, everyone will say, ‘Oh look well the merge is priced in. It was obvious.’ If ETH doesn’t dump; as a result, people will say, ‘The merge wasn’t priced in, and it’s just the start.’”

Either way, Cred believes it is a false causality. 

Per CoinMarketCap, Ethereum is currently trading at around $1,500.

Featured image from Pixabay and chart from TradingView.com

Experts Say Ethereum Will Grow 100% To Hit $5,783 By Year-End

Ethereum remains one of the most successful cryptocurrencies in the market, although its current price does leave a lot to be desired. It has not been spared from the general market downtrend that has rocked the crypto space and has since lost its footing above $3,000, a crucial point for the digital asset. Nevertheless, it seems the future is not at all gloomy for the second-largest cryptocurrency going by reports from a Finder’s panel.

Ethereum To Surge 100%

A recent Finder’s panel made up of industry experts has released an extremely bullish long-term outlook for the cryptocurrency. The panel which took part in the quarterly survey from Finder consisted of 36 industry experts who shared their forecasts for the digital asset. According to them, Ethereum may very well still be in the early stages of its growth price-wise.

The digital asset which is currently trading a little above $2,800 received some of the best feedback and the consensus was that there is much growing to do in 2022 alone. They put forward that ETH will see another 100% growth this year that would see its price hit as high as $5,783 before the year runs out. 

Related Reading | Brace For Impact: A Dot Com Magnitude Crash To Rock The Crypto Market?

“Ethereum will jump from its current price of US$2,810 to US$5,783 by the end of 2022,” the panel said. “The price is expected to continue to rise going forward, hitting $11,764 by 2025 and $23,372 by 2030.”

Despite the bullish outlook for the altcoin going from current perspectives, it is more bearish compared to the previous predictions. The panel had previously put Ethereum’s price at $6,500 by the end of the year 2022, but the recent quarterly report has seen them adjust this prediction by about 10%. Nevertheless, it remains a good outlook for the digital asset.

Not everyone shared the bullish outlook for ETH though. One expert, John Hawkins, senior lecturer at the University of Canberra, said he sees the digital asset ending the year below $2,000.

ETH price trending at $2,800 | Source: ETHUSD on TradingView.com
How This Will Happen

There are a lot of predictions going around for Ethereum which all hinge on the upcoming upgrades on the network. The move to the consensus layer that will see the network move to the proof of stake mechanism is an upgrade that is anticipated to bolster the value of the token and Finder’s experts seem to think so too.

Keegan Francis who is the global cryptocurrency editor at Finder explained that for him, the long-term outlook for the cryptocurrency remains pretty bleak until the upgrades are carried out. With this would come the ability to scale for the network. However, Francis added that people will continue to buy the cryptocurrency due to “hype, promise, and potential.”

Related Reading | TA: Ethereum Shows Positive Signs But This Resistance Is The Key

The network still remains the leading DeFi platform. But with it losing so much market share to competitors, the cryptocurrency editor does not have a lot of confidence right now. “Ethereum is at a very uncertain place in its journey at the moment,” Francis explained. “It is currently losing DeFi (decentralized finance) market share to its competitors.”

Ethereum continues to trade above $2,800 in the early hours of Tuesday. Its price is up 0.15% in the last 24 hours to be trading at $2,843 at the time of this writing.

Featured image from CoinQuora, chart from TradingView.com

Ethereum Is Ready For Inevitable Climb Over $10,000, Says Crypto Analyst

The year has come with a lot of optimistic predictions for the price of the second-largest cryptocurrency by market cap. Its current trends have seen analysts put the digital asset at above $10,000 by the end of the year. And now, another crypto analyst, Lark Davis, has echoed what his counterparts have been saying in regards to the altcoin.

Lark believes that Ethereum breaking above $10,000 is inevitable and only a matter of time. Saying that the digital asset is poised to grow 190% would see it break this price point. The crypto analyst lays out his analysis on his YouTube channel, which currently has over 433K subscribers. In the video, Lark says that this price is already “programmed in” and adds that “it’s coming.”

Declining Ethereum Exchange Reserves

Lark starts out his analysis by pointing to the depleting supply of Ethereum. More specifically, the exchange supply of Ethereum being low such that there isn’t a lot of ETH waiting to be sold as the price goes higher. This is evident in the recent volume of ETH being withdrawn from exchanges. Recently, Ethereum saw record volumes being taken out of exchanges as 1.2 billion worth of ETH had been withdrawn from centralized exchanges last week in the space of 24 hours.

Related Reading | Ethereum Sees Record Daily Volume Withdrawn From Centralized Exchanges

The analyst points out that the decline in the available supply of Ethereum is leading to a supply-side crisis. Bulls have accumulated some of their biggest bags so far and will most likely not be dumping their bags soon. More often than not, waiting for the price of the asset they invested to 5-10X before they think about dumping their bags. So these long-term holding is creating a supply shock for Ethereum.

ETH price struggles with new week opening | Source: ETHUSD on TradingView.com

Comparing the supply to last year, Lark notes that the exchange supply continues to drop dramatically, save for a few spikes. While supply outside exchanges grows as people move their coins out of exchanges to use for other activities like staking. Comparing the charts and movement, Lark points out that while the supply drops, the price of Ethereum rose with this decline. This trend is similar to the current trend of Ethereum. Exchange supply has fallen and if history repeats itself, this puts the market close to testing another price discovery for the digital asset.

ETH Burn Is Rocket Fuel For Price

Crypto analyst Lark Davis brings to the forefront of the ETH burn. With over 300,000 ETH already burned in just six weeks after the upgrade, amounting to over $1.1 billion, Lark sees about 1 million ETH being burned by the end of the year. This is adding to the supply shock currently expected to come. With less ETH coming into circulation, supply is going to dwindle.

Related Reading | TA: Ethereum Plunges to $3,150: Can Bulls Save the Day?

Lark refers to this rate of burn as “rocket fuel for price appreciation.” This amount of Ethereum being burned gives credence to Lark’s prediction for a 190% increase in the price of ETH, which would lead to the altcoin breaking the $10,000 price point.

Finally, Lark points out that the big money is starting to notice Ethereum. An example of this is Cathie Wood revealing her firm, ARK Invest, has gained more confidence in the asset, explaining that they would split their crypto bags into 40% ETH and 60% BTC. This interest from institutional investors will be the driving factor for Ethereum towards $10,000.

Featured image from CryptoPotato, chart from TradingView.com