Ethereum Burn Rate Hits Yearly Low: What This Means For ETH’s Future

In recent weeks, Ethereum has displayed subtle signs of recovery amidst a generally bearish crypto market, with the altcoin mimicking Bitcoin’s modest uptrend.

Despite Ethereum’s price increasing slightly by 0.2% over the last 24 hours, a parallel trend that might significantly affect Ethereum’s economic model has been unfolding beneath the surface.

Decline In Network Activity Reduces ETH Burn

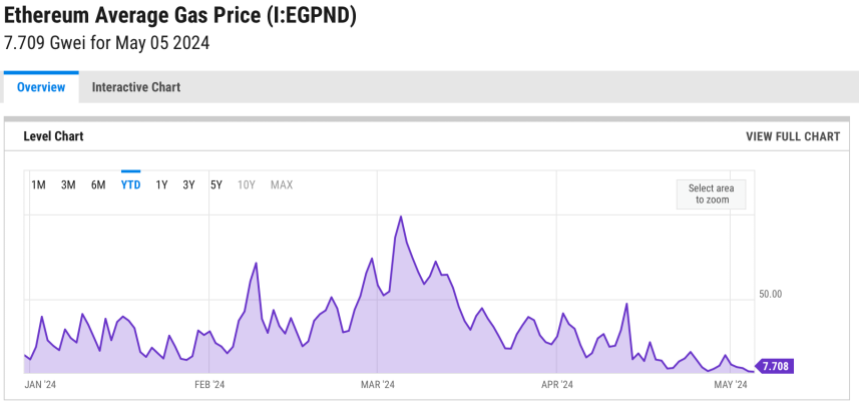
April witnessed Ethereum’s ETH burn rate hitting an annual low, primarily due to a significant decrease in network transaction fees.

These fees have typically fluctuated just below 10 gwei this year, but recent weeks have seen them dip to some of the lowest levels, directly influencing the rate at which ETH is burned.

Ethereum Average Gas Fee.

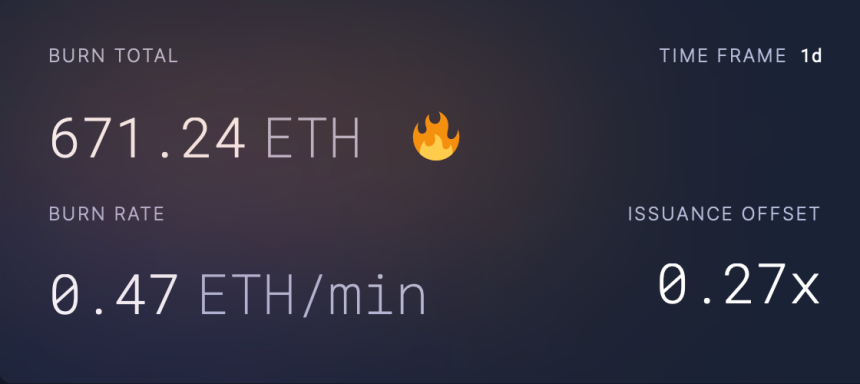
This reduced burn rate is evidenced by the stark drop in daily burned ETH, which reached a low of 671 ETH in the past day a notable decrease from the daily figures of 2,500–3,000 ETH seen earlier in the year.

Ethereum Burn Rate in the past day.

Such a decline in burn rate is not merely a statistical anomaly but a reflection of broader shifts within the Ethereum network.

A significant factor contributing to the lowered gas fees is the increased migration of network activities to Layer 2 solutions, which enhance transaction speeds while lowering costs.

Moreover, innovations like blob transactions, introduced in Ethereum’s recent Dencun upgrade, have further optimized costs on these secondary layers.

Notably, Blobs are a feature introduced to enhance Ethereum’s compatibility with Layer 2 solutions like zkSync, Optimism, and Arbitrum by efficiently managing data storage needs. This functionality is part of the Dencun upgrade, which integrates proto-danksharding via EIP-4844.

While beneficial in reducing transaction fees, these technological strides pose challenges to Ethereum’s deflationary mechanisms.

This upgrade introduced a new fee structure in which a part of every transaction fee, the base fee, is burned, potentially reducing the overall ETH supply. However, with decreased transaction fees, the anticipated deflationary pressure via burning has softened, signaling a shift to a more inflationary trend in the short term.

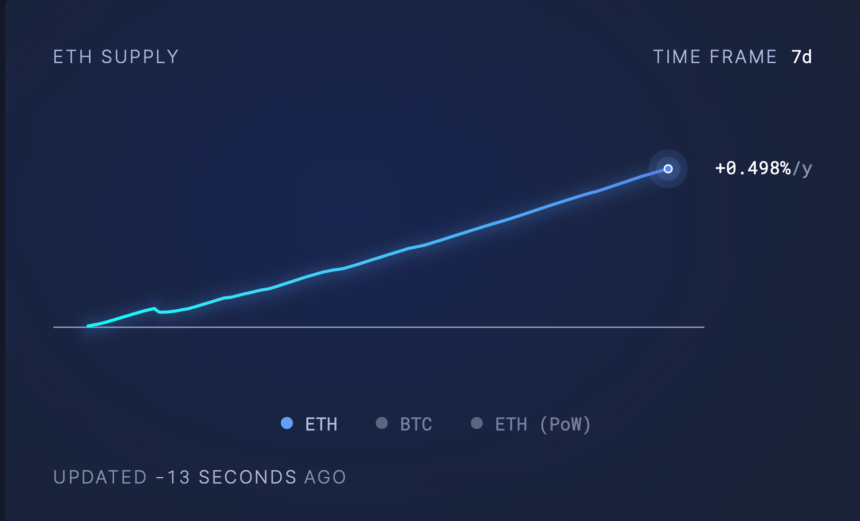
According to Ultrasoundmoney, Ethereum’s supply dynamics have swung to a mildly inflationary mode with a growth rate of 0.498%. This shift could realign if network activity intensifies, leading to increased transaction fees and, consequently, higher burn rates.

Ethereum supply growth rate.

Ethereum Market Response

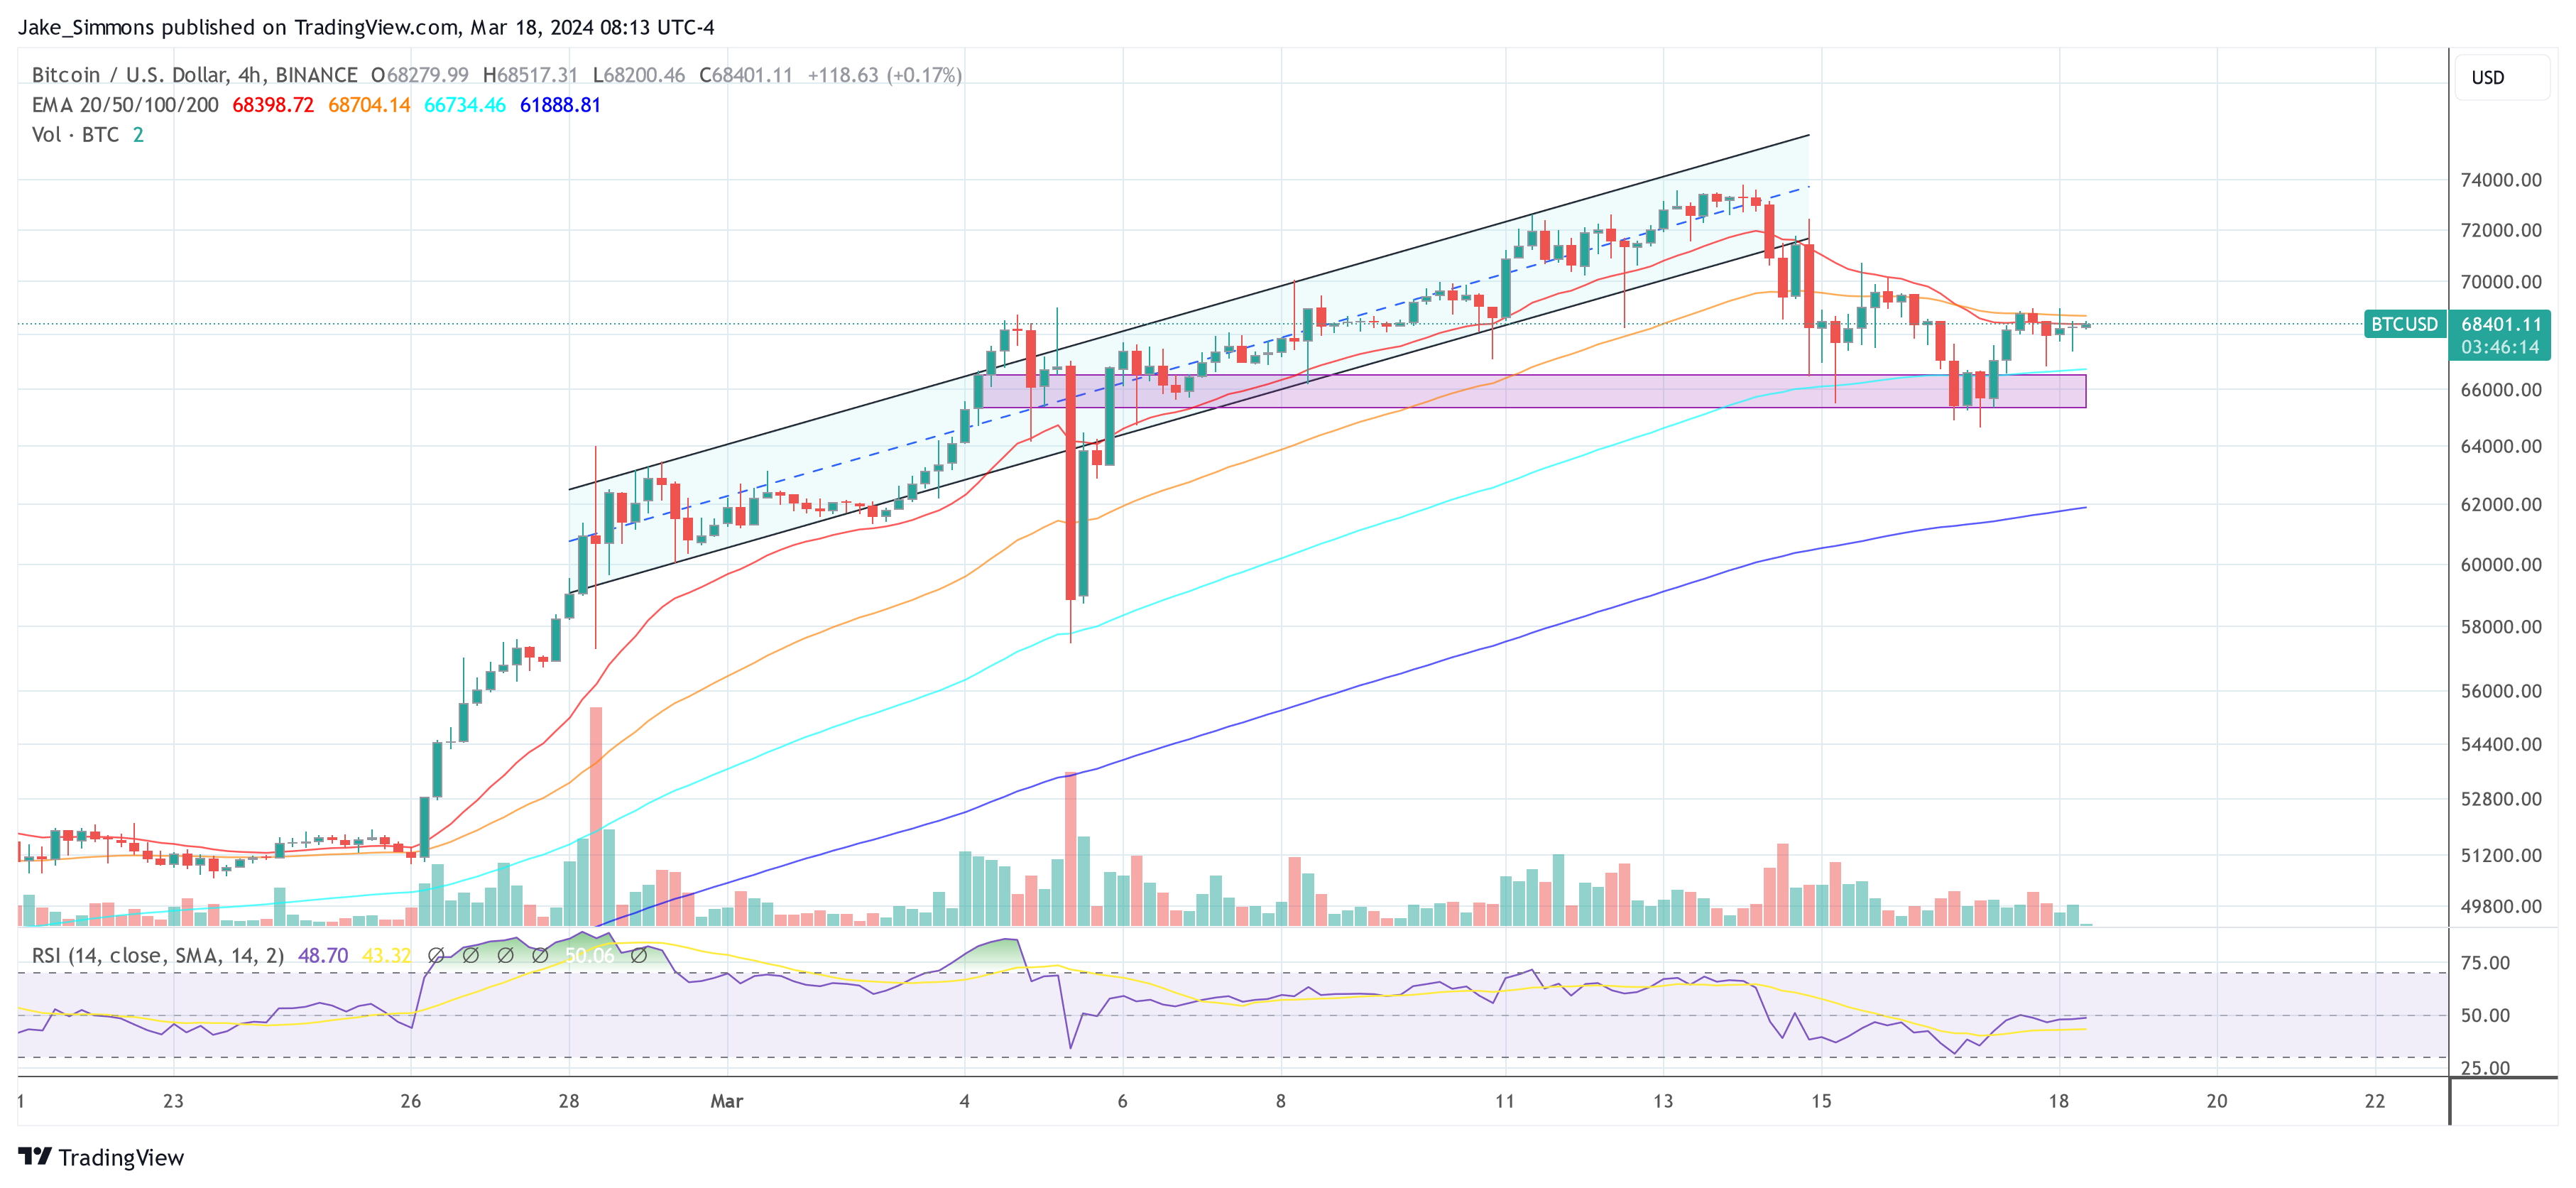
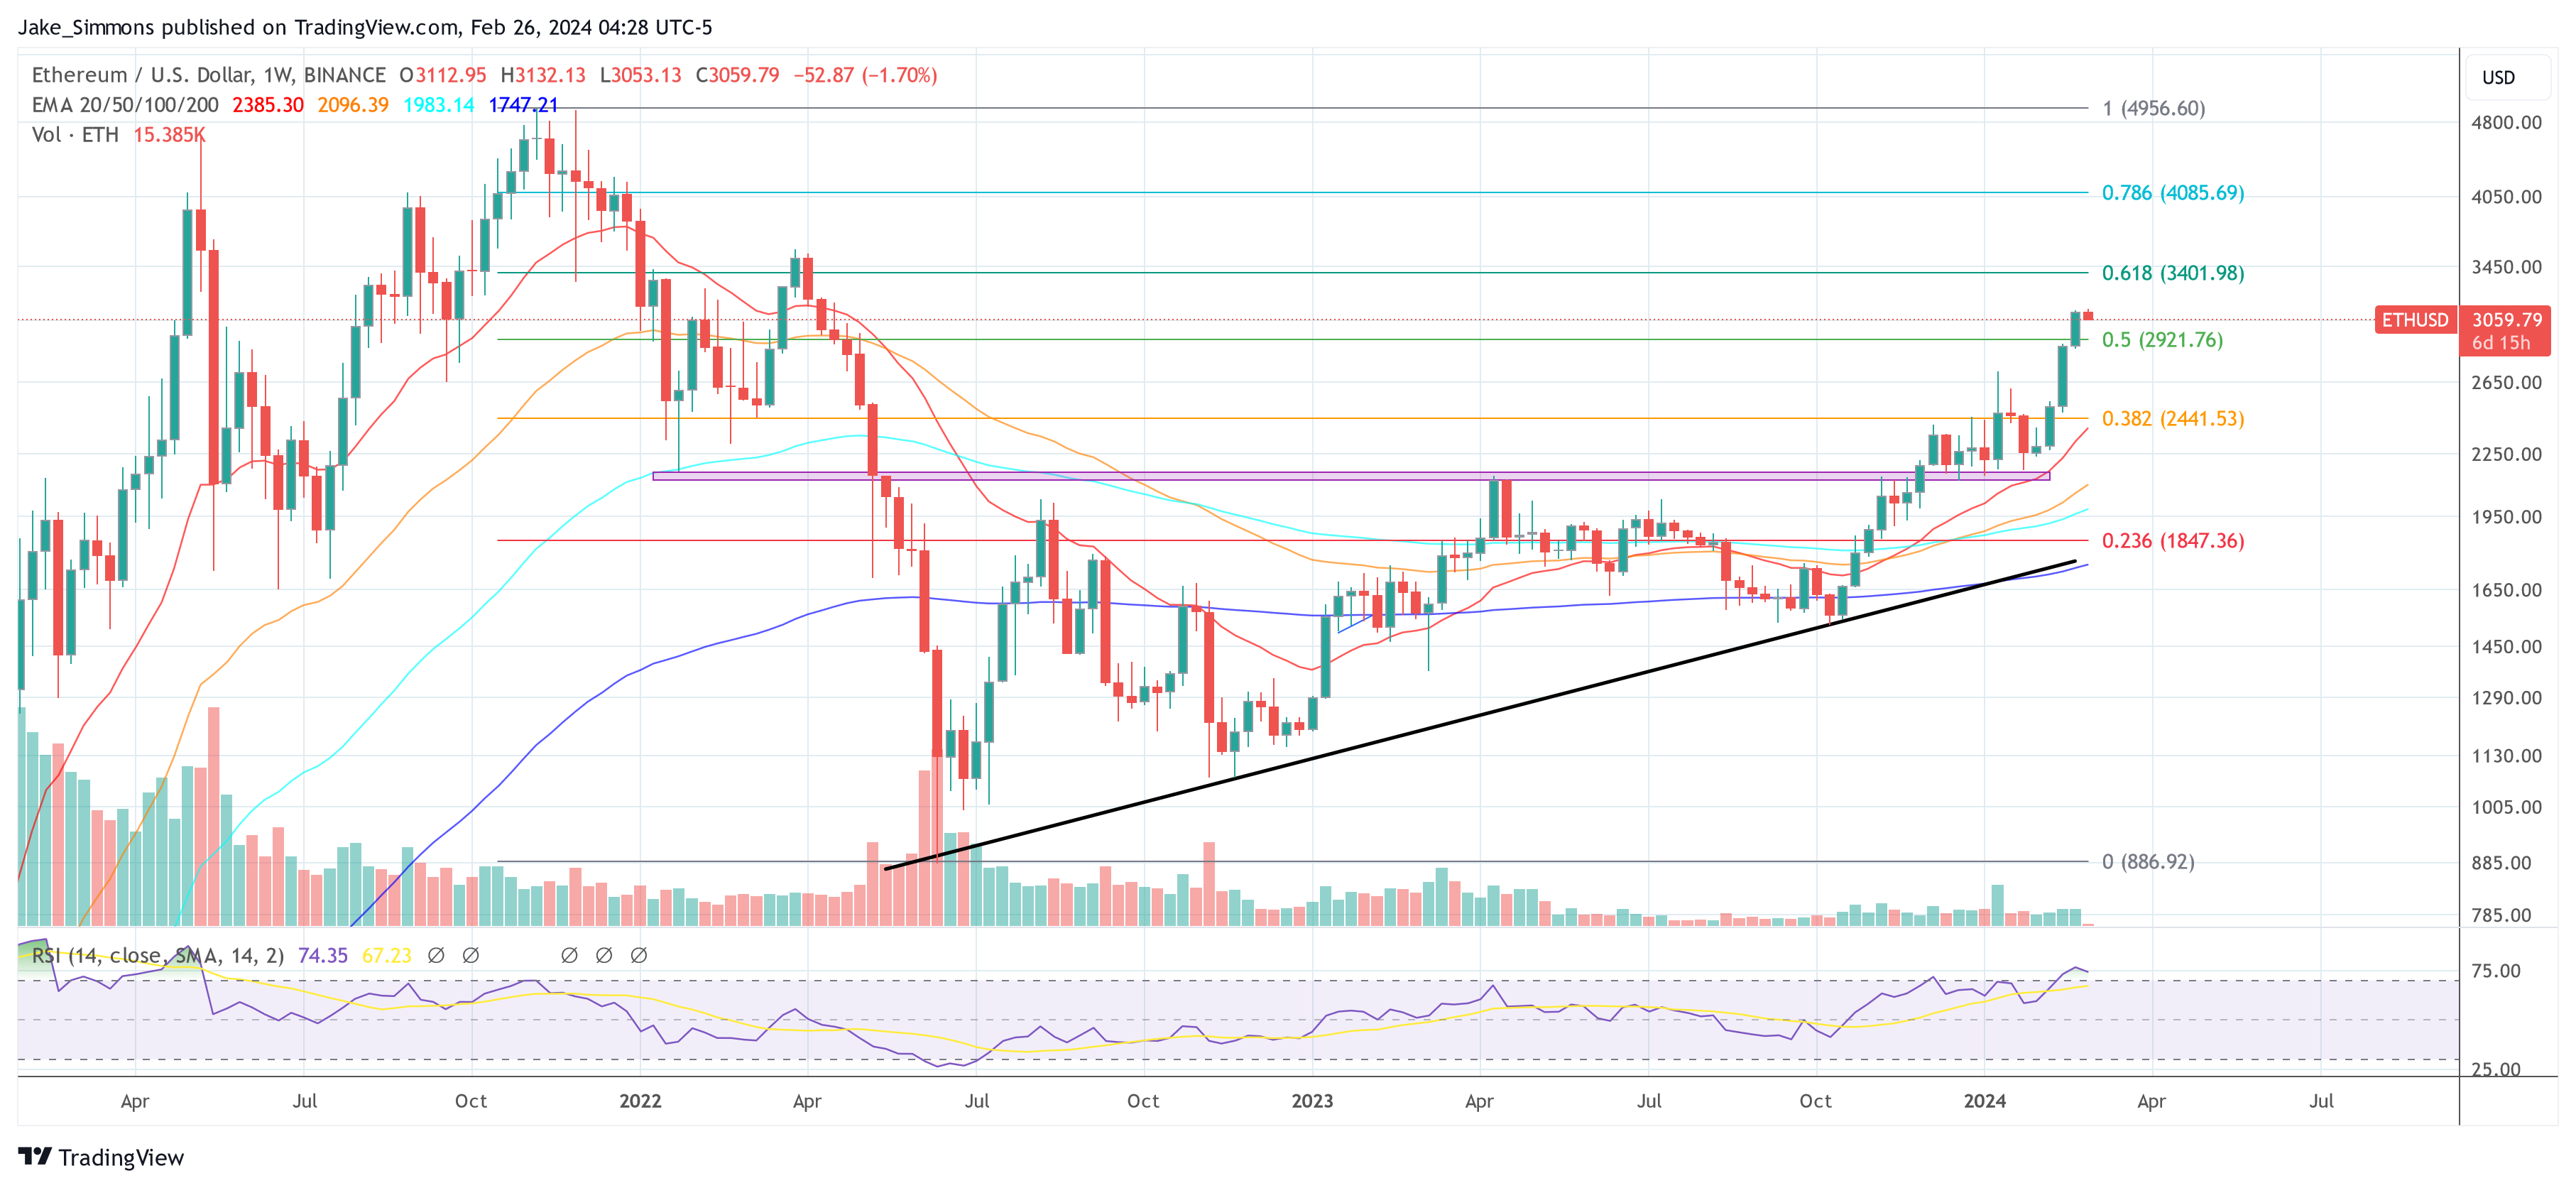
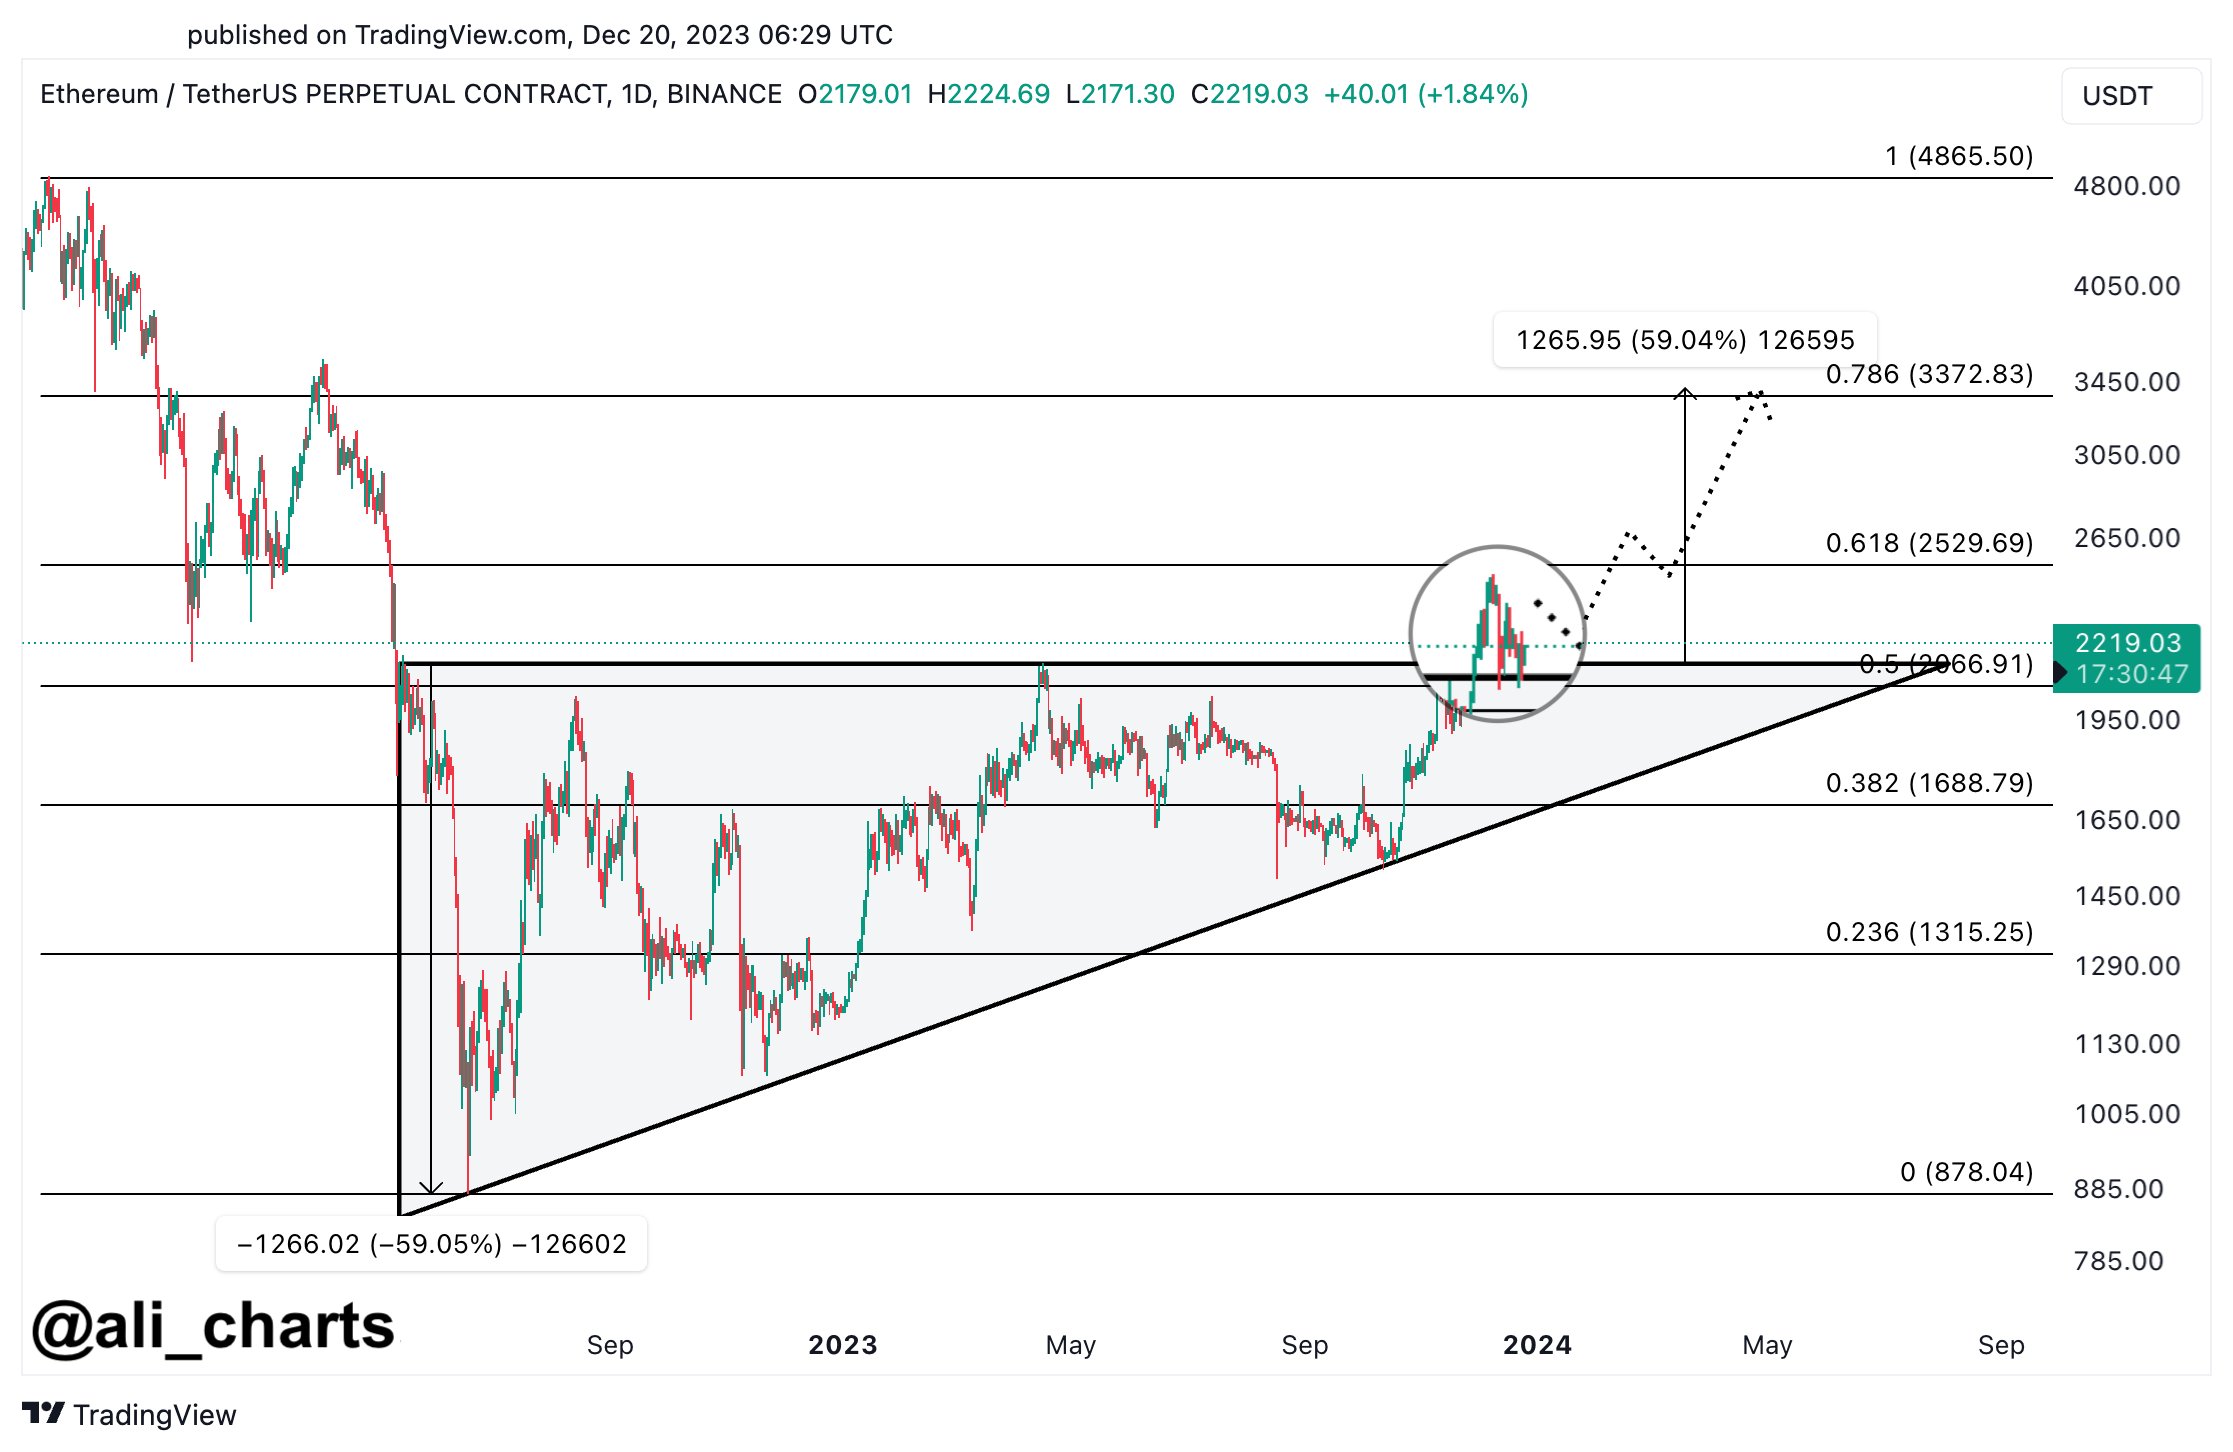
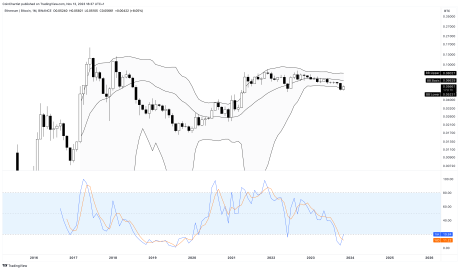
Despite these underlying network dynamics, Ethereum’s market price has struggled to regain its former highs above $3,500. The asset trades around $3,085, reflecting a slight downturn over recent weeks.

Ethereum (ETH) price chart on TradingView

This price behavior underscores the broader market’s reaction to internal network changes and external economic factors, such as regulatory struggles from the US Securities and Exchange Commission (SEC) and macroeconomic uncertainties.

Looking ahead, the trajectory of Ethereum’s gas fees and subsequent ETH burn rate will be crucial in determining the sustainability of its economic model.

Featured image from Unsplash, Chart from TradingView

Standard Chartered Predicts Bitcoin At $150,000, ETH At $8,000 By Year-End

Standard Chartered’s latest research notes offer a very bullish outlook for the major digital assets, Bitcoin (BTC) and Ethereum (ETH), by the end of 2024 and beyond. The bank’s analysts project Bitcoin could reach $150,000, while Ethereum could hit the $8,000 mark.

These projections come amidst a backdrop of significant developments in the crypto space, including the launch of Bitcoin spot Exchange-Traded Funds (ETFs) and Ethereum’s recent Dencun upgrade.

Bitcoin’s Path To $150,000

The bank’s research delves deep into the factors propelling Bitcoin’s potential surge to $150,000 by year-end. Central to this projection is the influence of Bitcoin spot ETFs, which, since their launch on January 11, have seen rapid inflows exceeding increases in open interest.

According to the bank, this suggests a more robust and sustainable positioning for Bitcoin, distinct from previous speculative peaks. “Rapid inflows to the new Bitcoin (BTC) spot ETFs have dominated […] Most of the inflows are likely to be sticky pension-type flows,” Geoff Kendrick and Suki Cooper elucidate, highlighting the newfound stability in Bitcoin investment trends.

Three pivotal analyses form the cornerstone of Standard Chartered’s Bitcoin valuation:

  1. Gold Analogy: Drawing parallels with the gold market’s response to the introduction of US gold ETFs, the bank estimates Bitcoin could rise to the $200,000 level, marking a 4.3x increase from its pre-ETF price.
  2. Two-Asset Optimization: By optimizing a portfolio with 80% gold and 20% Bitcoin at current gold prices, the analysis suggests a Bitcoin level around $190,000.
  3. ETF Inflows Correlation: Linear extrapolation based on the correlation between ETF inflows and Bitcoin price points to a possible $250,000 level, assuming total ETF inflows around the bank’s midpoint estimate of $75 billion.

Standard Chartered notes that these three measures suggest “that $200,000 is the ‘correct’ end-2025 price level for BTC, […] and that it is likely to be the new midpoint for a sideways trading range at that time.”

Further the research notes that an “overshoot to $250,000 is likely at some point in 2025 if ETF inflows continue apace and/or reserve managers buy BTC.” Previously, the bank only predicted a Bitcoin price of $100,000 by the end of 2024.

Ethereum’s Road To $8,000

Ethereum’s expected climb to $8,000 by the end of 2024 is anchored in two transformative developments: the Dencun upgrade and the expected approval of ETH spot ETFs. The recent Dencun upgrade, by significantly lowering transaction costs on layer 2 blockchains, enhances Ethereum’s competitive edge.

“Ethereum (ETH) has just undergone the ‘Dencun’ upgrade, which dramatically lowers the cost of transactions […] making ETH more competitive,” the research notes.

The forecast also hinges on the anticipation of US SEC approval for ETH ETFs by May 23, a decision poised to catalyze substantial inflows into Ethereum. Drawing from the Bitcoin ETF experience, Standard Chartered expects similar enthusiasm for Ethereum, with projected inflows of 2.39-9.15 million ETH (equivalent to roughly $15-45 billion).

This substantial capital infusion is seen as a crucial lever for Ethereum’s price surge. “We expect significant ETF-driven inflows to ETH […] This could drive ETH to the $8,000 level by end-2024,” the bank elaborates, underscoring the parallel potential for growth akin to Bitcoin’s trajectory.

The Prognosis For 2025 And Beyond

Looking further ahead, Standard Chartered ventures into the terrain of 2025 predictions, where the bank sees the ETH-to-BTC price ratio ascending back to the 7% level, a hallmark of the 2021-22 period.

This adjustment forecasts an Ethereum price of $14,000 by the end of 2025, given the projected Bitcoin level of $200,000. Such a scenario underscores the bank’s optimism about the enduring value proposition and growth potential of these leading digital assets in the medium term.

At press time, BTC traded at $68,401.

Bitcoin price

Can Ethereum Touch $4,000? Crypto Analyst Says ETH Rally Far From Over

Like Bitcoin, Ethereum has also picked up steam, with the second-largest crypto token crossing the $3,000 resistance level for the first time since 2021. Interestingly, this crypto analyst believes the rally is far from over, as he highlighted a key price level that ETH could hit soon enough. 

Ethereum Could Rise To As High As $4,000

Crypto analyst Altcoin Sherpa suggested in an X (formerly Twitter) post that Ethereum could rise to as high as $4,000. His prediction looks feasible when one considers crypto analyst Bitcoin Ape’s recent analysis of Ethereum from a technical analysis perspective. 

In his X post, Bitcoin Ape noted that the ADX (average directional index) indicator is currently “very high,” signalling that ETH’s bullish trend is strong. Indeed, this bullish momentum might be very strong as the crypto token has since crossed the $3,130 price level, which Bitcoin Ape highlighted in his post as ETH’s new resistance level

Interestingly, the analyst noted that Ethereum had already faced four resistance levels in February alone and has so far broken all of them, having also crossed the $3,130 mark. Although Bitcoin Ape failed to give his short-term prediction for ETH, he expects the crypto token to hit its all-time high (ATH) of $4,891 when the bull run returns in full force.  

Meanwhile, Altcoin Sherpa isn’t the only one who believes that ETH could rise to $4,000 soon enough. Standard Chartered Bank had also predicted that the crypto token would hit this price level by the time the Spot Ethereum ETF is approved in May. 

Crypto analyst Rager also recently gave a bullish prediction for ETH’s price, although he put his short-term target at $3,500. However, he added that this price level is only the beginning, stating that it isn’t the “peak high by any means.”

Ethereum’s Rally Not Hinged On Bitcoin’s Success

There is reason to believe Ethereum’s current bullish momentum isn’t due to Bitcoin’s price surge, as the Ethereum ecosystem also has narratives that may be driving ETH’s rally. For one, the Ethereum network’s ‘Dencun’ upgrade is set to take place on March 13. This much-anticipated event is significant as it would usher in advancements in the scalability, security, and usability of the Ethereum network.

Meanwhile, talks about a Spot Ethereum ETF likely being approved in May have created a lot of excitement for investors who have chosen to double down on their investments in the second-largest crypto token in anticipation of this happening. 

The increased interest in ETH is expected to spark significant rallies in its price ahead of the May deadline, when the SEC will have to approve or deny VanEck’s Spot Ethereum ETF application.

Ethereum price chart from Tradingview.com (Crypto analyst)

Ethereum Price Tops $3,100: Mega Wedge Breakout Imminent

After a prolonged period of weakness for a year and a half against the Bitcoin price, the Ethereum price is currently showing strength again and could be set for an explosive move, according to several renowned analysts.

Ethereum/BTC Chart Is A ‘Stunner’

In an analysis of the ETH/BTC trading pair, renowned financial expert Raoul Pal has brought to light a compelling dual-chart pattern. The formation of both a “mega wedge” and an inner descending channel is setting the stage for what might be a significant breakout for Ethereum when priced in Bitcoin. Pal stated:

The ETH/BTC chart is an absolute stunner…and ready for the next big move, the break of the mega wedge…let’s see how it pans out….

ETH/BTC price analysis by @RaoulGMI on X

The “mega wedge” pattern, discernible on the weekly ETH/BTC chart, showcases a contraction of price movement between two converging trend lines over an extended time frame. The upper trend line, acting as a dynamic resistance, has repeatedly pushed back ascending price attempts. Conversely, the lower trend line has provided a sturdy support base.

Within the boundaries of this one and a half year wedge, a more immediate descending channel has taken shape. This channel, characterized by a downward trajectory with price action making lower highs and lower lows, indicates a bearish sentiment within the overarching consolidation phase of the mega wedge.

However, Ethereum’s current positioning, slightly above the upper boundary of this descending channel, implies that a breakout could be on the cards (if confirmed). As of press time, Ethereum was trading at an equivalent value of over $3,059, which translates to roughly 0.06037 BTC.

The intersection of these two patterns, particularly if the breakout from the descending channel is confirmed, could be a harbinger of increased volatility and a potential trend reversal for ETH against BTC. A potential retest of the channel could catalyze a rally towards the mega wedge’s upper trend line, challenging the longer-term resistance. A successful breakout from the mega wedge could then ensue, signaling a massive bullish phase for Ethereum against Bitcoin.

More Bullish Voices On ETH

Remarkably, Raoul Pal is not the only seasoned analyst observing this major trend. Christopher Inks, founder of Texas West Capital stated via X:

The monthly ETH/ BTC chart looks crazy bullish off the lows. Bullish SFP, volume expansion at the lows, rally into descending resistance. An impulsive break out above that descending resistance will have me looking for price to target the top of the range and, likely, new ATHs.

Ethereum/Bitcoin price analysis

Renowned analyst Will Clemente has also weighed in on the unfolding situation with his expert commentary, echoing the significance of the patterns observed by Raoul Pal. Clemente accentuates the breaking of a multi-year downtrend on the weekly chart, a technical milestone that carries substantial weight for market sentiment.

Clemente’s analysis further deepens the plot by highlighting several key factors currently at play in the Ethereum ecosystem. First, Ethereum’s price action has revisited and swept the lows of May 2022, a move often associated with shaking out weak hands before a potential trend reversal.

Second, the recent talk of “Ethereum obituaries” on social media timelines suggests a sentiment extreme, often seen at major turning points. Moreover, there is currently a new narrative for ETH shaping, the emergence of “restaking”.

Probably the strongest catalyst for the ETH price in the coming months could be the potential approval of an spot Ethereum ETF in the United States. Similar to the Bitcoin ETF euphoria, Clemente speculates that the approval has not yet been priced in.

Lastly, Uniswap’s governance proposal to switch on fees could redirect significant value to token holders, potentially adding further bullish momentum to ETH’s valuation. Clemente caps his commentary with a forecast that resonates with the sentiments of many observers: “ETH & ETH shitcoin rotation is probably upon us.”

At press time, ETH traded at $3,059.

Ethereum price

Ethereum Receives Nod Of Approval From Berstein: ETH Price Will Reach $10,000

Global asset management firm, Bernstein has expressed confidence, foreseeing a fairly strong chance of the United States Securities and Exchange Commission (SEC) approving an Ethereum Spot ETF.  

SEC Ethereum Spot ETF Approval Imminent

In a February 19 research report, Bernstein analysts Gautam Chhugani and Mahika Sapra disclosed that Ethereum, the world’s second-largest cryptocurrency, may be the only digital asset after Bitcoin, to win an ETF approval from the US SEC. 

Following the approval of Spot Bitcoin ETF, many crypto enthusiasts anticipated Ethereum as the next in line for an ETF. However, given the SEC’s current stance on cryptocurrencies and its previous reluctant acceptance of Spot Bitcoin ETFs, the prospects of an Ethereum ETF have become uncertain

In the research report, Bernstein analysts predicted the approval timeline for an Ethereum Spot ETF. They emphasized that the presence of notable traditional financial firms, including Grayscale and Franklin Templeton, competing for a Spot Ethereum ETF, strengthens the outlook for its approval. 

“We think there is a roughly 50% chance of spot Ethereum ETF approval by May, with an almost certain chance of approval within the next 12 months,” the Bernstein report read.  

Ethereum’s Roadmap To $10,000

With the potential approval of Ethereum Spot ETFs, Ethereum may witness a significant price increase to levels as high as $10,000.  Prior to the SEC’s approval of Spot Bitcoin ETFs on January 10, the anticipation surrounding the ETF had sparked a massive price rally for the cryptocurrency. Following the approval and ETF launch, Bitcoin surged to over $45,000 before witnessing a subsequent price correction that pushed it back below $40,000. 

Despite the short correction, Bitcoin has been gaining back its momentum, and at the time of writing, the cryptocurrency is trading at $51,998, according to CoinMarketCap. This substantial price increase is largely attributed to the success of its ETF, providing investors with greater accessibility to Bitcoin, and contributing to the cryptocurrency’s increased adoption.

A similar narrative could unfold for Ethereum following the approval of its ETF. With rising interest from institutional investors and the ETF driving global adoption, the cryptocurrency could potentially attain new all-time highs above $10,000. 

In the research report, Bernstein analysts also confirmed Ethereum’s strong positioning for mainstream institutional adoption. The analysts emphasized the need for the cryptocurrency market to shift its attention to Ethereum, as the cryptocurrency is poised to witness gains following the approval and launch of its ETF.

Ethereum price chart from Tradingview.com

Ethereum Price Prediction: Analyst Predicts 100% Rise Against Bitcoin

Crypto analyst Michaël Van De Poppe recently made a bullish prediction for the Ethereum price against Bitcoin in the near future, noting the path for this to happen. According to a social media post by the analyst, price action on the ETH/BTC pair for the next months will center around spot Bitcoin ETFs, with a rotation into ETH also in the prediction.

Analyst’s Prediction of 100% Ethereum Price Rise Against Bitcoin

Michaël Van De Poppe recently took to X to share a chart of Ethereum’s price performance against Bitcoin (ETH/BTC pair) on the weekly timeframe. Price action on the chart forms green (bullish) candles during periods of Ethereum’s performance over Bitcoin, while red (bearish) candles are formed during periods of Ethereum’s underperformance against Bitcoin.

Taking a look at the chart shared by Van De Poppe shows that Ethereum’s performance on the ETH/BTC pair has been on a decline since the middle of 2022. This decline particularly increased during the last quarter of 2023, as the enthusiasm regarding spot Bitcoin ETFs led to a surge in the price of Bitcoin. Consequently, the analyst noted that Ethereum’s price performance against Bitcoin is now around the 2022 low of 0.04922.

According to Van De Poppe, the approval of the long-awaited spot Bitcoin ETFs could lead to the creation of another liquidation candle on ETH/BTC to eventually take the liquidity around the 2022 low. This would eventually lead to a rotation into Ethereum, combined with a bullish weekly divergence.  

As a result, the ETH/BTC pair would be propelled to a target just above 0.12 by the rotation, signifying an increase of more than 100%. Notably, the last time ETH reached this level on the ETH/BTC pair was during the crypto’s first major bull run in 2018. 

Ethereum price chart from Tradingview.com

The Rotation Game Has Started

Spot Bitcoin ETFs have been approved by the SEC on Wednesday, causing the price of Bitcoin to spike to $48,600, its highest point since April 2022. However, the price of Bitcoin has stalled and is now trading at $45,839, about where it was when the news of the approval of spot Bitcoin ETFs came out.

At the same time, Ethereum rose over $2,500 to reach $2,600, its highest point since April 2022. Ethereum has maintained this gain to outperform Bitcoin and is trading at $2,618 at the time of writing.

According to another post on social media by Michaël Van De Poppe price action since the approval of spot Bitcoin ETFs suggests that the rotation is already happening on the ETH/BTC pair.

“The rotation game is happening already,” he stated, adding a $3,500 price target for ETH.

Investors are now anticipating the approval of spot Ethereum ETFs, which could also drive up the price of ETH.

Ethereum “Set For Further Gains,” Analyst Puts This Target

An analyst has explained that Ethereum could be set to see a further rally based on on-chain data. Here’s the level ETH may end up surpassing.

Ethereum Has No Significant On-Chain Resistance Ahead

In a new post on X, analyst Ali has discussed how Ethereum’s support and resistance levels are looking like based on on-chain data. In on-chain analysis, the potential for any level to provide any notable amount of support/resistance to the price depends on the number of investors who acquired their coins.

Here is a chart that shows the amount of ETH that was bought at some of the price ranges that the asset has visited before:

Ethereum On-Chain Support & Resistance

The graph shows that the $2,235 to $2,302 range carries the cost basis of a significant number of coins. More specifically, 1.84 million addresses acquired more than 6 million ETH inside this range.

Currently, the Ethereum price is trading just above this range, implying that all these investors are in the green. If the Ethereum spot price retraces into this range, these holders could show some reaction, as their profit-loss boundary would be retested.

Since these holders would have been in profits just before the retest, they might want to buy more, as they may believe that this same price range that was profitable earlier might turn out to be a worthy buy again.

Since the range is thick with investors, this buying effect that may arise on a retest could end up providing support to the price. If the support fails, the price might be between $1,958 and $2,029.

This range is much more robust, hosting a cost basis of over 37 million ETH. Ali notes that this support could potentially help cushion any corrections that may take place.

Now, Ethereum has strong support below, and as is apparent in the chart, there is no major demand wall above it simultaneously. Investors in loss (those with a cost basis higher than the current spot price) may be desperate to escape the market, so the price rising to their break-even can be an enticing exit opportunity.

If many holders are sitting at a loss, their demand zone could provide significant resistance to the price because of such selling. ETH has no such obstacles in the nearby price ranges so that the coin could rally further. “The path ahead of ETH is clear, with no significant supply barriers in sight, suggesting a potential rise to $2,700 or beyond,” explains the analyst.

The market intelligence platform IntoTheBlock has also shared a chart that could provide further evidence for a bullish case of Ethereum.

Ethereum Long-Term Holders

As is visible in the above graph, the percentage of Ethereum investors who can be classified as “HODLers” (1 year+ holding time) has shot up recently. “This year, the percent of long-term ETH holders surpassed that of Bitcoin for the second time ever!” notes IntoTheBlock.

ETH Price

Ethereum is currently at the $2,316 mark, not too far above the support zone mentioned earlier.

Ethereum Price Chart

Ethereum Retests Breakout Zone, Analyst Sets $3,500 Target

An analyst has explained how Ethereum is retesting a breakout zone currently and that this might lead toward a price target of $3,500.

Ethereum Is Retesting The Breakout Line Of An Ascending Triangle

As pointed out by analyst Ali in a new post on X, Ethereum may be preparing for a further climb right now as it’s retesting the breakout zone of an ascending triangle.

An “ascending triangle” is a pattern in technical analysis that, as its name implies, resembles a triangle. The pattern involves a horizontal line made by connecting highs and a slant line that strings together higher lows.

When the price retests the upper, horizontal level, it could be probable to feel some resistance. On the other hand, a touch of the lower level could lead to the price rebounding back up.

A break out of either of these lines suggests a potential sustained continuation of the trend. Naturally, an escape out of the triangle towards the upside implies bullish momentum, while a fall under means bearish momentum.

Like the ascending triangle, there is also the “descending triangle,” which is a similar pattern except for the fact that the two levels are switched around (as the prevailing trend is towards the downside).

Now, here is the chart shared by Ali that displays how the price is interacting with an ascending triangle right now:

Ethereum Ascending Triangle

As is visible in the graph, Ethereum found a bottom at the lower line of this ascending triangle pattern back in October. Following this low, the asset turned itself around with a sharp rally and went on to challenge the upper line.

The cryptocurrency succeeded in finding a break above the triangle and observed a continuation of the bullish momentum, exploring new highs for the year. Recently, though, the asset has slumped back again and has now fallen towards the triangle’s breakout line.

So far, the line has provided support to the asset, as its price has been able to remain above it. The analyst believes that this retest could be a sign that the coin is preparing for a further rally.

“The price range between $2,150 and $1,900 could be the ideal zone for accumulation before ETH sets its sights on a higher target of $3,500,” explains Ali. From the current price, such a target would mean a rally of almost 60% for the asset.

October, the month when Ethereum turned itself around off the triangle’s slope, was also an inflection point for the asset in terms of on-chain activity, as the analytics firm Glassnode has explained in its latest weekly report.

Ethereum On-Chain Activity

From the chart, it’s visible that the Ethereum transaction count and transfer volume have both been trending up since the inflection point a couple of months back, which could be bullish for the price.

ETH Price

Ethereum has gone a bit stale recently as it has been consolidating around the $2,200 mark.

Ethereum Price Chart

Ethereum Bearish Falling Wedge Pattern Appears, How Low Can Price Go?

Ethereum has followed the general trend of Bitcoin over the last few weeks and when the asset dipped from its 2023 peak, so did the price of ETH. Following this decline in price, a worrying pattern has appeared on the ETH chart known as a falling wedge pattern. This was brought to light by crypto analyst Alan Santana, who has painted a grim picture of what this could mean for Ethereum.

Ethereum Falling Wedge Pattern Is Bearish

In the analysis posted on the TradingView website, Alan Santana explains that the appearance of this falling wedge pattern does not bode well for the Ethereum price. Apparently, the ETH chart had formed a perfect rising wedge which eventually broke bearish. Given this, the crypto analyst explains that it shows that the Ethereum price is moving alongside the rest of the crypto market in a “normal but fast correction.”

The crypto analyst also backs up their analysis with the Ethereum Moving Average Convergence/Divergence (MACD) indicator. In the chart shared by the analyst, there is a clear decline in the MACD on the daily chart, which lends credence to the bearish pressure mounting on ETH.

Ethereum price chart from Tradingview.com

Furthermore, using the Relative Strength Index (RSI) on the daily chart as well, there is also a clear decline. The RSI has apparently already lost its trend line support and is now moving below 50. The simple fact suggests a turn toward the bearish direction for the cryptocurrency.

Santana explains that these indicators show that the bias toward a downward spiral is strong, especially since it has already seen a double-top pattern. “Volume continues to drop, the calm before the storm. Slowly, slowly down… Nothing is happening, everything is good then Boom!” the analyst warns.

Ethereum price chart from Tradingview.com

Price Targets For ETH’s Bearish Formation

From the chart posted in the analysis, the crypto analyst seems to expect at least a 20% drawdown for Ethereum following the double-top formation. Now, the chart puts the double top formation when the asset’s price briefly touched the $2,400 level last week.

After that, expectations have quickly gone in the opposite direction and as the formation plays out, the crypto analyst sees a decline to at least $1,800 from here. If further downside follows, then Santana expects that there will be more drawdowns that will end somewhere around $1,600.

The Ethereum price is still trending around $2,200 at the time of writing, suggesting the bear pressure is still mounting. If it breaks down from here, then Santana’s prediction could prove right and ETH’s price could fall back to mid-October levels.

Ethereum Rising User Base Boosts Revenue Projections: Predicted To Double To $5 Billion

Bitwise Invest, an investment firm specializing in the crypto space, recently unveiled its anticipated crypto predictions for 2024.

These projections provide a glimpse into the future of the cryptocurrency industry, highlighting major milestones and potential breakthroughs for the largest cryptocurrencies such as Bitcoin (BTC), and Ethereum (ETH), and exchanges like Coinbase. 

Bitcoin Predicted To Smash Records

Bitwise’s first prediction suggests that Bitcoin will surpass previous records and trade above $80,000, setting a new all-time high. The firm attributes this bullish outlook to two key catalysts: the imminent launch of a spot Bitcoin exchange-traded fund (ETF) early in 2024 and the anticipated halving of new Bitcoin supply by the end of April. 

Furthermore, Bitwise expects the spot Bitcoin ETFs to be approved and to collectively become the most successful ETF launch in history.

Interestingly, Bitwise also forecasts that Coinbase, one of the largest cryptocurrency exchanges, will witness its revenue double, surpassing Wall Street expectations by at least 10 times. 

Ethereum

The firm points out that Coinbase’s trading volumes typically surge during bull markets, and they anticipate a similar trend in 2024. Additionally, Bitwise highlights Coinbase’s successful launch of various new products that have gained traction in the market.

On the other hand, the investment firm predicts that more money will settle using stablecoins compared to traditional payment giant Visa. Bitwise highlights stablecoins as one of crypto’s “killer apps” and notes their remarkable growth from virtually zero to a $137 billion market in just four years. Bitwise anticipates 2024 to be another significant year for stablecoin expansion.

Ethereum Set For Major Breakthrough

Bitwise expects Ethereum’s revenue to more than double from $2.3 billion in 2023 to $5 billion in 2024. The firm attributes this growth to the increasing number of users flocking to crypto applications. Bitwise emphasizes Ethereum’s potential as one of the fastest-growing large-scale tech platforms globally.

Ethereum

Furthermore, Bitwise anticipates a major upgrade to Ethereum, labeled EIP-4844, which could reduce average transaction costs to below $0.01. This significant cost reduction is expected to pave the way for mainstream adoption and the development of groundbreaking applications within the crypto ecosystem.

Bitwise’s bonus prediction suggests that by the end of 2024, one in four financial advisors will allocate funds to cryptocurrencies in their clients’ accounts. The firm foresees increased adoption by financial advisors once Bitcoin becomes easily accessible and mainstream.

Ethereum

In summary, Bitwise Invest’s crypto predictions for 2024 paint an exciting future for the cryptocurrency market. With expectations of a new all-time high for Bitcoin, the successful launch of spot Bitcoin ETFs, and revenue growth for industry giants like Coinbase and Ethereum, the crypto space is poised for significant advancements in the coming years.

As of the current update, ETH is trading at $2,200, reflecting a 1.4% increase over the past 24 hours. This positive movement follows a similar trend set by BTC. However, Ethereum has experienced a slight decline of 2.4% in the past seven days.

Featured image from Shutterstock, chart from TradingView.com 

Ethereum Price Prediction: Crypto Analysts Reveal Catalyst That Will Drive Price Above $3,500

A crypto analyst has singled out an event that could be the spark that Ethereum needs to hit the price level of $3,500. He believes that the second-largest cryptocurrency by market cap is going to make this run after Bitcoin “gets its shine.”

How Ethereum Will Hit $3,500

In a post shared on his X (formerly Twitter) platform, the CEO and founder of MN Trading, Michaël van de Poppe, alluded to the Ethereum Spot ETF filing by Fidelity in his price prediction of $3,500. The crypto analyst seemed to be suggesting that approval of an Ethereum Spot ETF could propel Ethereum’s price to such heights. 

His reference to Bitcoin also confirms that this might indeed be van de Poppe’s “thesis.” He spoke about Ethereum “running to $3,500 in Q1 2024” after Bitcoin has had its shine. The “shine” likely refers to the possible approval of a Spot Bitcoin ETF. Some analysts have predicted that there is a 90% chance that a Spot Bitcoin ETF will be approved by January 10, 2024.

With this in mind, the crypto analyst possibly believes that approval of an Ethereum Spot ETF could come not long after once the Spot Bitcoin ETF is approved. If that happens, it could spark a massive rally in Ethereum’s price. That could explain why Michaël van de Poppe is predicting Ethereum to run to $3,500. 

Several asset managers have already applied with the Securities and Exchange Commission (SEC) to offer an Ethereum Spot ETF. However, all eyes seem to be on the SEC’s decision on the pending Spot Bitcoin ETF applications. This could simply be because a final decision is expected on the pending Spot Bitcoin ETF applications, unlike Ethereum’s, which still have a longer review process.

Ethereum price chart from Tradingview.com

Ethereum Spot ETFs May Not Get The Same Reception

Historically speaking, there is reason to believe that Ethereum Spot ETFs might not enjoy the same reception that Spot Bitcoin ETFs have gotten so far. This is based on the fact that there was a stark comparison in the numbers when the futures ETF of both crypto tokens launched. 

Bitcoin futures ETFs were already in place as of 2021, with ProShares Bitcoin Strategy (BITO) ETF being the first to launch. Meanwhile, Ethereum futures ETFs just launched this year. What is most interesting is the trading volume that BITO saw on its launch date in comparison to all Ethereum futures ETFs on their launch date. 

BITO is reported to have seen more than $1 billion in trading volume in the first two days of launching. On the other hand, the total trading volume for Ether ETFs on their launch day amounted to just under $2 million

Ethereum Breakout: Analyst Explains Why The King Of The Altcoins Is Destined For $10,000

Crypto analyst Tony The Bull, founder of CoinChartist, has revealed why Ethereum is destined to cross $10,000. According to the crypto analyst, the king of the altcoins has its top just right after $10,000 using the Fibonacci extension.

How Ethereum Gets To $10,000

In the latest issue of the CoinChartist newsletter, crypto analyst Tony The Bull used the Hurst Cycle Theory which showed cyclical reoccurrence across the ETH/USDT chart. As the analyst explains, the uptrend noticed in the Ethereum charts has usually come from the accumulation of the token.

Tony points out that this accumulation has always taken place “at the bottom boundary of the Ending Diagonal pattern.” The analyst further added that “Since intracycle harmonics come in twos and threes, three cycles should complete one larger cycle that concludes with a breakdown of this Ending Diagonal pattern.”

Taking this Ending Diagonal Pattern into account, Tony reveals that the top of the pattern puts the ETH price at $10,000. However, this is not the only pattern that suggests that the king of the altcoins will end up beating the $10,000 level.

He also pointed out that the previous ETH rally had started at the 0.5 Fibonacci extension and reached 1.414 the last time that the ETH price peaked. The analyst notes that Ethereum is once again at the 0.5 Fibonacci extension which led to a break out in the price and the same could happen here. But this time, the target is able $10,000 if the 1.414 Fib is reached again.

Ethereum price chart from Tradingview.com (ETH to $10,000)

ETH Moves Into Overbought Territory

One interesting fact that the analyst points out in the newsletter is the fact that Ethereum is currently in overbought territory. However, where this would usually signal a bearish reversal coming for the digital asset, Tony does not believe this is the case here.

Rather, he explains that a cryptocurrency being overbought usually means that it is “a powerfully trending asset.” So even though it could lead to a reversal, it does not invalidate the bullishness of that digital asset.

He also mentions that “the Stochastic has confirmed a 1M above 80 on the Stock.” Now, whenever this has happened for Ethereum, it has often resulted in a pushup for the price. At the same time, ETH is moving to the upper Bollinger Band. Both of these setups could paint a bullish breakout for the asset.

Ethereum to $10,000

However, the analyst warns that for this bullish scenario to play out, the Ethereum price would have to close above $2,450 this month. If the Stochastic moves back below 20, it could invalidate it and trigger a downtrend. “But if ETHBTC can push back above 20 this will generate a buy signal on the 1M Stochastic and kickstart Ether’s over-performance above Bitcoin,” Tony concluded.

Standard Chartered Says Ethereum Price Can Reach $35,000, Here’s When

Ethereum has struggled alongside Bitcoin through the current bear market climate but this has not stopped bullish predictions for the digital asset. The most recent bullish prediction comes from British multinational bank Standard Chartered which believes that the Ethereum price could climb higher than  $8,000.

Factors That Could Trigger The Rise

Geoff Kendrick, Head of Digital Assets Research at Standard Chartered Bank has revealed his forecast for the Ethereum price in a research note. According to the researcher, he sees big things in the future of the digital asset which could climb higher than $8,000 in the coming years.

Talking about the asset’s valuation, Kendrick points toward the many use cases for Ethereum that have emerged over the years but also sees more use cases emerging as time goes on. One of those is the much-coveted gaming and asset tokenization sector.

Also, the Standard Chartered researcher said that they expect that Ethereum will see more growth than the pioneer cryptocurrency, Bitcoin. While he expects Bitcoin to rise 3.5x, they believe Ethereum will rise 5 from current levels.

“We think the path higher for ETH prices may take longer than for BTC, but we see ETH eventually reaching a higher price multiple than BTC relative to current levels (5.0x versus 3.5x),” the researcher said.

He also believes that Ethereum would go on to further register its dominance in the space, especially with the Layer 2 blockchains such as Arbitrum that have popped up to enhance the network. This, he believes, would lead to an increase in the Ethereum profit-earnings ratio (P/E ratio).

Ethereum price chart from Tradingview.com (Standard Chartered)

Ethereum Could Climb Above $8,000

In terms of actual dollar values, $8,000 is not the only figure that the researcher dropped for the Ethereum price. The expectations for the digital asset exceed this four-digit figure right into the five-digit territory as Kendrick believes ETH could rise to anywhere between $26,000 and $35,000.

As for when this might happen, the researcher seems to be targeting the next bull market as he expects the factors that will drive this value growth to happen between 2025-2026. “We see the $8,000 level as a stepping stone to our long-term ‘structural’ valuation estimate of $26,000-$35,000,” he said in the note. Then beyond this, the researcher expects the price to continue to rise.

This is not the first time that Kendrick has released a bullish prediction for cryptocurrencies. He previously said he expects the price of Bitcoin to reach $120,000 and the entire crypto market to rise as well. However, it seems the researcher is much more bullish on ETH.

Not everyone has provided bullish forecasts for ETH though. One crypto analyst actually believes that the digital asset is set for more decline. In the analyst, FieryTrading suggests that Ethereum’s price could fall as low as $900.

Will Ethereum Drop Back To $900? Here’s What This Analyst Thinks

Following the Terra LUNA network collapse back in 2022, the price of Ethereum followed the general market downtrend. As a result of this, the ETH price had fallen to a new cycle low of $900, before recovering once more. However, now that the altcoin is still deep in the throes of the bear market, questions have arisen once more about the chances of the price returning to its 2022 lows.

Crypto Analyst Says Ethereum Could Drop To $900

In an analysis posted on TradingView, crypto analyst FieryTrading presents a scenario in which the price of Ethereum could fall back toward its 2022 lows. The analysis in question takes into account the multiple bullish trend lines that the digital asset’s price had fallen through over the last year.

According to FieryTrading, Ethereum had one last remaining bullish line which had emerged on the chart back toward the bottom of the June 2022 sell-offs. However, the digital asset hasn’t been able to hold this trend line and they point out that “it’s well over a year old and must carry some weight.”

Ethereum price chart from Tradingview.com

Due to this, the crypto analyst believes that the digital asset has entered into a long bearish stretch. As this bear stretch continues, which the analyst expects to be even longer, they see a high possibility of the Ethereum price reaching as low as $900 once more, as shown in the chart below.

Despite being seemingly convinced about ETH’s price decline, the analysis still needs confirmation. Their explanation which is shown in the chart as well asks to wait for the price to break below the $1,510 level for this to take place.

Ethereum price chart from Tradingview.com (crypto analyst $900)

Bearish Going Into The Bitcoin Halving

As the analyst explains, the bearish expectation is not localized to just the Ethereum price alone. It seems to encompass the whole market which the analyst believes has finished out its half bullish stretch and has now entered into the bearish half that often leads up to the halving. As the analyst puts it, this indicates “that it’s the turn of the bears by now.”

This school of thought is not new and is actually backed up by historical data. When looking at the charts of cryptocurrencies such as Bitcoin and Ethereum, it shows that there was a bearish stretch leading up to the Bitcoin halving. After the event, this trend tends to reverse, which then signals the start of the bull market.

In the months leading up to the 2020 halving event, the price of Ethereum saw a sharp decline that put its price in the $120 region before picking back up. So if there is a repeat of this, then FieryTrading’s analysis for ETH could play out.

Ethereum (ETH) Price Is Likely To Stop Bouncing Now, Analyst

In a tweet two days ago, Bluntz predicted that ETH is only a 10% drop away from stabilizing. The Crypto trader is famous for accurately predicting Bitcoin’s 2018 bear market. More popular as the “smart contracter,” the strategist explained that he had been closely tracking ETH price charts since August. 

“Ethereum is in the final stages of its current bearish run and will swing upward soon,” he assured his 211,000 followers. Once the token corrects its course, investors can then get ready to take up long-term positions, the tweet explained.

Related Reading: XRP Sluggish In Last 7 Days As Ripple Vs. SEC Case Drags On

Smart Contracter’s Predictions Have Held Thus Far 

Smart Contracter presented a chart based on the Elliot Wave theory as evidence of his predictions. As one of the prominent theorists of this market analysis method, Bluntz has successfully made some predictions in the past. Apart from his much-lauded 2018 Bitcoin forecast, the strategist’s recent predictions on Ethereum seem to be holding so far. Smart contracter predicted September’s $1800 rise last month using the Wave crowd psychology method. 

At the time of his prognosis, the second largest crypto was trading a $1600 low. The analyst predicted that ETH would rise temporarily in a B wave before bottoming out in anticipation of another rally. He forecasts that ETH will dip to $1,200 before climbing back to $2,000.

Ethereum’s price is currently trading above %1,450. | Source: ETHUSD price chart from TradingView.com
Other Predictions By Smart Contracter

We’re in the final innings of this $eth correction, correcting the rise from July. Have been mapping this out step by step since August top, only 10% or so more down to go before we begin to look for long-term buys, Bluntz said.

Furthermore, the Analyst’s chart indicates that Ethereum is going through another drop that will eventually transition into a Bull run. $1,300 will mark the buy signal point if the chart’s structure looks appropriate, says the pseudonymous strategist. 

Notably, Ethereum is not the only crypto Smart Contracter is tracking. Last week, he expressed bearish sentiments on Bitcoin, claiming its price charts looked ugly at the time. Another famous analyst ‘Dave the Wave’ had predicted that the king Coin was gearing up for a bull run according to his MACD chart. However, Bluntz insisted that Bitcoin was still expecting several more dips. He announced that he would not buy any bitcoin unless it dropped below $17,000.

Several Factors Contribute to The Crypto Market’s Current Volatility

Although Smart Contracter’s predictions have remained unrefuted so far, there is still time before his predictions get proven or discounted. Several factors, including inflation, the CPI release, and Ethereum Merge, continue contributing to crypto’s volatility. Hence crypto traders and investors will do well to be circumspect in their investment decisions.

Related Reading: Bitcoin Loses $20,000 Grip, Extends Consolidation For 2nd Straight Day

At the time of writing, Ethereum is trading around $1,470, up over 2.50% in the last 24 hours, according to TradingView data.

Featured image from Pixabay and chart from TradingView.com

Will Ethereum Hit $7k This Year? Finder’s Panel Says Yes

Ethereum has been one of the greatest performers among the leading crypto currencies in 2021, with a price increase of about 330 percent over the course of the year. However, after hitting a new high of $4,847 in early November 2021, the price of ETH plummeted by more than 70% in January 2022.

Ethereum Poised For $7k?

While ETH’s great ROI and strong trajectory led to a lot of high price projections for the coin’s future, many of those were invalidated by the recent downturn. On January 24, prospects of a huge rise to a new ATH seemed to disappear when the overall crypto market crashed under the $1.5 trillion barrier. Nonetheless, given Finder’s projection of an Ethereum year-end price close above $7000, these hopes were reignited recently.

Starting this year, Ethereum’s price, like the rest of the crypto market, appeared to be on its knees, with lows at $3673. For the time being, Ethereum’s 2022 trajectory appears to be primarily bearish, with the asset now trading at $2,919 at press time.

ETH/USD trades at $2,900. Source: TradingView

Despite the recent drop, Ethereum’s price is predicted to hit $7,609 this year, according to Australian fintech Finder’s panel of 33 crypto experts, before ending the year at approximately $6,500.

Intriguingly, the firm’s recent estimates for 2025 and 2030 were 30% and 48% lower, respectively, than its predictions from October last year.

ETH price prediction. Source: Finder

In addition, the panel anticipated that Ethereum’s price will reach $10,810 by the end of 2025 and $26,338 by the end of 2030 in the long run.

Furthermore, 79% of the panelists feel that Ethereum’s transition to a proof-of-stake (PoS) model would result in a price gain, while 11% believe that it will result in a price decline due to persistently high gas fees and scalability difficulties.

Related Reading | Ukraine Adopts New Law To Legalize Bitcoin And Other Cryptocurrencies

ETH Price Direction

The Finder panel seems to be bullish on ETH’s worth, and if the above prediction comes true, ETH’s value will have increased by almost 100% by the end of the year.

Longforecast data, on the other hand, predicted a price of $2721 in December 2022, which was far too low. This may be due to ETH’s short-term performance and high correlation with BTC, which has caused ETH to fall when BTC falls. While the price of ETH was down 5% for the week at the time of publication, the price of BTC was only down 2%.

For the time being, with ETH’s trajectory still looking uncertain, it appears that the price of the cryptocurrency may continue to consolidate in the short run. However, given Ethereum’s network growth, the $7K price projection does not appear to be far-fetched.

The long-term growth of Ethereum appears to be unaffected as the hash rate continues to rise, reaching new all-time highs, a startling 240% growth since the beginning of 2021.

Related Reading | Thailand Government Disperses Confusion Surrounding Cryptocurrency Taxation

Featured image from Pixabay, chart from Tradingview.com, Finder

Ex-Goldman Exec And Real Vision Founder Puts Ethereum Value At $20,000 By March 2022

Ethereum has been on an impressive growth path recently. The digital asset recently broke a three-month high after it broke through $3,400 in the early hours of Tuesday. Usage on the Ethereum network has increased drastically in the recent weeks, causing fee rates to surge 200% in the space of a week. As more users adopt the leading smart contracts platform, predictions for the asset’s value have risen accordingly.

Raoul Pal is an ex-Goldman hedge fund exec who is bullish on cryptocurrencies. The ex-hedge fund exec had then gone on to co-found Real Vision, a platform that provides insights and analysis for investors. Pal was on a podcast to talk about his cryptocurrency investment strategies for the top 2 largest projects in the market, Bitcoin and Ethereum, and he had some interesting predictions for both cryptocurrencies.

Related Reading | You Can Now Use Your .COM Domain As An Ethereum Wallet Thanks To This Integration

Ethereum To $20,000, Bitcoin To $250,000

Real Vision CEO Raoul Pal gave some very optimistic predictions for the top 2 digital currencies during his interview. Pal said he believed that Ethereum was going to be at $20,000 by the end of March 2022, while putting Bitcoin price between $250,000 to $400,000 in the same time frame. For Ethereum, Pal said that the growing popularity of decentralized finance (DeFi) and non-fungible tokens (NFTs) factors into his prediction. Disclosing that both DeFi and NFTs have already been twice as widely accepted as Bitcoin.

Related Reading | Billionaire Who Predicted 2008 Housing Crash Says Bitcoin Is “Worthless”

Ethereum adoption has far dwarfed the rest of the crypto space, Pal said. Adding that the recent London Hard Fork and EIP-1559 work to reduce ETH supply, and with ETH 2.0 staking, further propels the bullish setup for the price blowout.

Raoul Pal expects ETH to 6X by next year | Source: ETHUSD on TradingView.com

“There’s tons that have gone into just holding, tones that are locked up in DeFi, tons that are locked up in NFTs, and you’re left with, as of today, 11% of the entire supply of Ethereal available and it’s going down every day, and the demand is going exponential. The only outcome is an exponential rise in price. There’s no other outcome.” – Raoul Pal, Co-Founder, and CEO, Real Vision

Put Your Money Where Your Mouth Is

Raoul Pal is not one to give predictions for others to follow without having a stake in it himself. In fact, the CEO had revealed last year that he had moved his entire investment portfolio to cryptocurrencies. That’s how bullish Pal is on cryptocurrencies. The CEO had completely exited his gold holdings, which, at the time, had made up 25% of his investment portfolio, and the funds were moved to crypto. Even at that point, Pal’s portfolio was made out of 75% crypto before he exited his gold positions.

Related Reading | Deloitte Survey Shows 76% Of Finance Execs Think Physical Money Is Nearing Its End

Now, Pal’s holdings consist of cryptos at various degrees of concentration, down to crypto-related products. The CEO revealed that his holdings consisted of 55% Bitcoin, which made up the majority of his investments. Ethereum (ETH) is the second-largest position, making up 25%. The remaining 20% consists of an equally weighted basket of tokens. These range from tokens of decentralized finance (DeFi) protocols, Layer 1 blockchains, and interoperability solutions.

Related Reading | Here’s How Much Your $1,200 Stimulus Check Would Be Worth In Various Cryptocurrencies In 2021

Pal also added that he had “some specific bets in social tokens, metaverse, and other longer-term macro bets.” The Real Vision co-founder referred to Ethereum as “the greatest trade” from a macro perspective point of view. And he expects the cryptos to go up in Q4 of 2021. “Don’t forget that they usually go up 5X to 10X in the last three months of the year, and we haven’t even got to the all-time high,” Pal said.

Featured image from Toshi Times, chart from TradingView.com