Ethereum To See Fresh Move Soon? What Futures Data Says

Data shows the Ethereum Open Interest has been trading at relatively low levels recently. Here’s what this could mean for the asset’s price.

Ethereum Open Interest Has Been Moving Sideways Since Its Plunge

As explained by an analyst in a CryptoQuant Quicktake post, the ETH Open Interest has followed a similar trajectory as the price of the cryptocurrency recently. The “Open Interest” here refers to the total number of derivative-related contracts open for Ethereum on all exchanges.

When the value of this metric goes up, it means that investors are currently opening up new positions on these platforms. Generally, this kind of trend leads to an increase in the market’s total leverage, so the asset price could become more volatile.

On the other hand, a decline in the indicator implies the investors are either closing up their positions of their own volition or getting forcibly liquidated by their platform. Such a drawdown may accompany violent price action, but once the drop is over, the market could become more stable due to the reduced leverage.

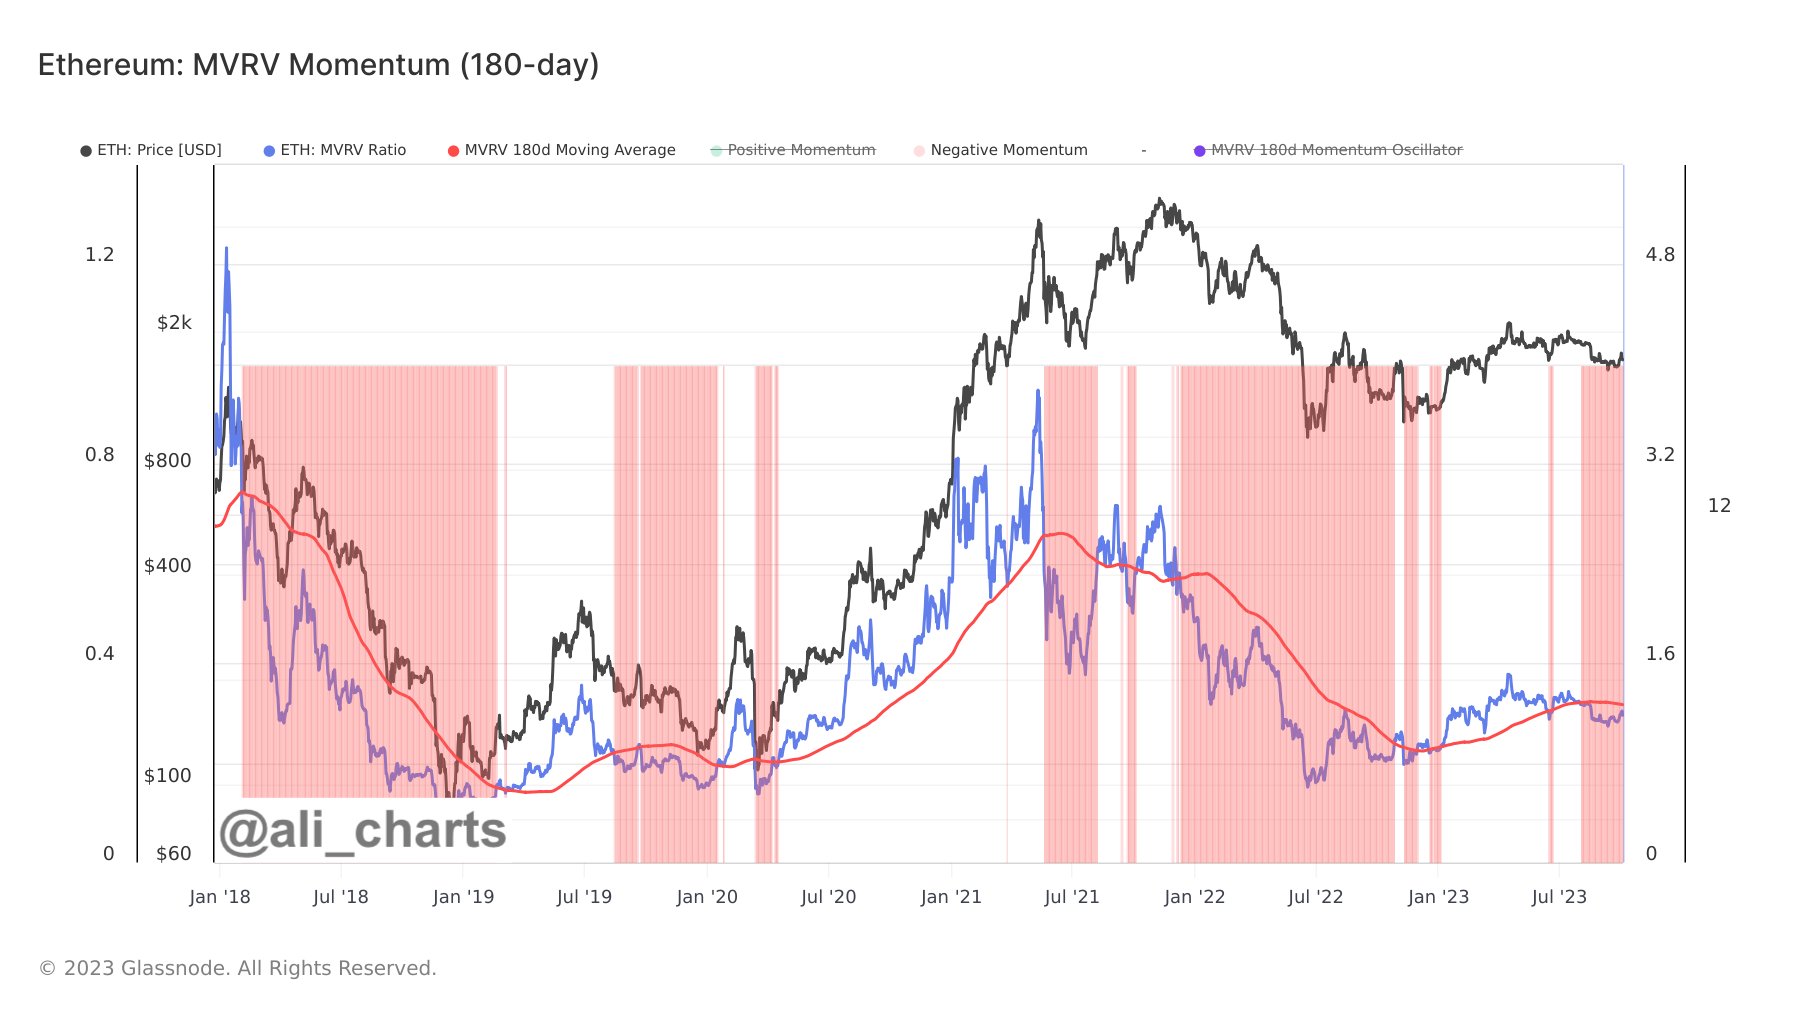
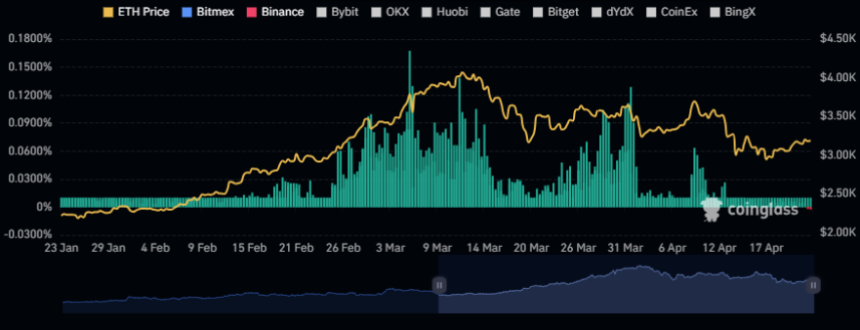
Now, here is a chart that shows the trend in the Ethereum Open Interest over the last few months:

Bitcoin Open Interest

As displayed in the above graph, the Ethereum Open Interest registered a sharp drop earlier alongside the asset’s price. The plunge in the metric was naturally caused by the long contract holders being washed out in the price drawdown.

As the price has mostly consolidated sideways since the decline, so has the value of the Open Interest. The quant notes,

This alignment suggests a cooling down of activity within the futures market. Consequently, the market appears poised for the resurgence of either long or short positions, potentially initiating a fresh and decisive market movement in either direction.

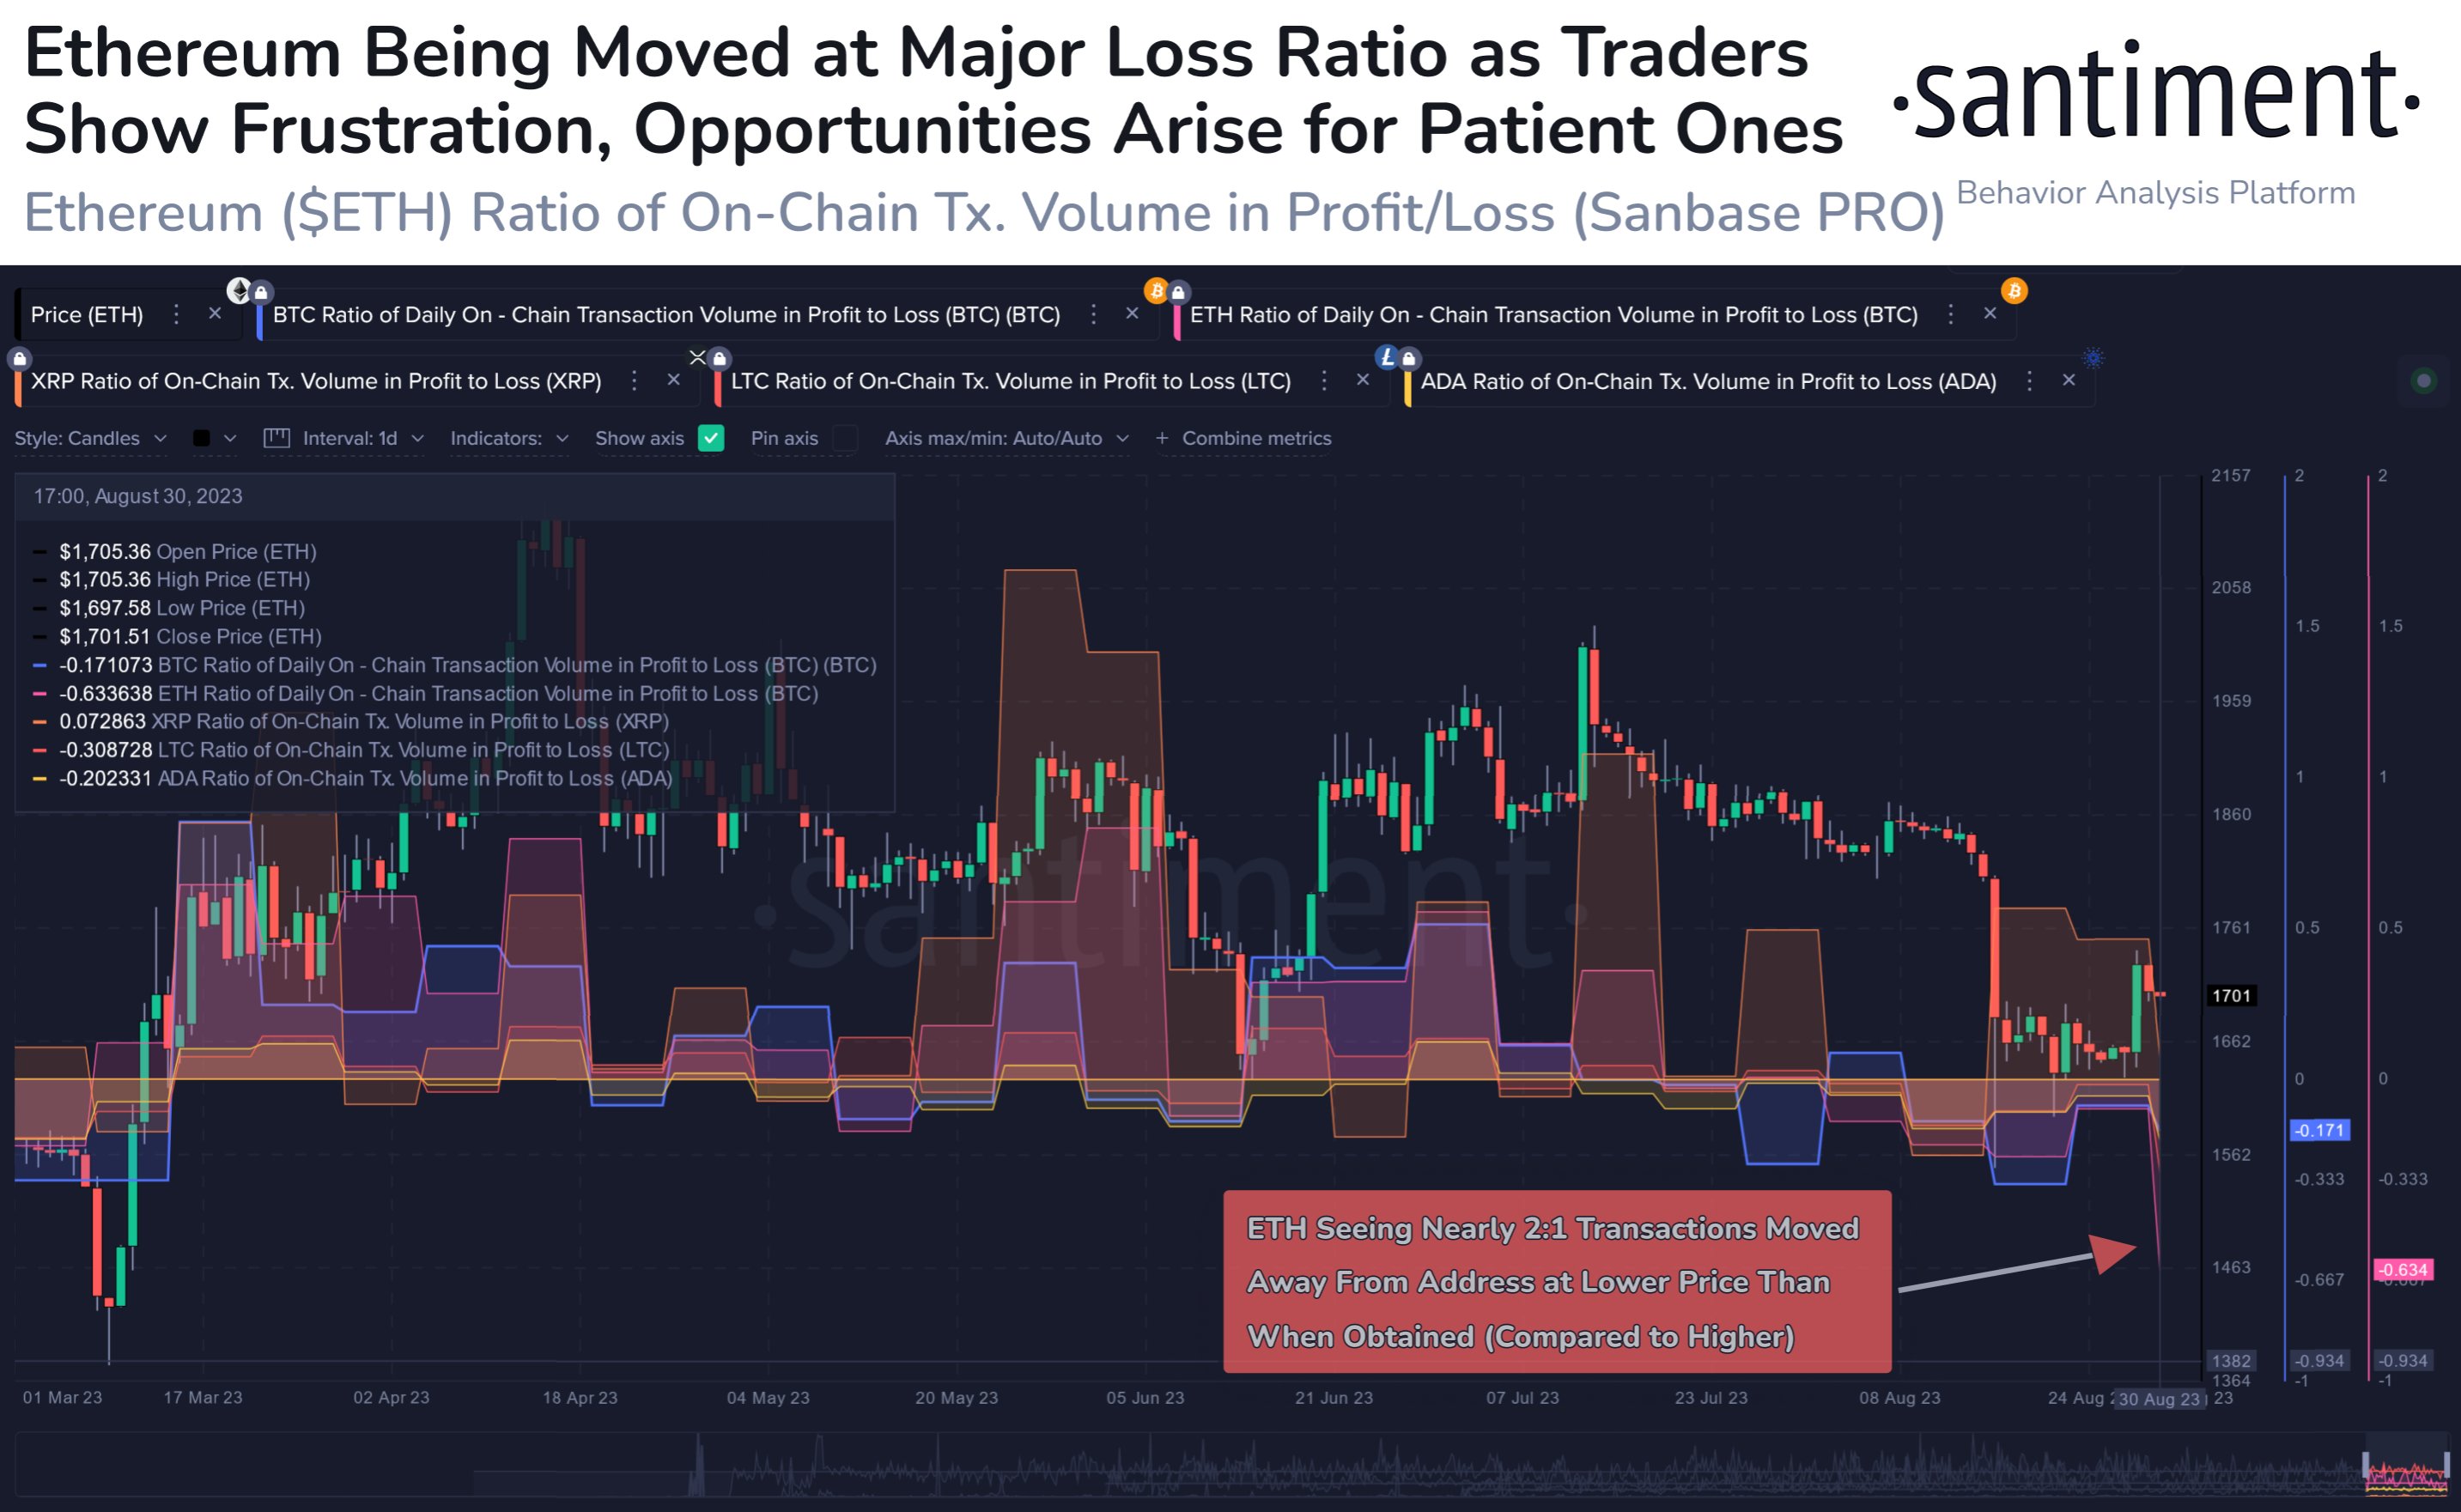
Another indicator related to the derivative market that could be relevant for Ethereum’s future price action is the funding rate. This metric tracks the periodic fees that derivative contract holders are currently paying each other.

Positive funding rates imply that the long holders are paying the shorts a premium to hold onto their positions; hence, that bullish sentiment is dominant. Similarly, negative values suggest that a bearish sentiment is shared by the majority of the derivative traders.

The chart below shows that the Ethereum funding rate has recently turned red.

Ethereum Funding Rates

Historically, the market has been more likely to move against the opinion of the majority, so the fact that the funding rate has flipped negative may be a good sign for the chances of any potential uptrends to start.
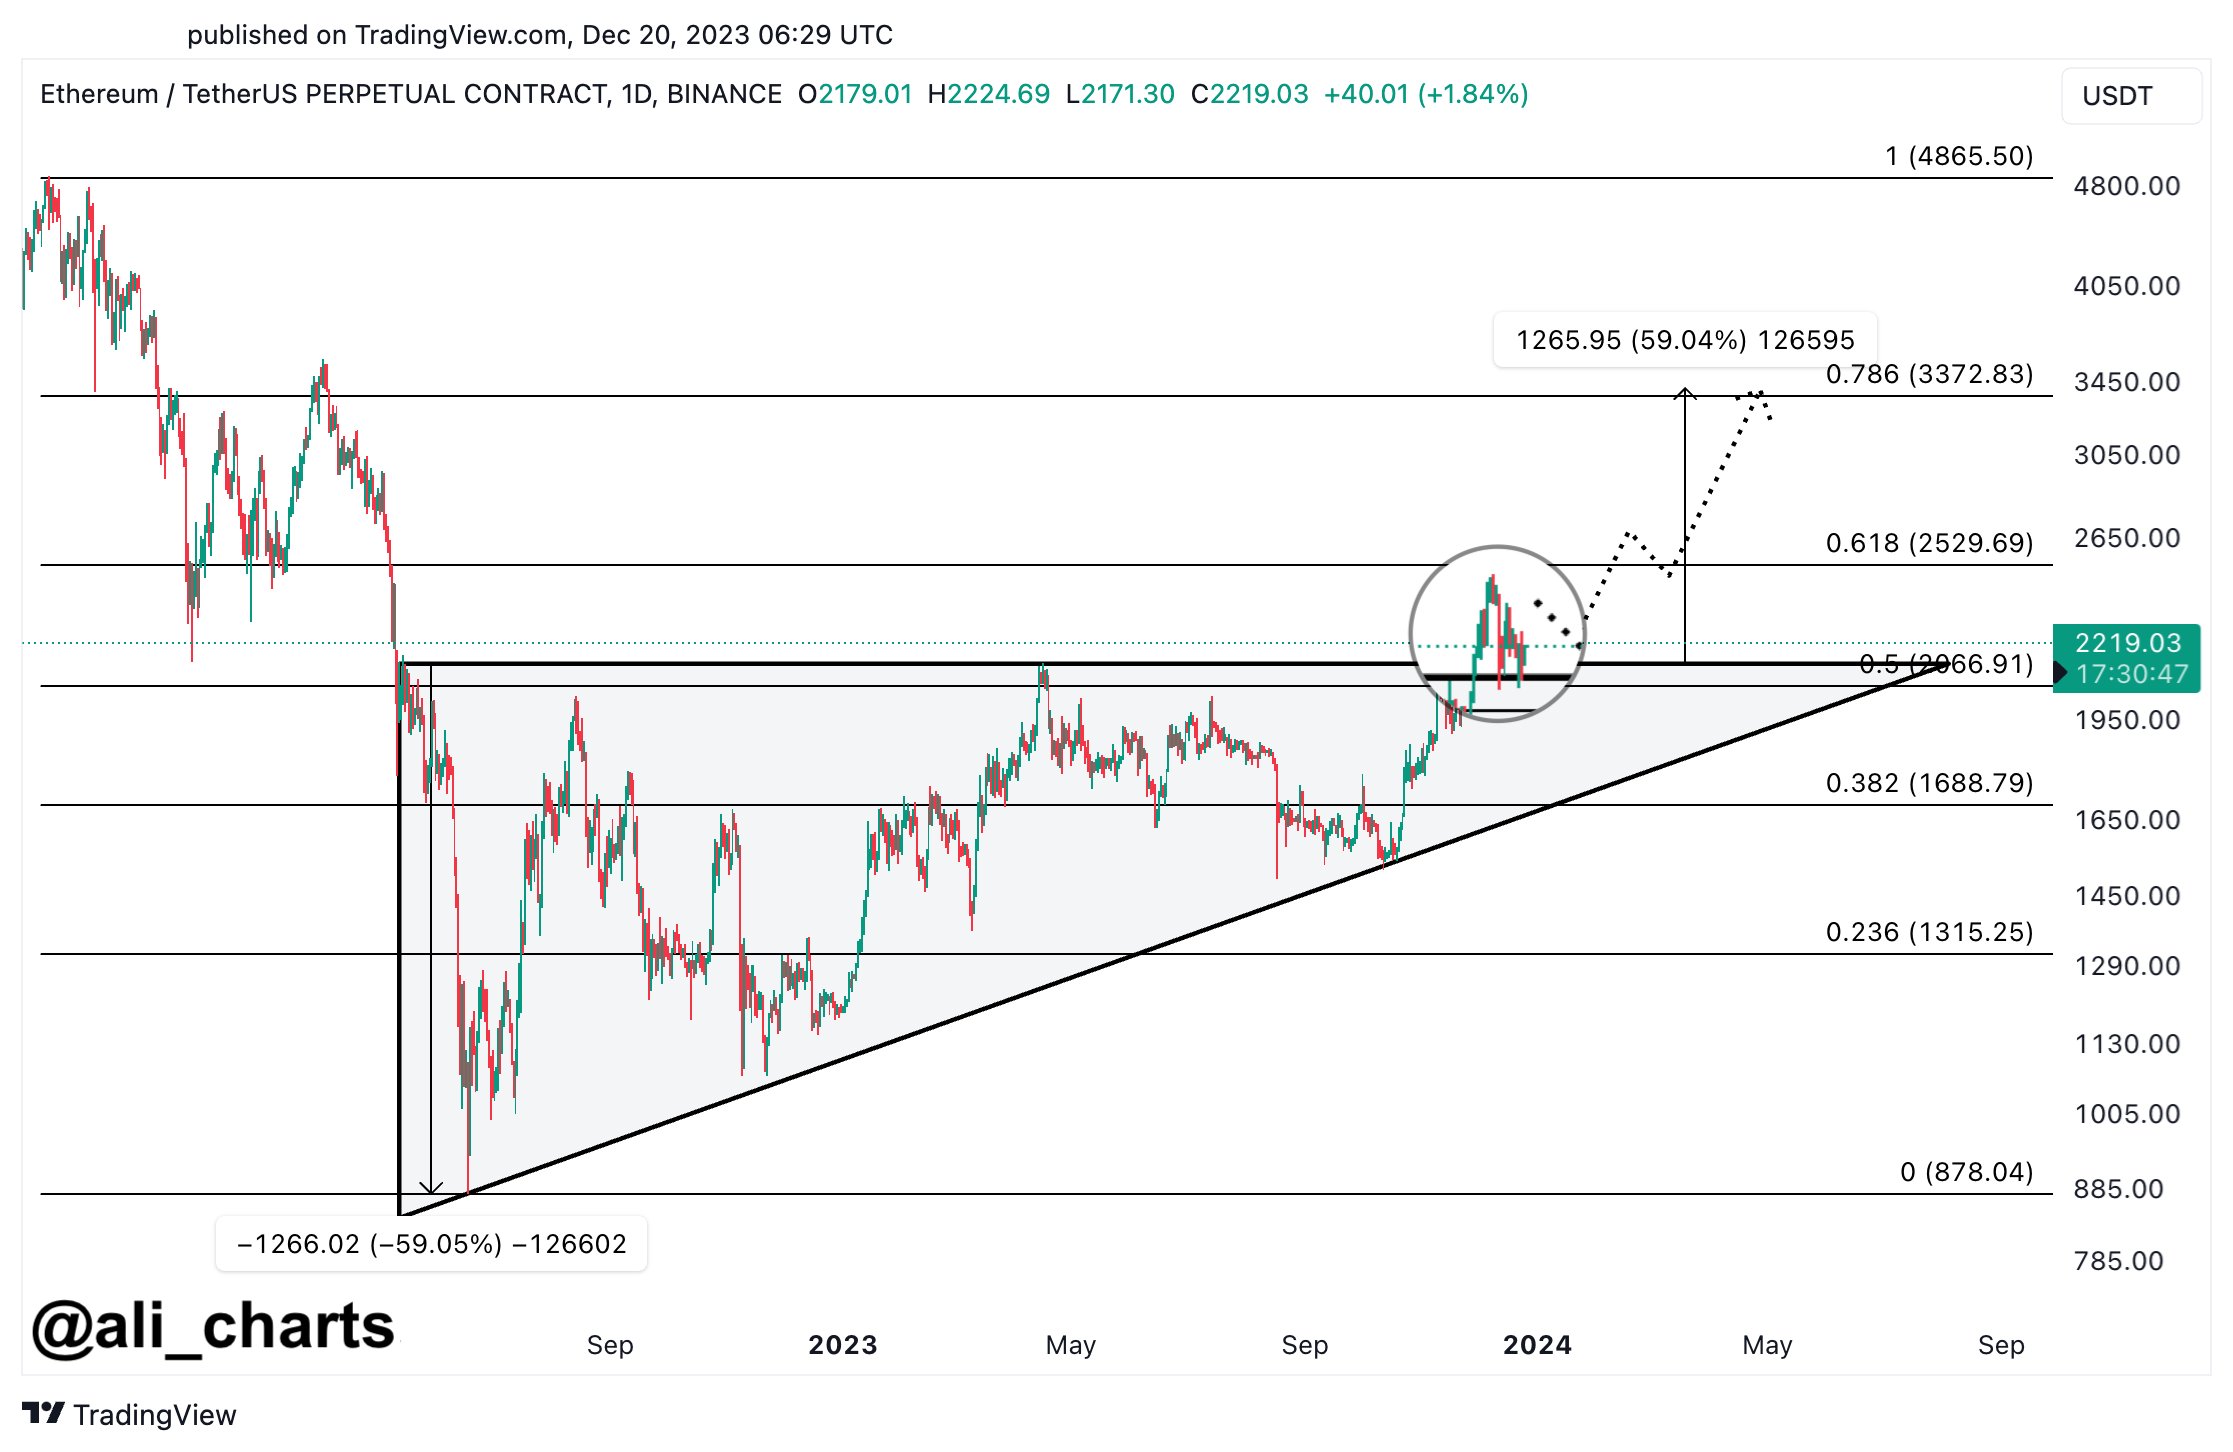
ETH Price

Ethereum has gradually increased over the last few days, as its price has now reached $3,200.

Ethereum Price Chart

Ethereum Leaves Bitcoin Behind, But Is This Rally Sustainable?

Ethereum has left Bitcoin in the dust with its latest rally towards $3,100. Here’s whether this run is sustainable based on futures market data.

Ethereum Has Separated From Bitcoin With Over 7% Jump In Past Week

While Bitcoin has been in consolidation lately, Ethereum appears to have been putting together bullish momentum entirely of its own, as the asset has jumped more than 7% in the past week.

The chart below shows how ETH has performed during the last month.

Ethereum Price Chart

In the last 24 hours, Ethereum reached a peak of $3,130 level, a mark it only reached for the first time since the first half of April 2022. Since then, the coin has come down a bit, as it now floats around $3,100.

Nonetheless, despite this small retrace, ETH has still performed notably better than the original cryptocurrency. Now, the asset’s investors might be wondering if the coin could continue this run. Perhaps data related to the futures market might shed some light.

ETH Funding Rates Have Been At Positive Levels Recently

As pointed out by an analyst in a CryptoQuant Quicktake post, the ETH funding rate has had positive values recently. The “funding rate” is an indicator that keeps track of the periodic fees that traders on the futures market are exchanging between each other right now.

When the value of this metric is positive, it means that the long holders are currently paying a premium to the short investors to hold onto their holdings. Such a trend implies the majority sentiment in the futures market is bullish.

On the other hand, the indicator being negative implies a bearish sentiment is dominant in the sector right now as the short holders outweigh the long traders.

Now, here is a chart that shows the trend in the 30-day simple moving average (SMA) of the Ethereum funding rate over the past couple of years:

Ethereum Funding Rates

As the above graph shows, the 30-day SMA Ethereum funding rate had shot up to extremely high levels in the first half of January. Interestingly, this is when the market top due to the Bitcoin spot ETFs occurred.

After the price drawdown following the event, the funding rate calmed as the longs that had piled up saw liquidation. As the recent rally in the coin has occurred, the funding rate has once again gone up.

However, This time, the 30-day SMA Ethereum funding rate isn’t quite at the extreme levels it was last month. This could mean that the futures market isn’t yet too overheated.

Naturally, this could potentially allow for the current Ethereum rally to go on for a while still. It should be noted, though, that as the funding rates go higher, the chances of a long squeeze taking place go up.

Thus, while ETH may not be quite at the same risk as last month, a long squeeze could still be on the horizon, becoming more probable to happen as the speculators continue to open up more positions.

Ethereum Breaks $2,900, But Watch Out For Futures Overheating

Ethereum has broken beyond the $2,900 level during the past day, but data shows the futures market may be starting to become overheated.

Ethereum Has Now Broken Through The $2,900 Level

While Bitcoin has slumped to an overall sideways trajectory recently, Ethereum appears to have decided to pick a path of its own, as the second largest asset in the sector has surged almost 4% over the past 24 hours.

During this latest jump, Ethereum has touched the $2,900 mark for the first time since the start of May 2022. The below chart shows how the coin has performed over the last few days.

Ethereum Price Chart

Following this rise, Ethereum investors would now be enjoying profits of more than 16% over the past week. In the same period, Bitcoin has only put together returns of about 8%.

While ETH’s decoupling may be an optimistic sign for the asset, a pattern seems to be emerging that could prove to be a worrying sign.

ETH Open Interest Has Observed A Sharp Increase Recently

As explained by an analyst in a CryptoQuant Quicktake post, the ETH Open Interest has gone through a strong surge recently. The “Open Interest” is an indicator that keeps track of the total amount of Bitcoin futures contracts that are currently open on all centralized derivative exchanges.

When the value of this metric rises, it means that the investors are opening up fresh positions on the futures market right now. Generally, total leverage in the sector goes up as more positions pop up, so this trend can result in a higher amount of volatility for the cryptocurrency.

On the other hand, a decline in the indicator implies ETH futures contract holders are either closing up their positions of their own volition, or are being liquidated by their platform. The asset’s price may behave more stably following such a decrease.

Now, here is a chart that shows the trend in the Ethereum Open Interest over the last few years:

quicktake-image

From the graph, it’s visible that the Ethereum Open Interest has risen to high levels recently and has attained a peak that’s higher than any witnessed in almost two years.

“This surge indicates sustained confidence among futures traders in Ethereum’s current uptrend,” notes the quant. “However, given the impulsive nature of the recent ascent, traders should exercise caution and consider the potential for sudden liquidation events, which could trigger notable short to mid-term price declines.”

As mentioned before, the asset becomes more likely to show volatility when this indicator rises. The source of this volatility can be mass liquidation events called squeezes, which can trigger a violent cascade effect on the futures market, amplifying the price swing that triggered the event.

Since the Ethereum Open Interest is very high right now, a futures squeeze could definitely be a possibility for the cryptocurrency.

Ethereum Breaks Above $2,400: This Metric Points To Further Upside

On-chain data shows an Ethereum metric is giving a bullish signal as the cryptocurrency’s price has broken past the $2,400 barrier during the past day.

Ethereum Has Continued To Leave Exchanges Recently

In a CryptoQuant Quicktake post, an analyst explained the recent relationship between the Ethereum price and data of the exchange netflow indicator.

The “exchange netflow” here refers to a metric that keeps track of the net amount of the asset entering or exiting out of the wallets of all centralized exchanges. The indicator’s value is calculated by subtracting the outflows from the inflows.

When the flow has a positive value, the inflows are overwhelming the outflows right now, and a net number of coins is moving into the custody of these platforms.

One of the main reasons investors might deposit their tokens on the exchanges is for selling-related purposes. This trend can potentially have bearish implications for the asset’s price.

On the other hand, the negative indicator implies the holders are making net withdrawals from these platforms. Such a trend suggests the investors may be accumulating for the long-term, which would naturally be bullish for the cryptocurrency’s value.

Now, here is a chart that shows the trend in the Ethereum exchange netflow, as well as its 14-day exponential moving average (EMA), over the last few months:

Ethereum Exchange Netflow

As highlighted by the quant in the above graph, the Ethereum price has observed an overall bullish trend in the last few months as the 14-day EMA exchange netflow has mostly been inside the negative territory.

There have been some spikes in the positive region. With these net deposits, the cryptocurrency has usually encountered some degree of resistance, implying that these transfers added to the selling pressure in the market.

Recently, the indicator has assumed red values for more than a week straight, suggesting that investors have been constantly making net withdrawals. The scale of the negative spikes has also been quite significant this time, meaning that some whales are involved.

Off the back of this potential accumulation from the investors, Ethereum has observed its recovery below the $2,400 level. Since the netflow has continued to be quite negative recently, it’s possible that this rally isn’t all the coin would see; there may still be potential for further upside.

Spikes back into positive territory may be to watch for; however, if the pattern followed in the past few months is to be believed, they may cause the cryptocurrency to hit at least a local top.

ETH Price

At the time of writing, Ethereum is trading at around $2,420, up more than 6% over the past week.

Ethereum Price Chart

Ethereum Futures Market Cool Off Sets Stage For ETH To Rally: Quant

An analyst has explained that the latest cooldown in the Ethereum futures market could suggest there is potential for a price rise to resume for ETH.

Ethereum Funding Rates Have Seen A Decline Recently

An analyst in a CryptoQuant Quicktake post explained that the ETH funding rates have seen a cooldown from their previously overheated levels. The “funding rate” refers to the periodic fees that futures contract holders on derivative platforms currently exchange with each other.

When the value of this metric is positive, it means that the long contract holders are paying a premium to the shorts to hold onto their positions. Such a trend implies that most traders share a bullish sentiment right now.

On the other hand, the under zero indicates that a bearish sentiment is currently dominant in the futures market, as the short traders are overwhelming the longs.

Now, here is a chart that shows the trend in the Ethereum funding rates over the last few months:

Ethereum Funding Rates

As displayed in the above graph, the Ethereum funding rates have been mostly positive during the last few months, implying that traders on the futures side of the market have mostly been bullish about the asset.

The few times that the metric did dip into the negative inside this period didn’t turn out to be anything major, as the indicator only attained low red values and rebounded back inside the green territory without too much wait.

The chart shows that during some phases of this lasting period of bullish sentiment, the metric attained particularly high values. “However, it’s crucial to note that elevated values in funding rates raise concerns about a potential overheated state in the perpetual markets, signaling the possibility of an impending long-squeeze event,” notes the quant.

A “squeeze” is an event in which a sharp swing in the price triggers a large number of liquidations, which in turn feed into this price move, elongating it and causing further liquidations.

When such a cascade of liquidations affects the long side of the market (that is, the price move in question is a rapid drawdown), the event is known as a “long squeeze.”

Generally, the side of the futures market most heavily dominated by traders is likelier to fall prey to a squeeze. Thus, when the funding rates are highly positive, a long squeeze can be more probable.

Recently, though, as Ethereum has gone through its latest correction, so have the funding rates. Although they are still positive, their magnitude may no longer be associated with an overheated market, and the risk of a long squeeze would have thus fallen.

“Consequently, there exists the potential for the price to resume its upward trajectory following the completion of the ongoing correction stage,” explains the analyst.

ETH Price

Ethereum has declined by around 5% during the past week as its price has now fallen under $2,400.

Ethereum Price Chart

$3,830 & $5,100 Next Major Ethereum Targets According To This Model

An analyst has explained that $3,830 and $5,100 could be the next major targets for Ethereum based on an on-chain pricing model.

Ethereum MVRV Pricing Bands Have Next Targets At $3,830 And $5,100

In a new post on X, analyst Ali talked about the next key targets for Ethereum based on the “MVRV Pricing Bands.” The “Market Value to Realized Value” (MVRV) is a popular ratio in on-chain analysis calculated by dividing the Bitcoin market cap by its realized cap.

The “realized cap” here refers to a capitalization model for BTC that assumes that the true value of any coin in circulation is not the current spot price but the value at which the coin was last transacted on the blockchain.

The last transfer price of any coin may be considered as its buying price, so the realized cap considers the cost basis of all the investors. Put another way, the indicator keeps track of the total amount the holders have invested in the cryptocurrency.

Thus, the MVRV ratio tells us how the value that the investors hold right now (the market cap) compares against the total investment they made. Because of this, the MVRV ratio is often used to judge whether the asset is overpriced or underpriced currently.

Now, here is a chart that shows “pricing bands” for Ethereum corresponding to different values of the MVRV ratio:

Ethereum MVRV Ratio

As displayed in the above graph, Ethereum currently trades above the 0.8 and 1.0 MVRV Pricing Bands. At these lines, the MVRV ratio is 0.8 and 1.0, respectively.

When the price is under these lines, the investors are in a state of loss, and the asset may thus be considered “undervalued.” Historically, this is where bottoms have become more likely to form for the cryptocurrency.

ETH is currently on its way up, with the gap to these lines widening. From the chart, it’s visible that the next important MVRV Pricing Bands are 2.4 and 3.2. At these levels, Ethereum becomes overheated as the investors carry significantly more than they put into the coin.

Profit-taking becomes much more likely when this happens, which can impede any price rise. In the past, the major tops in the cryptocurrency have formed when the price has been above one or both of these levels.

These two MVRV Pricing Bands currently correspond to ETH prices of around $3,830 and $5,100, respectively. Therefore, these ceilings may be ones to watch currently, as the asset hitting the targets could imply that it’s starting to become overvalued.

ETH Price

Ethereum has enjoyed a 4% jump during the past day and has breached the $2,400 level.

Ethereum Price Chart

Ethereum “Set For Further Gains,” Analyst Puts This Target

An analyst has explained that Ethereum could be set to see a further rally based on on-chain data. Here’s the level ETH may end up surpassing.

Ethereum Has No Significant On-Chain Resistance Ahead

In a new post on X, analyst Ali has discussed how Ethereum’s support and resistance levels are looking like based on on-chain data. In on-chain analysis, the potential for any level to provide any notable amount of support/resistance to the price depends on the number of investors who acquired their coins.

Here is a chart that shows the amount of ETH that was bought at some of the price ranges that the asset has visited before:

Ethereum On-Chain Support & Resistance

The graph shows that the $2,235 to $2,302 range carries the cost basis of a significant number of coins. More specifically, 1.84 million addresses acquired more than 6 million ETH inside this range.

Currently, the Ethereum price is trading just above this range, implying that all these investors are in the green. If the Ethereum spot price retraces into this range, these holders could show some reaction, as their profit-loss boundary would be retested.

Since these holders would have been in profits just before the retest, they might want to buy more, as they may believe that this same price range that was profitable earlier might turn out to be a worthy buy again.

Since the range is thick with investors, this buying effect that may arise on a retest could end up providing support to the price. If the support fails, the price might be between $1,958 and $2,029.

This range is much more robust, hosting a cost basis of over 37 million ETH. Ali notes that this support could potentially help cushion any corrections that may take place.

Now, Ethereum has strong support below, and as is apparent in the chart, there is no major demand wall above it simultaneously. Investors in loss (those with a cost basis higher than the current spot price) may be desperate to escape the market, so the price rising to their break-even can be an enticing exit opportunity.

If many holders are sitting at a loss, their demand zone could provide significant resistance to the price because of such selling. ETH has no such obstacles in the nearby price ranges so that the coin could rally further. “The path ahead of ETH is clear, with no significant supply barriers in sight, suggesting a potential rise to $2,700 or beyond,” explains the analyst.

The market intelligence platform IntoTheBlock has also shared a chart that could provide further evidence for a bullish case of Ethereum.

Ethereum Long-Term Holders

As is visible in the above graph, the percentage of Ethereum investors who can be classified as “HODLers” (1 year+ holding time) has shot up recently. “This year, the percent of long-term ETH holders surpassed that of Bitcoin for the second time ever!” notes IntoTheBlock.

ETH Price

Ethereum is currently at the $2,316 mark, not too far above the support zone mentioned earlier.

Ethereum Price Chart

Ethereum Retests Breakout Zone, Analyst Sets $3,500 Target

An analyst has explained how Ethereum is retesting a breakout zone currently and that this might lead toward a price target of $3,500.

Ethereum Is Retesting The Breakout Line Of An Ascending Triangle

As pointed out by analyst Ali in a new post on X, Ethereum may be preparing for a further climb right now as it’s retesting the breakout zone of an ascending triangle.

An “ascending triangle” is a pattern in technical analysis that, as its name implies, resembles a triangle. The pattern involves a horizontal line made by connecting highs and a slant line that strings together higher lows.

When the price retests the upper, horizontal level, it could be probable to feel some resistance. On the other hand, a touch of the lower level could lead to the price rebounding back up.

A break out of either of these lines suggests a potential sustained continuation of the trend. Naturally, an escape out of the triangle towards the upside implies bullish momentum, while a fall under means bearish momentum.

Like the ascending triangle, there is also the “descending triangle,” which is a similar pattern except for the fact that the two levels are switched around (as the prevailing trend is towards the downside).

Now, here is the chart shared by Ali that displays how the price is interacting with an ascending triangle right now:

Ethereum Ascending Triangle

As is visible in the graph, Ethereum found a bottom at the lower line of this ascending triangle pattern back in October. Following this low, the asset turned itself around with a sharp rally and went on to challenge the upper line.

The cryptocurrency succeeded in finding a break above the triangle and observed a continuation of the bullish momentum, exploring new highs for the year. Recently, though, the asset has slumped back again and has now fallen towards the triangle’s breakout line.

So far, the line has provided support to the asset, as its price has been able to remain above it. The analyst believes that this retest could be a sign that the coin is preparing for a further rally.

“The price range between $2,150 and $1,900 could be the ideal zone for accumulation before ETH sets its sights on a higher target of $3,500,” explains Ali. From the current price, such a target would mean a rally of almost 60% for the asset.

October, the month when Ethereum turned itself around off the triangle’s slope, was also an inflection point for the asset in terms of on-chain activity, as the analytics firm Glassnode has explained in its latest weekly report.

Ethereum On-Chain Activity

From the chart, it’s visible that the Ethereum transaction count and transfer volume have both been trending up since the inflection point a couple of months back, which could be bullish for the price.

ETH Price

Ethereum has gone a bit stale recently as it has been consolidating around the $2,200 mark.

Ethereum Price Chart

Ethereum Bounces Off Support Zone: Path To New All-Time High Set?

On-chain data shows Ethereum has successfully found a rebound at a major support zone, a positive sign for the asset’s exploration at higher levels.

Ethereum Recently Made A Retest Of A Strong On-Chain Support Zone

In terms of on-chain analysis, the potential of any particular price range to act as support or resistance lies in the total number of investors who bought their coins inside said price range.

The reason behind that is the holders are more likely to react whenever the price retests their cost basis or acquisition price, which is obviously an important level to them since it can flip their profit-loss situation.

A single holder showing such a reaction won’t cause any effects on the market, naturally, but if a large number of investors share their cost basis inside a tight range, the asset’s retest of the range could perhaps produce a sizeable reaction.

Hence, the larger the concentration of investors inside a particular range, the higher the ability of said range to act as resistance/support. Analyst Ali shared this chart recently in an X post that showed how the various Ethereum price ranges looked like in terms of the amount of addresses who acquired their coins at them at the time of the post:

Ethereum On-Chain Support

From the graph, it’s apparent that the $1,934 to $2,160 range is the Ethereum range that hosts the cost basis of the most amount of addresses. At the time Ali had made the post, Ethereum was retesting this range.

Now, since this range has such a high number of investors, a retest of it is probable to cause some reaction on the ETH price. But what kind of reaction would it be, support or resistance?

What decides this is the direction the price is retesting from. If the retest is from above, that is, these investors had been in profit just before the retest, then the market could feel some support.

This is because the holders might think this same price range could be profitable again in the future, so they might decide to participate in some accumulation at it.

Similarly, a retest from below could end up leading to resistance for Ethereum, as the investors might fear the asset dropping once more, so they could become more likely to sell.

Therefore, this huge range holding the cost basis of 5.85 million addresses should have acted as support for Ethereum during its latest retest. And indeed, since the retest, the asset has successfully found a rebound, as it has shot up towards higher levels.

As is visible in the chart, the ranges ahead up to the asset’s all-time high are all relatively thin with investors. This means that, thanks to the large support basis below, ETH shouldn’t have too much trouble traversing through these levels, at least in theory.

ETH Price

Since finding the rebound at the support range, Ethereum has climbed towards the $2,300 level.

Ethereum Price Chart

Crypto Analyst Says It’s “Not Too Late” To Buy Ethereum, Here’s Why

A crypto analyst has explained how the range around $2,000 could become a major Ethereum support base for years, making it not too late to buy ETH right now.

43.8 Million Ethereum Was Acquired Between $1,900 And $2,100

In a new post on X, analyst Ali has discussed about why Ethereum could still be worth getting into at this point. The analyst has cited data from the market intelligence platform IntoTheBlock to explain this, referring to the on-chain acquisition distribution of the cryptocurrency.

Ethereum On-Chain Support & Resistance

In the above graph, the dots represent the number of investors or addresses who bought their coins within the corresponding price range. Naturally, the larger the size of the dot, the more is the density of holders who bought inside the range.

It appears that out of all the price ranges that ETH has visited in its entire history, the $1,900 to $2,100 one hosts the cost basis of the largest number of holders.

ETH was just recently consolidating inside this range, and as trading occurred inside it, the investors slowly gained their cost basis there, which is why the range has now swelled so large.

Now, what relevance does this range have for Ethereum? To understand this, how investor psychology works must first be known. To any investor, their cost basis is a particular price level, as their profit-loss situation can flip when the asset’s spot price retests it.

Because of this reason, the holder might be more likely to show some kind of move when this retest takes place. If the investor had last been in profits, they might expect the same level to be profitable again, so they may just buy more.

A few investors doing such buying won’t make the market budge at all, but if a large number of investors bought inside the same tight range, the levels might just end up providing support to Ethereum should it make a retest.

The $1,900 to $2,100 buyers are obviously in profits, so this range, which hosts the cost basis of 5.85 million addresses who acquired 43.8 million ETH there, could show a major buying reaction if ETH dips towards it. Ali explains, “this range could become a significant support level for years ahead. So, it’s not too late to get in on ETH!”

In another post yesterday, the same analyst had posted the Ethereum weekly chart, noting that if ETH could secure a sustained candle close above the $2,150 mark, the asset could be set for some exciting uptrend.

Ethereum Triangle

As is visible from the chart, the ETH weekly price could be breaking above an ascending triangle pattern. “Targets in sight? We could be looking at ETH marching towards $2,600, and possibly even soaring to $3,500!” says Ali.

ETH Price

Ethereum has enjoyed some fresh bullish momentum during the past few days as it has now soared above the $2,200 mark.

Ethereum Price Chart

Ethereum Conquers $2,100: On-Chain Data Paints Path To $2,400

Ethereum has cleared the $2,100 level during the past day, and if on-chain data is anything to go by, a rally to new yearly highs should be “easy.”

Ethereum Has No Major On-Chain Resistance At Higher Levels

An analyst in a post on X explained that Ethereum has overcome a major on-chain resistance zone with its recent price rally. The on-chain resistance and support levels are defined based on the density of investors who bought at them.

The reason behind this lies in how investor psychology tends to work. For any investor, their cost basis is an important level, so whenever the price retests, they pay special attention and might be tempted to make some kind of move.

A holder who had been at a loss before the retest might lean towards selling, as they may fear the cryptocurrency would dip below it again, so exiting at the break-even would at least mean they would avoid losses.

Similarly, an investor might decide to accumulate more if they had been in profits earlier, as they would see this same level as a profitable point of entry into the asset.

Now, here is a chart that shows how the Ethereum price ranges around the current price are looking in terms of the density of investors who share their cost basis there:

Ethereum Support & Resistance

As displayed in the above graph, the Ethereum price range between $1,982 and $2,044 hosts the cost basis of about 1.67 million addresses, which acquired 38.73 million ETH at these levels.

Naturally, the more investors that share their cost basis inside a specific range, the stronger the reaction that the price would feel when it retests due to the aforementioned buying/selling effects.

Thus, this range that’s thick with investors would be a significant zone for the cryptocurrency. Since Ethereum has already surged past this area and has gained some distance over it with its latest break, the range is likely to play the role of support now.

Ethereum has this strong support area under its belt, while at the same time, there are no major resistance zones immediately above, as is apparent from the chart. This ideal setup means that, in theory, ETH shouldn’t have much trouble rallying towards the $2,426 level.

Another analyst has also pointed out how Ethereum has observed negative exchange netflows since the start of the month. The exchange netflow here is an indicator that keeps track of the net amount of ETH exiting or entering the wallets of all centralized exchanges.

Ethereum Netflows

The net outflows have amounted to over $1 billion during this period, a potential sign that significant buying has been occurring in the space. This certainly fuels the idea that ETH could explore new yearly highs shortly.

ETH Price

At the time of writing, Ethereum is trading at around $2,100, up 9% in the past week.

Ethereum Price Chart

Ethereum At $2,100: Why Path To $2,500 Is Now All Clear

On-chain data suggests the path to $2,500 could be open for Ethereum now that the asset has managed to cross the $2,100 mark.

Ethereum Has No Major Resistance Levels Until $2,500

In a new post on X, the market intelligence platform IntoTheBlock has provided an update on how the Ethereum levels are looking in terms of on-chain support and resistance. In on-chain analysis, ranges are defined as support or resistance based on how many investors acquired their coins inside them.

The below chart shows the density of addresses at various levels above and below the current spot price of the cryptocurrency:

Ethereum Support & Resistance

Generally, whenever the Ethereum price retests the cost basis of an investor, they may be more likely to show some kind of move. When this retest happens from above, the holder may be inclined to believe the price will go up again soon so they may see the retest as a “dip” and thus, might decide to buy more.

Related Reading: Polygon (MATIC) Jumps Another 6% As Whales Show High Activity

On the other hand, the investor may want to exit the market if the retest is from below, as they might fear the price would go down again in the future, and by selling at the break-even mark, they would at least avoid incurring any losses.

A few investors showing such behavior is obviously not enough to cause any visible effects on the market, but if a large number of investors share the same cost basis, the asset could very well feel a sizeable reaction.

From the chart, it’s visible that there are some large cost basis centers below the current Ethereum levels, suggesting the presence of strong potential support ranges.

Earlier, when the asset had still been below $2,000, the $2,000 to $2,100 range posed as the last major resistance boundary to break. Since the coin has now risen above these prices, it’s possible that the range would be switching its role towards being support instead.

Following this latest rally, about 75% of the holders are now in profit (that is, their cost basis is in the levels below). As is visible in the graph, there are no price ranges with a high density of investors in the upcoming price levels, until the $2,500 mark.

“Does this mean it’s a clean run to a new ATH? Not necessarily,” explains IntoTheBlock. “Historically, profit-taking at these levels is common and leads to pullbacks. However, this is unlikely to significantly impact Ethereum’s long-term trajectory.”

Analyst Ali Martinez has also pointed out something interesting in an X post today. He revealed that the latest rally in ETH has occurred without the support of the largest of the Ethereum whales (carrying a balance greater than 10,000 ETH), the so-called “mega whales.”

Ethereum Mega Whales

As highlighted in the graph, the total number of addresses owned by the Ethereum mega whales has been flat recently. “Ethereum has reclaimed the $2,000 threshold, and intriguingly, this is all happening before whales have even started buying ETH!” notes Ali.

ETH Price

After a surge of more than 9% in the past 24 hours, Ethereum has arrived at the $2,100 level for the first time since April.

Ethereum Price Chart

Will Ethereum Rally Continue? These Could Be The Factors To Watch

The data of two on-chain indicators may be referred to for finding out whether the latest Ethereum rally can go on or not.

Ethereum Has Enjoyed A Sharp Rally Of More Than 12% In The Past Week

Like the rest of the cryptocurrency market, Ethereum has observed a rally during the past few days. Although the coin’s bullish momentum hasn’t been quite as strong as Bitcoin’s, its weekly gains of 12% are still nonetheless significant.

Yesterday, the asset had been carrying even higher profits, as its price had touched above $1,850. In the past day, though, ETH has noted some drawdown, as it’s now trading under the $1,800 level.

Ethereum Price Chart

After the pullback, some investors have been wondering whether the Ethereum rally is done for now or if it has hopes for continuing further. On-chain data from Santiment may hold some hints about that.

ETH Exchange Supply Has Plunged, While Whale Transfers Have Spiked

In a new post on X, the on-chain analytics firm Santiment has discussed two important ETH metrics. The first of these is the “whale transaction count,” which keeps track of the total number of Ethereum transactions that carry a value of at least $100,000.

Generally, only the whale entities are capable of moving such a large amount of the asset with a single transfer, so transactions of this scale are assumed to reflect the behavior of these humongous investors.

The below chart shows the trend in this ETH indicator over the past few months.

Ethereum Whale Transaction Count

As displayed in the above graph, the Ethereum whale transaction count has observed some pretty high values recently. This suggests that these large holders have been quite active in the market.

At the peak of this spike, the indicator had a value of 6,049, which is the highest number of daily transactions that the whales have made on the network since April of this year.

The whale transaction count metric by itself can’t point towards a bullish or bearish outcome for the cryptocurrency, as both selling and buying transfers are included in the count.

It’s true, however, that whales would need to stay active if the rally has to continue, as their contribution will provide the necessary fuel for it. So far, the whales have been active indeed, but it remains to be seen whether they are still buying or if they are pivoting towards selling. The pullback in the Ethereum price may hint towards the latter.

The other indicator that Santiment has attached to the chart is the “supply on exchanges,” which measures the percentage of the total circulating ETH supply that’s sitting in the wallets of all centralized exchanges.

From the graph, it’s visible that this indicator has only continued to slide down since the rally started, implying that investors have continued to make net withdrawals from these platforms.

At present, 8.41% of the ETH supply is on exchanges, which is the lowest level since July 2015. Holders continuing to withdraw their coins can be a constructive sign for the cryptocurrency, as it can be a sign that accumulation is going on.

This Ethereum Metric Is Retesting The Bear-Bull Junction, Will Break Happen?

On-chain data shows the Ethereum MVRV ratio is currently testing a level that has historically served as the boundary between bear and bull markets.

Ethereum MVRV Ratio Is Retesting Its 180-Day SMA Right Now

The “Market Value to Realized Value (MVRV) ratio” is an indicator that measures the ratio between the Ethereum market cap and realized cap. The former is naturally just the total supply valuation at its spot price. At the same time, the latter is an on-chain capitalization model that calculates the value differently.

The realized cap assumes that the real value of any coin in circulation isn’t the spot price (which the market cap refers to) but the price at which it was last bought/transferred on the blockchain.

One way to look at the realized cap is that it represents the total amount of capital that the investors have put into the cryptocurrency, as it considers each holder’s cost basis or buying price.

Since the MVRV ratio compares these two capitalization models, it can tell us whether the investors hold more or less value than they initially invested in Ethereum.

The indicator’s usefulness is that it may serve as a way to determine whether the asset’s price is fair or not right now. When the investors hold a value significantly more than they put in (that is, they are in high profits), they would be more tempted to sell, and hence, the spot price could face a correction.

Similarly, the holders as a whole being in deep losses can instead be a signal that the bottom might be near for the cryptocurrency, as it’s becoming quite underpriced.

Now, here is a chart shared by analyst Ali on X, which shows the trend in the Ethereum MVRV ratio, as well as its 180-day simple moving average (SMA), over the past few years:

Ethereum MVRV Momentum

The 180-day SMA of the ETH MVRV ratio has interestingly held significance for the cryptocurrency. According to Ali, “Ethereum market cycles transition from bearish to bullish when the MVRV (blue line) breaks strongly above the MVRV 180-day SMA (red line).”

During the bear market last year, the ratio had been below the 180-day SMA line, but with the rally that began this year in January, the metric had managed to break above the level, and bullish winds supported the asset once more. During the recent struggle for the asset, however, the MVRV has again slipped under the level.

Nonetheless, in the past few days, the ETH MVRV has been trending up a bit and approaching another retest of this historical junction between bearish and bullish trends.

It remains to be seen whether a retest will happen in the coming days for Ethereum and if a break towards the bullish territory can be found.

ETH Price

Ethereum Price Chart

Ethereum Traders Capitulate As Rally Slows Down: Why This Is Good

On-chain data shows that Ethereum traders are capitulating following the slowdown of the rally, something that may turn out to be positive.

Ethereum Traders Are Selling At A Loss Right Now

According to data from the on-chain analytics firm Santiment, ETH investors are getting increasingly frustrated as they are now participating in significant loss-taking.

The relevant indicator here is the “ratio of daily on-chain transaction volume in profit to loss,” which, as its name already implies, compares the profit-taking volume to the loss-taking volume for any given cryptocurrency.

This metric works by going through the on-chain history of each coin being sold/transferred to see the price at which it was previously moved. If this last selling price for any coin was less than the current spot price, then that particular token is now being sold at a profit.

Naturally, the sale of this coin would count under the profit-taking volume. Similarly, the opposite type of coins would contribute towards the loss-taking volume.

Now, here is a chart that shows the trend in this ratio for some of the top assets in the cryptocurrency sector over the past few months:

Ethereum Loss-Taking

When the value of this metric is positive, it means that the profit-taking volume outweighs the loss-taking volume right now. On the other hand, negative values suggest the dominance of loss-taking in the market.

From the chart, it’s visible that many of these top assets have seen negative values of the indicator recently as the rally that began following the Grayscale news has slowed down.

Ethereum, however, stands out among these coins as the indicator’s value for the asset is significantly more negative than the likes of Bitcoin and Cardano, who are observing loss-taking volumes that are only mildly more than the profit-taking ones.

At the metric’s current value, the Ethereum investors are making loss-taking transactions at a rate nearly double that of the profit-taking ones. This difference between ETH and the other top assets would suggest that the coin traders are showing the least amount of patience.

This could be because they don’t think the cryptocurrency would continue its rally anymore, or if it does, the profits wouldn’t be as large as for some of the other altcoins, so they may be exiting here at losses to go to greener pastures.

This high amount of loss-taking could, however, actually turn out to be beneficial for Ethereum. Historically, whenever investors have participated in capitulation, rebounds in the price have become more probable.

The likely explanation behind this pattern may be the fact that investors pick up the coins that these relatively weak hands sell with a stronger conviction, who provide a better foundation for a sustainable price surge.

It remains to be seen whether Ethereum can use this capitulation to bounce off towards higher levels or if the rally will remain muted for a while longer.

ETH Price

At the time of writing, Ethereum is trading around $1,700, up 3% in the last week.

Ethereum Price Chart

Historical Crossover Suggests Ethereum (ETH) Top Is In

On-chain data shows the Ethereum taker buy/sell ratio has formed a crossover recently that has historically signaled tops in the asset’s price.

Ethereum Taker Buy/Sell Ratio 280-Day and 476-Day MAs Have Crossed Recently

As pointed out by an analyst in a CryptoQuant post, the last time this crossover formed was back in May 2021, when ETH observed the bull rally top formation. The relevant indicator here is the “Ethereum taker buy sell ratio,” which measures the ratio between the taker buy volume and the taker sell volume.

When the value of this metric is lower than 1, it means the short or the taker sell volume is currently higher than the long or the taker buy volume in the market. This kind of trend is a sign that there are more sellers willing to sell at a lower price in the market right now, implying that the selling pressure is dominant.

On the other hand, when the indicator has a value higher than 1, it suggests a bullish sentiment is shared by the majority as the long volume is greater than the sell volume.

In the context of the current discussion, the actual metrics of interest are the 280-day and 476-day moving averages (MA) of the Ethereum taker buy/sell ratio.

Here is a chart that shows the trend in these MAs of the indicator over the last few years:

Ethereum Taker Buy Sell Ratio

As shown in the above graph, the 280-day MA of the Ethereum taker buy/sell ratio declined below the 476-day MA last month. Interestingly, right as this crossover took place, the asset’s price formed a local top around the $2,100 level.

When the 280-day MA drops below the 476-day MA of this metric, it means that the market sentiment is changing towards a more bearish one, as it suggests a rise in the taker sell volume dominance.

Due to this reason, such a cross has been bearish for the cryptocurrency’s value in the past. From the chart, it’s visible that this type of crossover last formed back in May 2021, when ETH was at the height of the bull run in the first half of 2021. Coinciding with the crossover, the cryptocurrency’s price registered its then-all-time high value.

Based on this, it’s possible that the latest crossover in the Ethereum taker buy/sell ratio MAs could also prove to be bearish for the price.

So far, ETH has only declined since the top formed along with this indicator, so it seems that the crossover effect may already be in action. However, the two MAs are still quite close in value, so it’s possible a reverse cross could also possibly form in the near future.

In 2020, both types of crossovers formed several times in quick succession, until eventually the bullish type of cross won out and lead to the 2021 bull run, which could be the case here.

It now remains to be seen whether the two MAs will continue to diverge in the coming weeks, or if they will converge again and form the reverse type of crossover.

ETH Price

At the time of writing, Ethereum is trading around $1,800, down 2% in the last week.

Ethereum Price Chart

Ethereum Active Addresses At Highest Since May 2021, Good News For ETH?

On-chain data shows the Ethereum daily active addresses metric is now at the highest level since May 2021, a sign that could be positive for the latest rally above $1,300.

637,000 Unique Ethereum Addresses Have Been Showing Daily Activity Recently

According to data from on-chain analytics firm Santiment, ETH is currently observing its highest point of activity in 17 months. The “daily active addresses” is an indicator that measures the total number of Ethereum addresses that were involved as a sender or as a receiver on any given day.

When the value of this metric is high, it means traders are active on the network right now. On the other hand, low values suggest investors have been showing little activity during the past day.

The chart below shows the trend in the Ethereum daily active addresses over the last few years:

Ethereum Daily Active Addresses

As the above graph displays, the Ethereum daily active addresses have spiked up during the past week or so. In this period of increased activity, an average of 637,000 ETH addresses have been involved in some coin movement every day. The last time the network saw holders being so lively was back in May of last year when the bull run of the first half of 2021 observed its peak of around $4,300

Usually, high daily active addresses mean that the investors are interested in trading ETH at the moment. Thus, it’s natural that profit-taking opportunities like the May 2021 peak see huge bursts of activity as a large number of holders move their coins for selling purposes.

While it’s true that such activity can be bearish for the asset’s price in this way, it’s also a fact that any rally requires a large number of traders to be sustainable. Ethereum has been rallying during the last couple of days while the active addresses have been very high, suggesting that there are many interested buyers in the market right now. This could be a sign that unlike the rally efforts earlier in this bear market, which didn’t see any activity on such levels, the latest price rise may have enough fuel backing it.

Ethereum Price Chart

At the time of writing, Ethereum’s price floats around $1,300, up 8% in the last week. Over the past month, the cryptocurrency has gained 10% in value. The above chart shows the trend in the price of the coin over the last five days.

Ethereum OI Hits $7.7 Billion, Why A Rally Might Be In The Works

Ethereum open interest (OI) had seen a meteoric rise in the weeks leading up to the Ethereum Merge. Even after the Merge, the open interest has not declined, given all of the new interest from institutional investors following the network’s move to a proof of work mechanism. This time around, the Ethereum open interest has hit another important high point, which points to a possible rally in the price of ETH.

Open Interest Reaches $7.7 Billion

Ethereum open interest still remains high despite ETH’s decline to the low $1,000s back in September. Data shows that the open interest in ETH has reached $7.7 billion this week despite traders often choosing to avoid trades at quarterly closes, even in the crypto market. 

This means that there is now $7.7 billion in futures open interest, but the majority of these have actually skewed towards the bearish side. Not surprisingly, given that the crypto market is barely a year into its bear market, investors expect more decline to follow.

ETH steadies above $1,300 | Source: ETHUSD on TradingView.com

Investor sentiment also took a hit since mid-September when the long-awaited Merge upgrade failed to trigger a rally in the price of ETH. The subsequent decline had seen investors begin profit-taking to prevent more losses while watching the market closely. The same is now being seen across the futures markets.

Will Ethereum (ETH) Rally?

A large amount of open interest tends to carry some positive implications for the digital asset. The reason is that so many traders are choosing increasingly bearish positions on Ethereum as of this time, meaning that there is a potential for a short squeeze if the price were to break out from here.

Now, there is not much expected for the crypto market in the way of recovery, given declines across various spheres. But if the Fed were to heed the advice and stop increasing interest rates even in the short term, then the macro markets would likely rally, which would take the crypto market with it.

The next FOMC meeting is expected to happen at the beginning of November, which is less than a month away. There are predictions of more interest rate increases at this time, which would be negative for crypto-assets such as Ethereum.

Presently, bulls are focused on getting the price back up enough to test the $1,500 resistance once more. However, with sell pressure still mounting, ETH is not expected to hit this price anytime soon.

Featured image from Crypto News Flash, chart from TradingView.com

Follow Best Owie on Twitter for market insights, updates, and the occasional funny tweet…