Ethereum Bounces Off Support Zone: Path To New All-Time High Set?

On-chain data shows Ethereum has successfully found a rebound at a major support zone, a positive sign for the asset’s exploration at higher levels.

Ethereum Recently Made A Retest Of A Strong On-Chain Support Zone

In terms of on-chain analysis, the potential of any particular price range to act as support or resistance lies in the total number of investors who bought their coins inside said price range.

The reason behind that is the holders are more likely to react whenever the price retests their cost basis or acquisition price, which is obviously an important level to them since it can flip their profit-loss situation.

A single holder showing such a reaction won’t cause any effects on the market, naturally, but if a large number of investors share their cost basis inside a tight range, the asset’s retest of the range could perhaps produce a sizeable reaction.

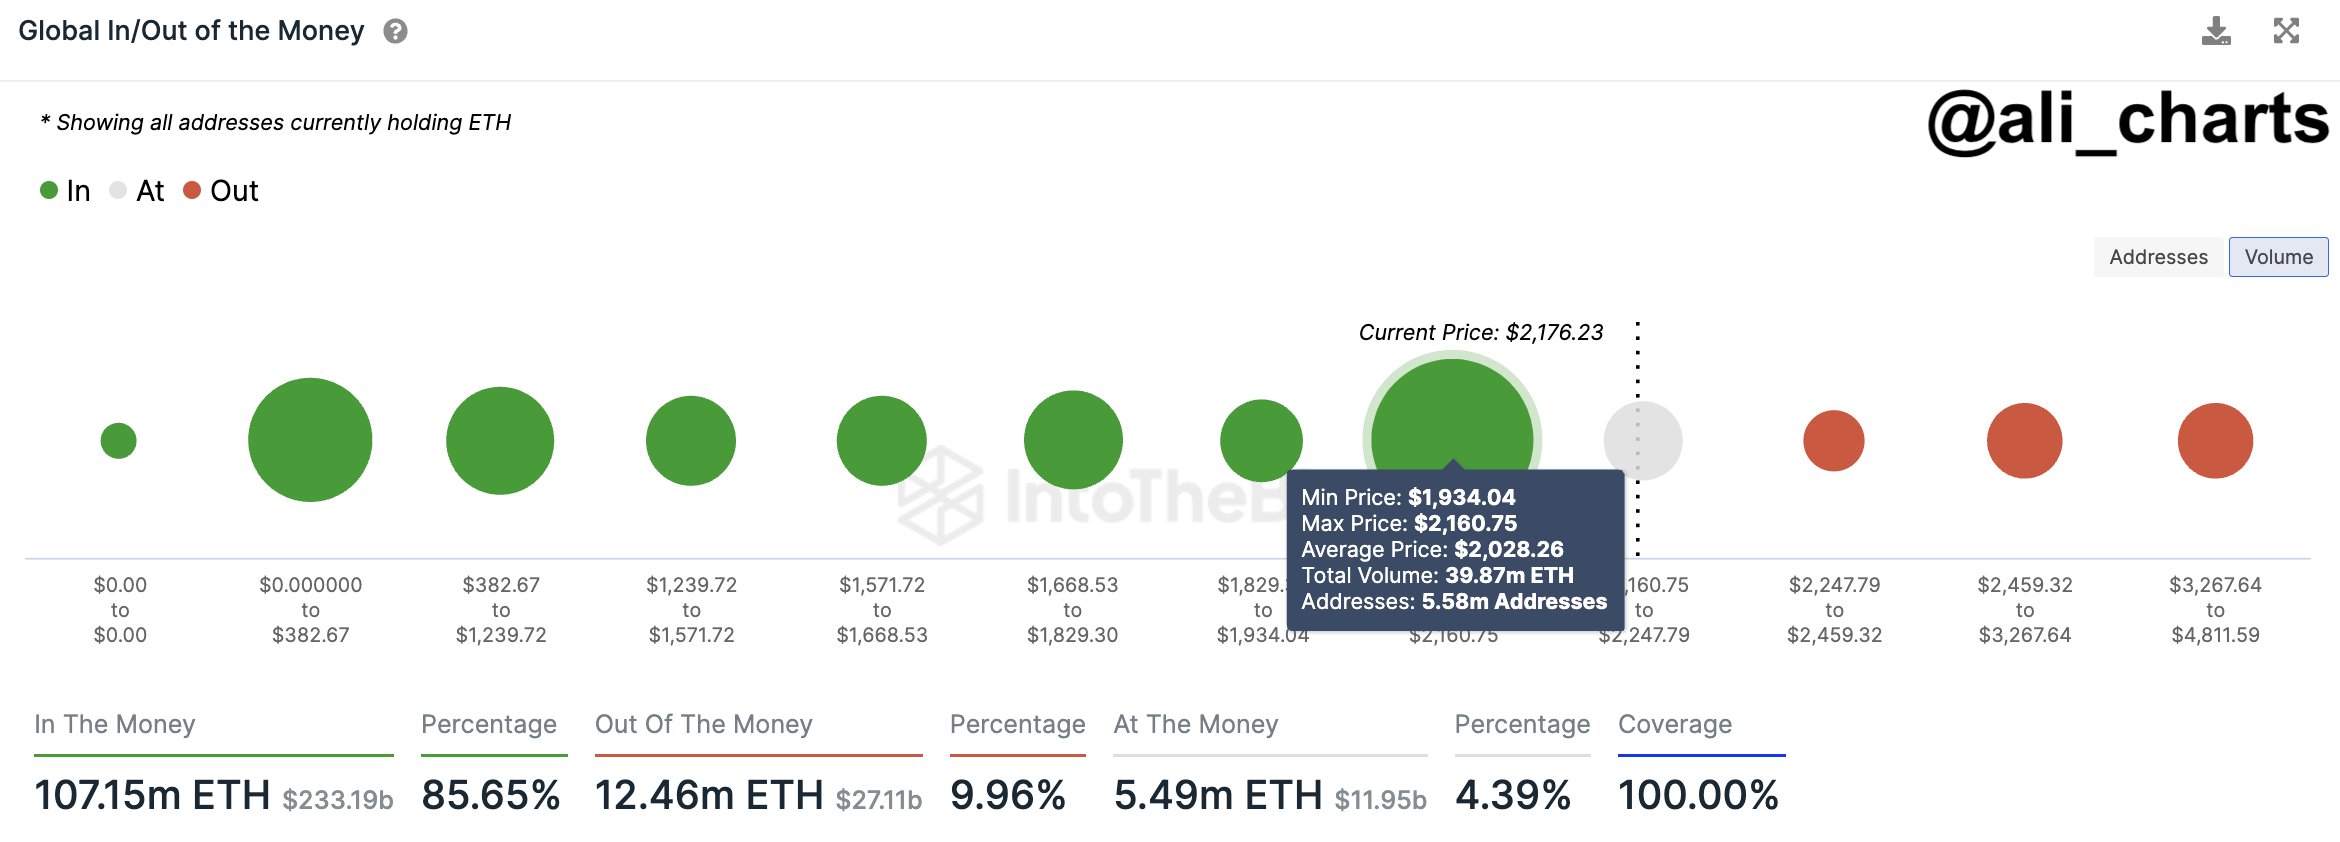
Hence, the larger the concentration of investors inside a particular range, the higher the ability of said range to act as resistance/support. Analyst Ali shared this chart recently in an X post that showed how the various Ethereum price ranges looked like in terms of the amount of addresses who acquired their coins at them at the time of the post:

Ethereum On-Chain Support

From the graph, it’s apparent that the $1,934 to $2,160 range is the Ethereum range that hosts the cost basis of the most amount of addresses. At the time Ali had made the post, Ethereum was retesting this range.

Now, since this range has such a high number of investors, a retest of it is probable to cause some reaction on the ETH price. But what kind of reaction would it be, support or resistance?

What decides this is the direction the price is retesting from. If the retest is from above, that is, these investors had been in profit just before the retest, then the market could feel some support.

This is because the holders might think this same price range could be profitable again in the future, so they might decide to participate in some accumulation at it.

Similarly, a retest from below could end up leading to resistance for Ethereum, as the investors might fear the asset dropping once more, so they could become more likely to sell.

Therefore, this huge range holding the cost basis of 5.85 million addresses should have acted as support for Ethereum during its latest retest. And indeed, since the retest, the asset has successfully found a rebound, as it has shot up towards higher levels.

As is visible in the chart, the ranges ahead up to the asset’s all-time high are all relatively thin with investors. This means that, thanks to the large support basis below, ETH shouldn’t have too much trouble traversing through these levels, at least in theory.

ETH Price

Since finding the rebound at the support range, Ethereum has climbed towards the $2,300 level.
Ethereum Price Chart

Ethereum Bounces Off Support Zone: Path To New All-Time High Set?

On-chain data shows Ethereum has successfully found a rebound at a major support zone, a positive sign for the asset’s exploration at higher levels.

Ethereum Recently Made A Retest Of A Strong On-Chain Support Zone

In terms of on-chain analysis, the potential of any particular price range to act as support or resistance lies in the total number of investors who bought their coins inside said price range.

The reason behind that is the holders are more likely to react whenever the price retests their cost basis or acquisition price, which is obviously an important level to them since it can flip their profit-loss situation.

A single holder showing such a reaction won’t cause any effects on the market, naturally, but if a large number of investors share their cost basis inside a tight range, the asset’s retest of the range could perhaps produce a sizeable reaction.

Hence, the larger the concentration of investors inside a particular range, the higher the ability of said range to act as resistance/support. Analyst Ali shared this chart recently in an X post that showed how the various Ethereum price ranges looked like in terms of the amount of addresses who acquired their coins at them at the time of the post:

Ethereum On-Chain Support

From the graph, it’s apparent that the $1,934 to $2,160 range is the Ethereum range that hosts the cost basis of the most amount of addresses. At the time Ali had made the post, Ethereum was retesting this range.

Now, since this range has such a high number of investors, a retest of it is probable to cause some reaction on the ETH price. But what kind of reaction would it be, support or resistance?

What decides this is the direction the price is retesting from. If the retest is from above, that is, these investors had been in profit just before the retest, then the market could feel some support.

This is because the holders might think this same price range could be profitable again in the future, so they might decide to participate in some accumulation at it.

Similarly, a retest from below could end up leading to resistance for Ethereum, as the investors might fear the asset dropping once more, so they could become more likely to sell.

Therefore, this huge range holding the cost basis of 5.85 million addresses should have acted as support for Ethereum during its latest retest. And indeed, since the retest, the asset has successfully found a rebound, as it has shot up towards higher levels.

As is visible in the chart, the ranges ahead up to the asset’s all-time high are all relatively thin with investors. This means that, thanks to the large support basis below, ETH shouldn’t have too much trouble traversing through these levels, at least in theory.

ETH Price

Since finding the rebound at the support range, Ethereum has climbed towards the $2,300 level.
Ethereum Price Chart

Crypto Analyst Says It’s “Not Too Late” To Buy Ethereum, Here’s Why

A crypto analyst has explained how the range around $2,000 could become a major Ethereum support base for years, making it not too late to buy ETH right now.

43.8 Million Ethereum Was Acquired Between $1,900 And $2,100

In a new post on X, analyst Ali has discussed about why Ethereum could still be worth getting into at this point. The analyst has cited data from the market intelligence platform IntoTheBlock to explain this, referring to the on-chain acquisition distribution of the cryptocurrency.

Ethereum On-Chain Support & Resistance

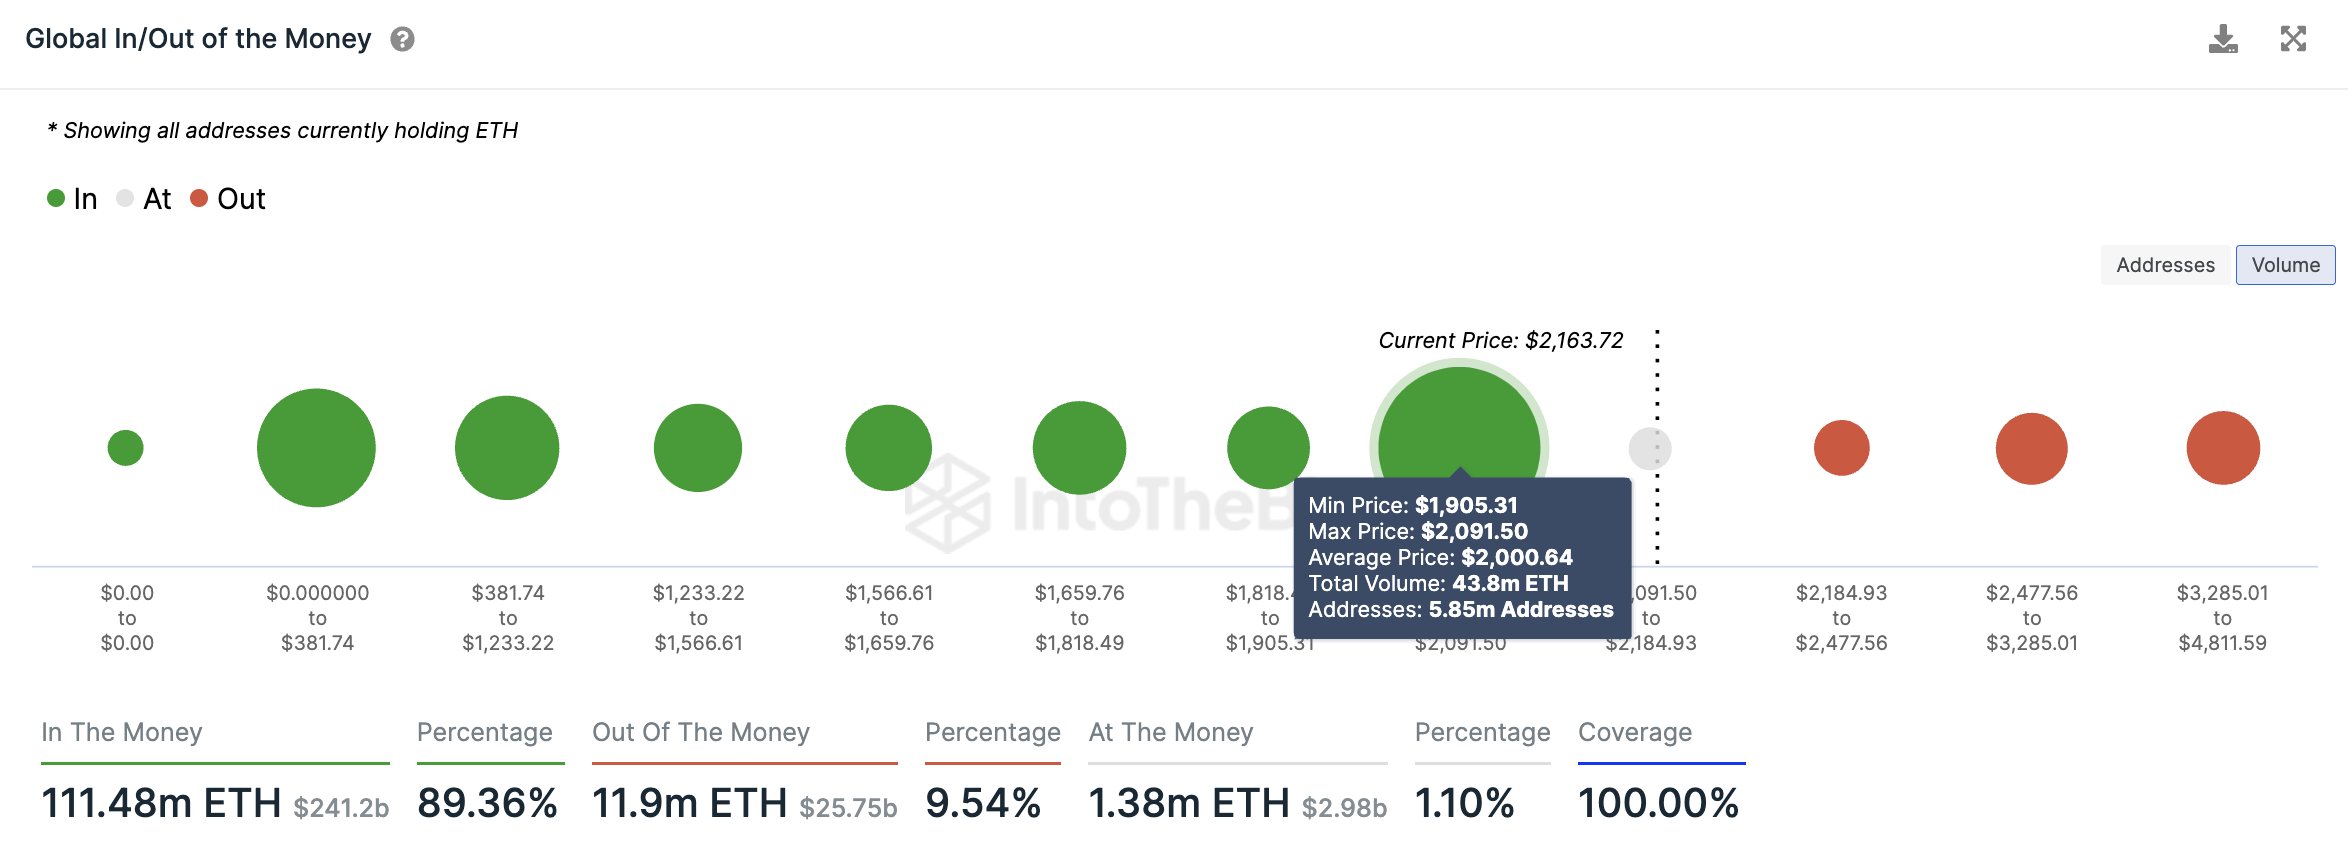
In the above graph, the dots represent the number of investors or addresses who bought their coins within the corresponding price range. Naturally, the larger the size of the dot, the more is the density of holders who bought inside the range.

It appears that out of all the price ranges that ETH has visited in its entire history, the $1,900 to $2,100 one hosts the cost basis of the largest number of holders.

ETH was just recently consolidating inside this range, and as trading occurred inside it, the investors slowly gained their cost basis there, which is why the range has now swelled so large.

Now, what relevance does this range have for Ethereum? To understand this, how investor psychology works must first be known. To any investor, their cost basis is a particular price level, as their profit-loss situation can flip when the asset’s spot price retests it.

Because of this reason, the holder might be more likely to show some kind of move when this retest takes place. If the investor had last been in profits, they might expect the same level to be profitable again, so they may just buy more.

A few investors doing such buying won’t make the market budge at all, but if a large number of investors bought inside the same tight range, the levels might just end up providing support to Ethereum should it make a retest.

The $1,900 to $2,100 buyers are obviously in profits, so this range, which hosts the cost basis of 5.85 million addresses who acquired 43.8 million ETH there, could show a major buying reaction if ETH dips towards it. Ali explains, “this range could become a significant support level for years ahead. So, it’s not too late to get in on ETH!”

In another post yesterday, the same analyst had posted the Ethereum weekly chart, noting that if ETH could secure a sustained candle close above the $2,150 mark, the asset could be set for some exciting uptrend.

Ethereum Triangle

As is visible from the chart, the ETH weekly price could be breaking above an ascending triangle pattern. “Targets in sight? We could be looking at ETH marching towards $2,600, and possibly even soaring to $3,500!” says Ali.

ETH Price

Ethereum has enjoyed some fresh bullish momentum during the past few days as it has now soared above the $2,200 mark.

Ethereum Price Chart

Ethereum Conquers $2,100: On-Chain Data Paints Path To $2,400

Ethereum has cleared the $2,100 level during the past day, and if on-chain data is anything to go by, a rally to new yearly highs should be “easy.”

Ethereum Has No Major On-Chain Resistance At Higher Levels

An analyst in a post on X explained that Ethereum has overcome a major on-chain resistance zone with its recent price rally. The on-chain resistance and support levels are defined based on the density of investors who bought at them.

The reason behind this lies in how investor psychology tends to work. For any investor, their cost basis is an important level, so whenever the price retests, they pay special attention and might be tempted to make some kind of move.

A holder who had been at a loss before the retest might lean towards selling, as they may fear the cryptocurrency would dip below it again, so exiting at the break-even would at least mean they would avoid losses.

Similarly, an investor might decide to accumulate more if they had been in profits earlier, as they would see this same level as a profitable point of entry into the asset.

Now, here is a chart that shows how the Ethereum price ranges around the current price are looking in terms of the density of investors who share their cost basis there:

Ethereum Support & Resistance

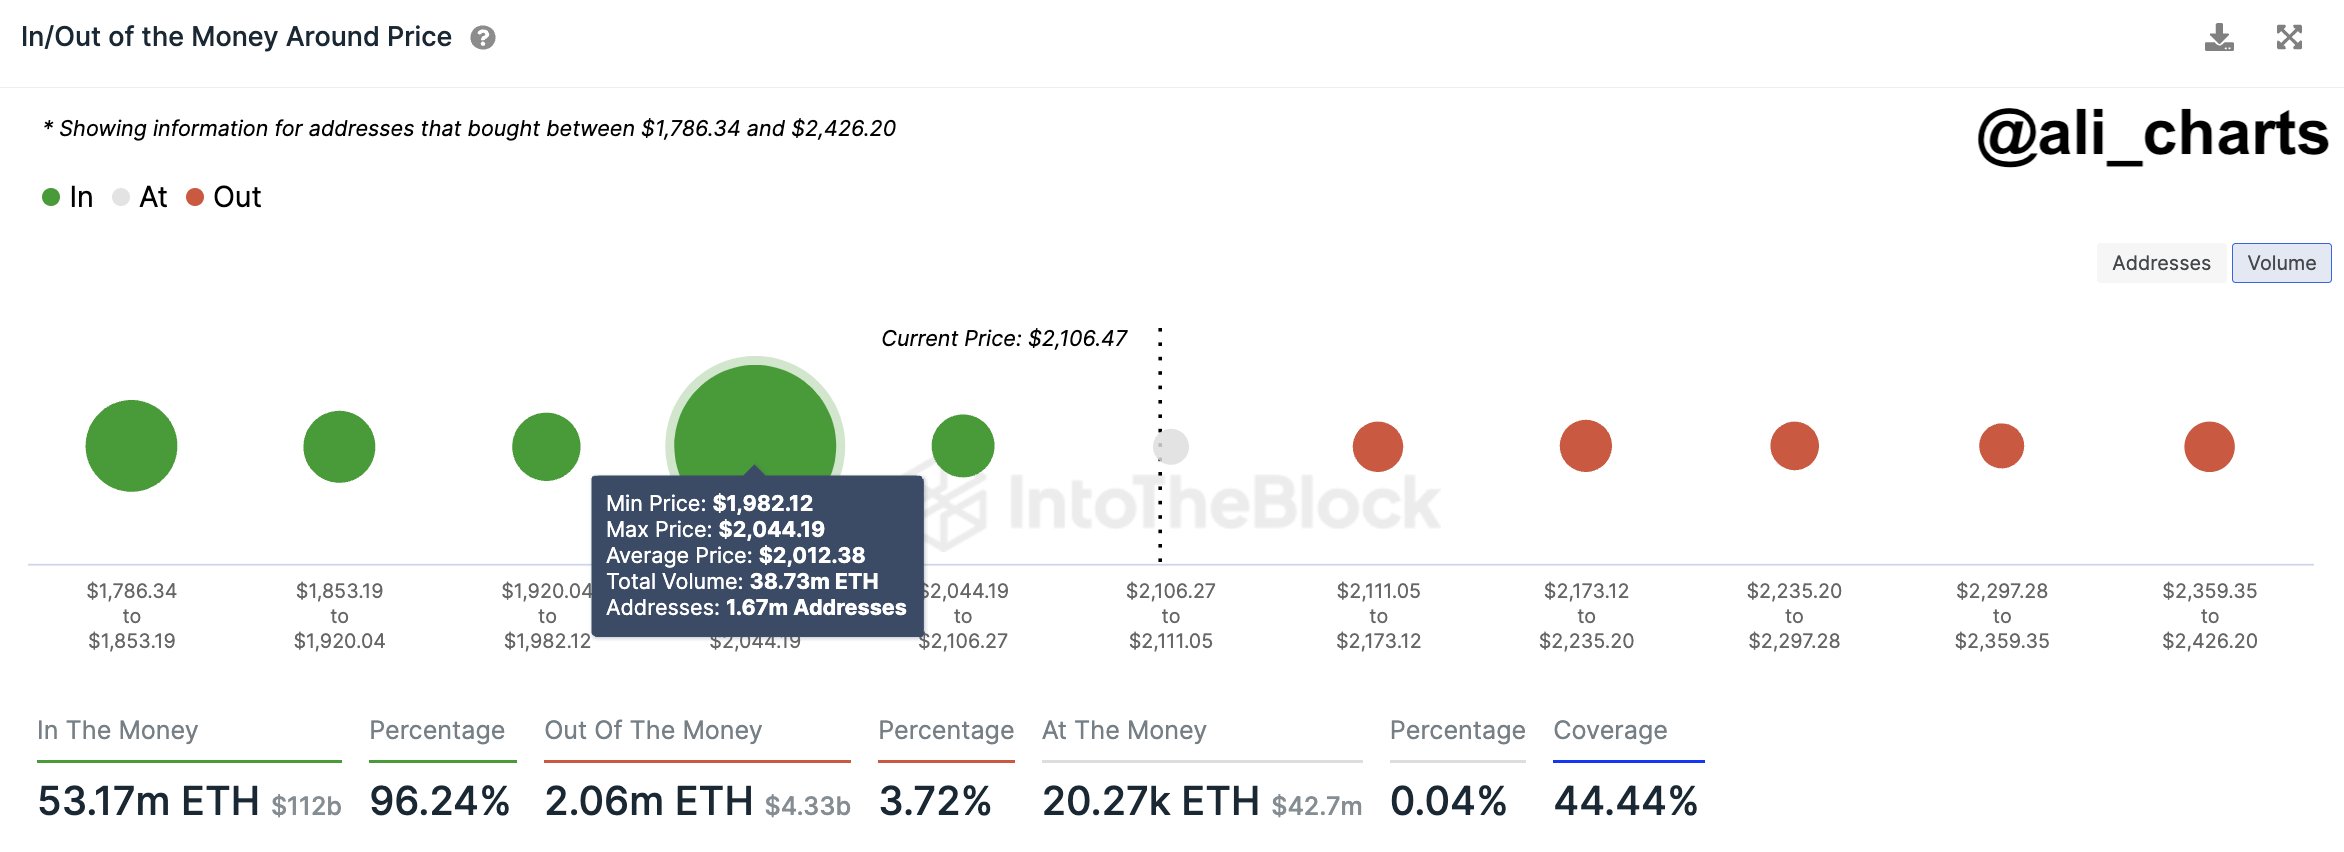
As displayed in the above graph, the Ethereum price range between $1,982 and $2,044 hosts the cost basis of about 1.67 million addresses, which acquired 38.73 million ETH at these levels.

Naturally, the more investors that share their cost basis inside a specific range, the stronger the reaction that the price would feel when it retests due to the aforementioned buying/selling effects.

Thus, this range that’s thick with investors would be a significant zone for the cryptocurrency. Since Ethereum has already surged past this area and has gained some distance over it with its latest break, the range is likely to play the role of support now.

Ethereum has this strong support area under its belt, while at the same time, there are no major resistance zones immediately above, as is apparent from the chart. This ideal setup means that, in theory, ETH shouldn’t have much trouble rallying towards the $2,426 level.

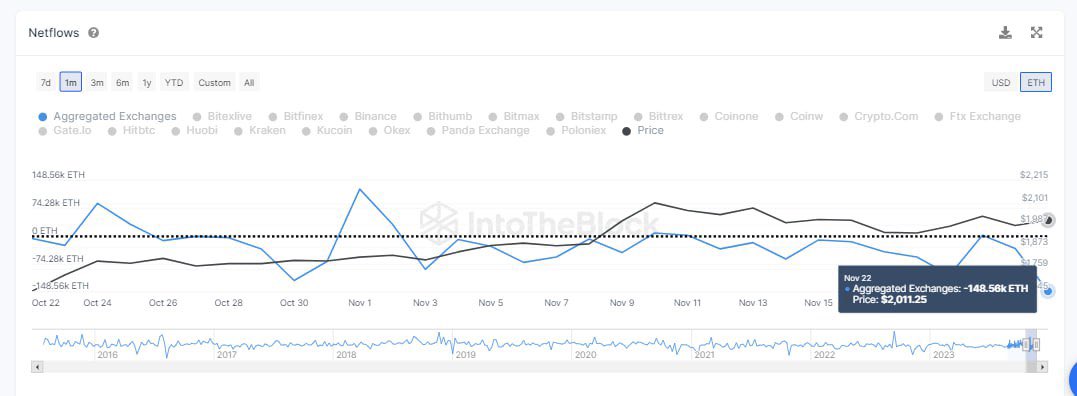
Another analyst has also pointed out how Ethereum has observed negative exchange netflows since the start of the month. The exchange netflow here is an indicator that keeps track of the net amount of ETH exiting or entering the wallets of all centralized exchanges.

Ethereum Netflows

The net outflows have amounted to over $1 billion during this period, a potential sign that significant buying has been occurring in the space. This certainly fuels the idea that ETH could explore new yearly highs shortly.

ETH Price

At the time of writing, Ethereum is trading at around $2,100, up 9% in the past week.

Ethereum Price Chart

Ethereum At $2,100: Why Path To $2,500 Is Now All Clear

On-chain data suggests the path to $2,500 could be open for Ethereum now that the asset has managed to cross the $2,100 mark.

Ethereum Has No Major Resistance Levels Until $2,500

In a new post on X, the market intelligence platform IntoTheBlock has provided an update on how the Ethereum levels are looking in terms of on-chain support and resistance. In on-chain analysis, ranges are defined as support or resistance based on how many investors acquired their coins inside them.

The below chart shows the density of addresses at various levels above and below the current spot price of the cryptocurrency:

Ethereum Support & Resistance

Generally, whenever the Ethereum price retests the cost basis of an investor, they may be more likely to show some kind of move. When this retest happens from above, the holder may be inclined to believe the price will go up again soon so they may see the retest as a “dip” and thus, might decide to buy more.

Related Reading: Polygon (MATIC) Jumps Another 6% As Whales Show High Activity

On the other hand, the investor may want to exit the market if the retest is from below, as they might fear the price would go down again in the future, and by selling at the break-even mark, they would at least avoid incurring any losses.

A few investors showing such behavior is obviously not enough to cause any visible effects on the market, but if a large number of investors share the same cost basis, the asset could very well feel a sizeable reaction.

From the chart, it’s visible that there are some large cost basis centers below the current Ethereum levels, suggesting the presence of strong potential support ranges.

Earlier, when the asset had still been below $2,000, the $2,000 to $2,100 range posed as the last major resistance boundary to break. Since the coin has now risen above these prices, it’s possible that the range would be switching its role towards being support instead.

Following this latest rally, about 75% of the holders are now in profit (that is, their cost basis is in the levels below). As is visible in the graph, there are no price ranges with a high density of investors in the upcoming price levels, until the $2,500 mark.

“Does this mean it’s a clean run to a new ATH? Not necessarily,” explains IntoTheBlock. “Historically, profit-taking at these levels is common and leads to pullbacks. However, this is unlikely to significantly impact Ethereum’s long-term trajectory.”

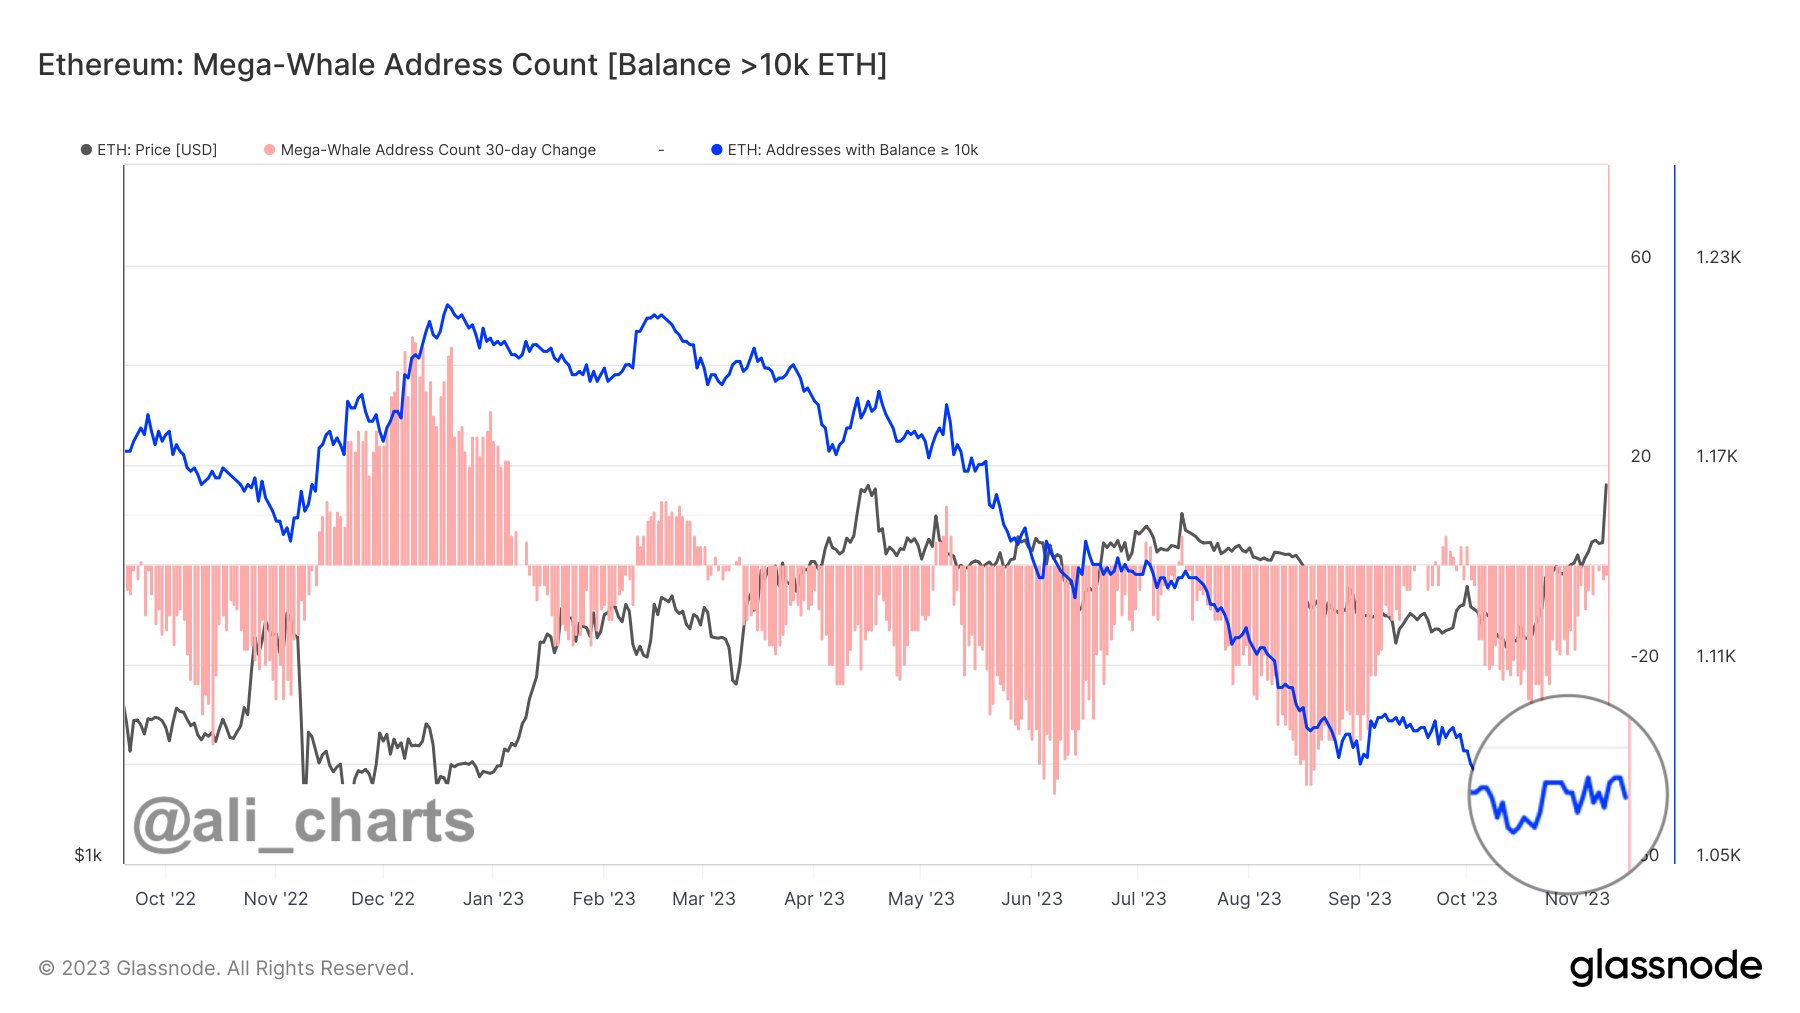
Analyst Ali Martinez has also pointed out something interesting in an X post today. He revealed that the latest rally in ETH has occurred without the support of the largest of the Ethereum whales (carrying a balance greater than 10,000 ETH), the so-called “mega whales.”

Ethereum Mega Whales

As highlighted in the graph, the total number of addresses owned by the Ethereum mega whales has been flat recently. “Ethereum has reclaimed the $2,000 threshold, and intriguingly, this is all happening before whales have even started buying ETH!” notes Ali.

ETH Price

After a surge of more than 9% in the past 24 hours, Ethereum has arrived at the $2,100 level for the first time since April.

Ethereum Price Chart