Bitcoin, Ethereum Lack Volumes To Justify Caps, Says Santiment

Data from Santiment reveals both Bitcoin and Ethereum currently lack the trading volumes to justify their market caps.

Bitcoin And Ethereum NVT Ratios Are Both Bearish Right Now

According to the on-chain analytics firm Santiment, both the bitcoin and ethereum networks will need to see a pickup in activity this year. The relevant indicator here is the “Network Value to Transaction” (NVT) ratio, which measures the ratio between the market cap of any crypto and its transaction activity.

Usually, the trading volume is considered as the transaction activity of a coin, but Santiment’s NVT ratio works differently. Instead of dividing the market cap by the volumes, this version of the metric makes use of the “daily circulation,” a measure of the total number of unique coins that have seen some movement in the past day.

The advantage of the circulation indicator is that transactions, where the same coins jump through several wallets, are only counted once towards the measurement, while the normal trading volume metric would have counted them as many times as they were transferred. This helps eliminate duplicate transactions and gives a more accurate idea about the market activity.

Now, what the NVT ratio tells us is how the market cap of Bitcoin or Ethereum currently compares against the activity on the respective networks. High values of the metric suggest the volumes are much lower than the cap right now, and hence the coin may be overvalued at the moment. On the other hand, low values suggest the price may be undervalued.

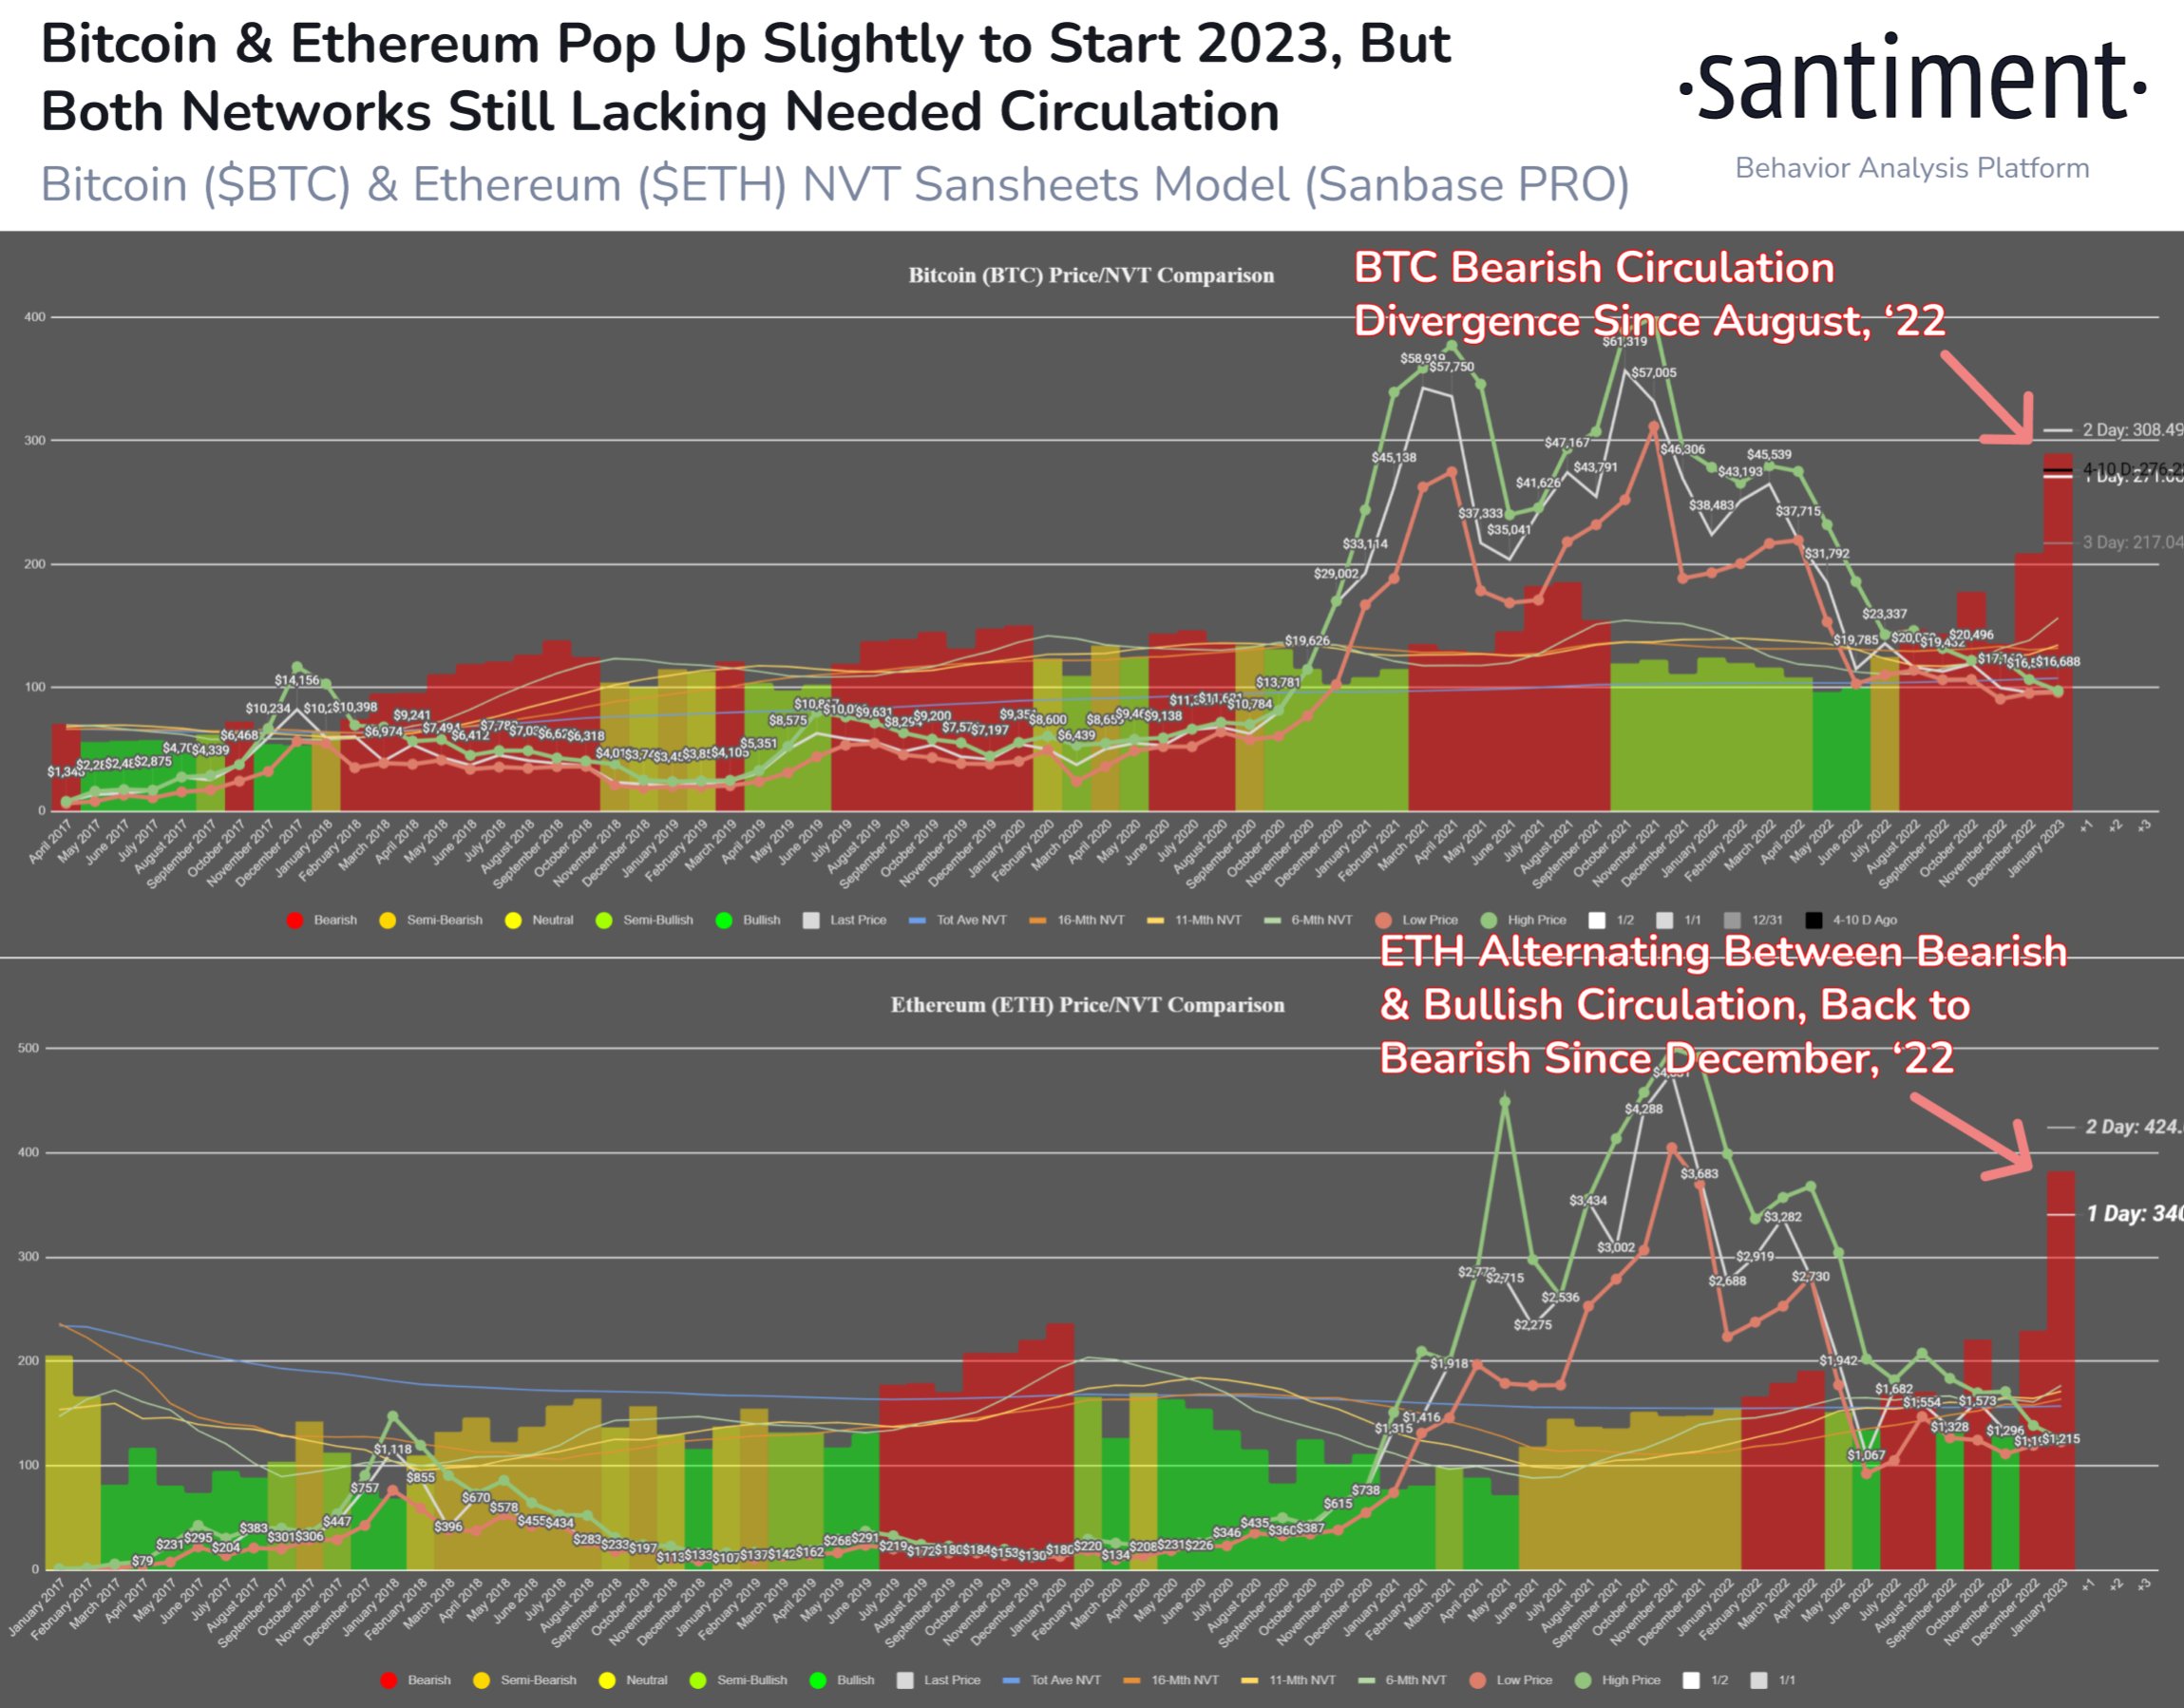
Now, here is a chart that shows where the NVT ratio has been valuing Bitcoin and Ethereum during the past few years:

Bitcoin And Ethereum NVT Ratio

As the above graph shows, the NVT ratio has been bearish for Bitcoin since August 2022. This means that in the last few months, the circulation on the BTC network has remained pretty low when compared to the market cap of the crypto.

For Ethereum, the indicator’s value had been switching between bearish and bullish throughout 2022, but the coin seems to have ended the year being overvalued as the circulation was bearish in December.

If the cryptos continue to be overvalued according to the NVT, then a correction may be imminent for them. “The circulation rate of both networks need to pick up in 2023, and this week will be telling as non-holiday days begin,” explains Santiment.

BTC Price

At the time of writing, Bitcoin’s price floats around $16,700, down 1% in the last week.

Bitcoin Price Chart

Ethereum Fees Touch Monthly Lows As Transaction Volumes Plummet

Ethereum fees had touched new highs thanks to the popularity of the decentralized finance (DeFi) space. As network activity had grown, so had the transaction volumes. The effects continue to linger even into the bear market, although fluctuations between low and high are now more common in the space. Presently, transaction volumes have fallen sharply and ETH fees have now plummeted to monthly lows.

Ethereum Transactions At $0.5

Ethereum transaction fees have declined to one of their lowest points this year. Gas costs which have been fluctuating between high and low seem to have found their resting place at lower prices. In the early hours of Monday, the gas costs for the Ethereum network had declined to their lowest point for June. It sat at only 19.8 Gwei per transaction at the time of this writing, which converted to about $0.5 per transaction on the network. 

Related Reading | Bitcoin May Not Reclaim All-Time High For Another Two Years, Binance CEO

This translates to a more than 80% drawdown from the peak of the gas costs last week at 151.3 Gwei per transaction. This coincides with a decline in transaction volume on the network, as shown on Messari.

The data aggregation website shows that Ethereum’s transaction volume is down more than 80% from its monthly high. On the 13 of June, transaction volumes on the network had sat at more than $10 billion in real volume. Today, the real volume was sitting at $570 million, the lowest it has been for the month.

ETH price declines to $1,179 | Source: ETHUSD on TradingView.com

Supply has also taken a hit in the month of June. By the end of last month, there was more than 8.6% of all total ETH supply in DeFi. However, as of the time of this writing, there is less than 8.3% of the circulating supply in DeFi. This also translates to a dollar value of under $10 billion when three weeks ago, the value was at $30 billion.

ETH Profitability Tanks

With the recovery in the price of Ethereum has come some good tidings for investors. But, there is still a gap in the profitability levels from last year compared to this year. Going into the last month of the year in 2021, more than 80% of ETH investors had been swimming in profit. Given that the digital asset had hit a new all-time high in November, this was expected.

However, there is a significant drawdown from this point. Data from IntoTheBlock shows that while the majority of ETH investors remain in profit, it is only by a small margin. 52% of wallets are currently in the green while 47% are in loss. This puts only 2% of all investors in the neutral territory, which remains shaky.

Related Reading | Bitcoin Perpetual Open Interest Suggests Short Squeeze Led To Crash

When it comes to the growth of the network, there is more negative sentiment among investors. The major reason for this is all of the competitors that are moving into the DeFi and NFT space. Solana especially has been giving Ethereum a run for its money in the NFT game, triggering an exodus towards the network which offers faster transactions and lower fees.

Nevertheless, Ethereum remains the second-largest cryptocurrency by market cap. Currently trading at $1,200 at the time of this writing, the cryptocurrency boasts a market cap of $149 billion.

Featured image from CryptoSlate, chart from TradingView.com

Follow Best Owie on Twitter for market insights, updates, and the occasional funny tweet…