Muneeb Ali, the co-creator of Stacks and Princeton-educated computer scientist who’s now CEO of the Bitcoin-focused development firm Trust Machines, spoke with CoinDesk’s Jenn Sanasie on the flurry of development and layer-2 building now taking place on the original blockchain.
Bullish Forecast: Analyst Predicts Surge To $88,000 As Bitcoin Hits Highest Level In Two Years
With Bitcoin recently surpassing the $57,000 mark, marking its highest level since 2021, a surge in bullish outlook among analysts and experts has emerged.
Bitcoin To $88,000
Among them is Ryan Rasmussen, a Senior Crypto Research Analyst at Bitwise, who recently shared his insights during an interview with Yahoo Finance. Rasmussen projected a bullish trajectory for Bitcoin, foreseeing a potential price surge to $88,000 by the close of 2024.
According to Rasmussen, Bitcoin trading at this price mark is possible, citing factors such as excitement and bullish sentiment surrounding the upcoming halving event and future traders taking bullish positions.
Rasmussen noted, disclosing Bitwise’s prediction for 2024:
We think that Bitcoin will certainly set all time highs in 2024. That previous price is right around $69,000 but we don’t think its going to stop there, we think we’ll at least see a 10% to 15% bump over the last all time highs in 2024. That will take us to the mid $80,000 range so I think our target was $88,00 by 2024, and I’m still sticking by that.
Despite Bitcoin trading below Rasmussen’s projected $88,000 mark, it maintains a bullish trend, with recent highs surpassing $57,000. Other analysts, including legendary trader Peter Brandt, share this optimism and predict a $200,000 target for the current bull market cycle.
Additionally, crypto analyst Ali has identified a “megaphone pattern” on Bitcoin’s daily chart, suggesting the potential for a substantial rally towards $60,520 if $50,000 to $53,000 price levels are maintained.
Ethereum’s Momentum Surges
Notably, aside from Bitcoin, Rasmussen also talked about Ethereum. So far, Ethereum’s price has outperformed that of Bitcoin.
Rasmussen attributed this surge in Ethereum’s value to speculation surrounding approving a spot Ethereum exchange-traded fund (ETF) in the US and the DenCun upgrade scheduled for March, which is expected to reduce transaction costs.
However, regardless of Ethereum’s optimism, Rasmussen cautioned that the approval of Ethereum spot ETFs might not be as straightforward as BTC spot ETFs.
He pointed out the reluctance of the US Securities and Exchange Commission’s Chair, Gensler, towards spot Bitcoin ETFs, suggesting a similar stance towards Ethereum.
Rasmussen also noted that the recent Grayscale lawsuit may not have the same positive impact on Ethereum spot ETF approval as it did for Bitcoin. Looking ahead, he estimated a 50% chance of approval or rejection for Ethereum spot ETFs in May.
The introduction of BTC spot ETFs has already significantly impacted the market, with billions flowing into spot Bitcoin ETFs. Should Ethereum spot ETF get approved, Rasmussen anticipates a similar demand for Ethereum spot ETFs, which could drive buying pressure and potentially increase prices.
Featured image from Unsplash, Chart from TradingView
Can Ethereum Touch $4,000? Crypto Analyst Says ETH Rally Far From Over
Like Bitcoin, Ethereum has also picked up steam, with the second-largest crypto token crossing the $3,000 resistance level for the first time since 2021. Interestingly, this crypto analyst believes the rally is far from over, as he highlighted a key price level that ETH could hit soon enough.
Ethereum Could Rise To As High As $4,000
Crypto analyst Altcoin Sherpa suggested in an X (formerly Twitter) post that Ethereum could rise to as high as $4,000. His prediction looks feasible when one considers crypto analyst Bitcoin Ape’s recent analysis of Ethereum from a technical analysis perspective.
In his X post, Bitcoin Ape noted that the ADX (average directional index) indicator is currently “very high,” signalling that ETH’s bullish trend is strong. Indeed, this bullish momentum might be very strong as the crypto token has since crossed the $3,130 price level, which Bitcoin Ape highlighted in his post as ETH’s new resistance level.
Interestingly, the analyst noted that Ethereum had already faced four resistance levels in February alone and has so far broken all of them, having also crossed the $3,130 mark. Although Bitcoin Ape failed to give his short-term prediction for ETH, he expects the crypto token to hit its all-time high (ATH) of $4,891 when the bull run returns in full force.
Meanwhile, Altcoin Sherpa isn’t the only one who believes that ETH could rise to $4,000 soon enough. Standard Chartered Bank had also predicted that the crypto token would hit this price level by the time the Spot Ethereum ETF is approved in May.
Crypto analyst Rager also recently gave a bullish prediction for ETH’s price, although he put his short-term target at $3,500. However, he added that this price level is only the beginning, stating that it isn’t the “peak high by any means.”
Ethereum’s Rally Not Hinged On Bitcoin’s Success
There is reason to believe Ethereum’s current bullish momentum isn’t due to Bitcoin’s price surge, as the Ethereum ecosystem also has narratives that may be driving ETH’s rally. For one, the Ethereum network’s ‘Dencun’ upgrade is set to take place on March 13. This much-anticipated event is significant as it would usher in advancements in the scalability, security, and usability of the Ethereum network.
Meanwhile, talks about a Spot Ethereum ETF likely being approved in May have created a lot of excitement for investors who have chosen to double down on their investments in the second-largest crypto token in anticipation of this happening.
The increased interest in ETH is expected to spark significant rallies in its price ahead of the May deadline, when the SEC will have to approve or deny VanEck’s Spot Ethereum ETF application.
Ethereum Outperforms Bitcoin As Institutional Investors Clamor For ETH Exposure
Reports have revealed that institutional investors are shifting their focus to Ethereum, displaying a preference compared to the largest cryptocurrency, Bitcoin. Despite Bitcoin’s recent rally to over $55,000, Ethereum’s unique features and potential developmental capabilities continue to capture institutional players’ interest.
Institutions Favor Ethereum Over Bitcoin
On February 24, cryptocurrency exchange, Bybit, published a research report on its users’ asset allocation. The research examined investors’ hodling and trading behaviours, covering the period from July 2023 to January 2024. Bybit’s report also provided valuable insights into investors’ asset allocation across cryptocurrencies such as altcoins, stablecoins and meme coins, shedding light on the specific coins users are currently bullish or bearish on.
According to the research report, Ethereum has unexpectedly emerged as the primary cryptocurrency choice for institutional investors. The report revealed that “institutions are betting big on Ethereum,” allocating more of their funds to ETH compared to BTC.
Bybit has disclosed that the recent rise in interest in Ethereum began in September 2023, when ETH was still trading around $2,000. Subsequently, Ethereum’s market sentiment became more bullish, experiencing a surge in investor interest to about 40% by January 2024. The crypto exchange has confirmed that, as of January 31, ETH has become the single largest cryptocurrency held by institutions.
Bybit’s report also revealed that institutional investors’ interest in Bitcoin began to wane following the United States Securities and Exchange Commission (SEC) approval of Spot Bitcoin ETFs on January 10, 2024. At the time, Bitcoin had experienced massive selling pressures, resulting in investors trimming their BTC holdings to favour other cryptocurrencies.
The excessive allocation of Ethereum is reportedly attributed to investors anticipating a favourable outcome from Ethereum’s upcoming Decun Upgrade, slated to launch in March 2024.
Notably, Bybit has disclosed that it is still being determined if the recent shift to Ethereum is a short-term manoeuvre or a more prolonged move. However, the approaching Bitcoin halving in April potentially adds a layer of bearish risks, as projections indicate Bitcoin’s significant rise in value to new all-time highs during the halving phase.
Retail Investors Think Otherwise
Bybit’s research report also examines the asset allocation trend for retail investors on the cryptocurrency exchange. The report revealed that retail investors are significantly more bullish on Bitcoin than Ethereum, allocating more funds into BTC than ETH despite Ethereum’s recent surge in value.
Over the past week, Ethereum has experienced a substantial hike in its price, jumping over 7% and outpacing Bitcoin, suggesting a potential for a more extensive upward trajectory. At the time of writing, Ethereum is trading at $3,227, reflecting a 4.05% increase in the last 24 hours, according to CoinMarketCap.
While Ethereum’s massive rally has successfully elevated the sentiment among institutional investors, retail investors remain less swayed, opting to hold onto or incorporate additional Bitcoin into their diversified portfolio of digital assets.
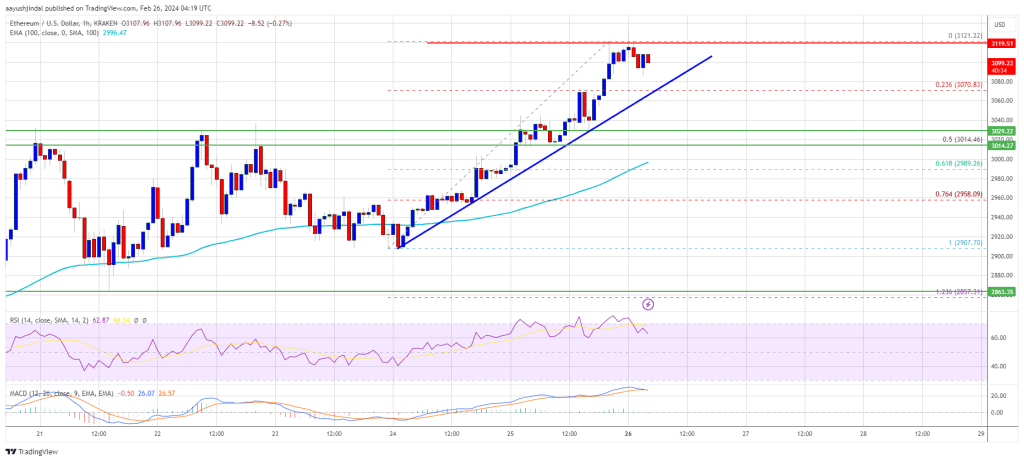
Ethereum Price Rally Stalls As Bitcoin Pumps But Bulls Are Not Done Yet
Ethereum price climbed to a new multi-month high above $3,200. ETH is consolidating while Bitcoin is gaining pace above the $55,000 resistance.
- Ethereum extended its increase above the $3,200 resistance zone.
- The price is trading above $3,175 and the 100-hourly Simple Moving Average.
- There is a key bullish trend line forming with support at $3,150 on the hourly chart of ETH/USD (data feed via Kraken).
- The pair could extend its increase toward $3,320 or even $3,450 in the near term.
Ethereum Price Underperforms Bitcoin
Ethereum price remained in a positive zone and extended its increase above the $3,050 resistance. ETH climbed above the $3,200 resistance, but upsides were contained after Bitcoin surged above $55,000.
Ether even spiked above $3,250. A new multi-week high is formed near $3,274 and the price is now consolidating gains. It is trading above the 23.6% Fib retracement level of the upward move from the $3,041 swing low to the $3,274 high.
There is also a key bullish trend line forming with support at $3,150 on the hourly chart of ETH/USD. The trend line is close to the 61.8% Fib retracement level of the upward move from the $3,041 swing low to the $3,274 high.
Ethereum is now trading above $3,175 and the 100-hourly Simple Moving Average. Immediate resistance on the upside is near the $3,250 level. The first major resistance is near the $3,275 level. The next major resistance is near $3,320, above which the price might gain bullish momentum.
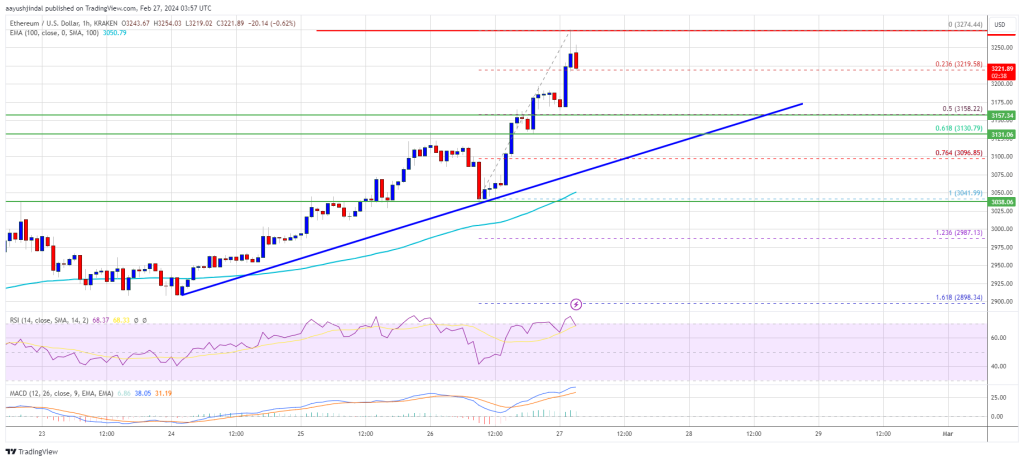
Source: ETHUSD on TradingView.com
If there is a move above the $3,400 resistance, Ether could even rally toward the $3,450 resistance. Any more gains might call for a test of $3,500.
Are Dips Limited In ETH?
If Ethereum fails to clear the $3,250 resistance, it could start a downside correction. Initial support on the downside is near the $3,200 level.
The first major support is near the $3,150 zone and the trend line, below which Ether might test $3,130. The next key support could be the $3,100 zone. A clear move below the $3,100 support might send the price toward $3,050 or the 100-hourly Simple Moving Average. Any more losses might send the price toward the $2,880 level.
Technical Indicators
Hourly MACD – The MACD for ETH/USD is gaining momentum in the bullish zone.
Hourly RSI – The RSI for ETH/USD is now above the 50 level.
Major Support Level – $3,150
Major Resistance Level – $3,250
Ethereum Exodus: Whales Withdraw $64 Million ETH From Exchanges, Bullish Signal?
According to data from Lookonchain, an on-chain analytics platform, Ethereum (ETH), whales have withdrawn roughly $64.2 million worth of ETH from major exchanges.
This significant movement of funds coincides with a notable uptick in the price of ETH, indicating an increasing interest in the asset.
Ethereum Whales Movement Signals Confidence
According to Lookonchain’s findings, much of the ETH supply has been shifted from exchange wallets to custodial wallets. The on-chain analytics platform reported that an Ethereum address labeled 0x8B94 had withdrawn an amount of 14,632 ETH, valued at approximately $45.5 million, from Binance.
Lookonchain states these funds have been actively staked within six days, indicating a deliberate move towards adopting long-term investment strategies.
The analysis from the platform also points out that another two fresh whale wallets have transferred 6,000 ETH, amounting to $18.7 million, from Kraken to undisclosed wallet addresses over the last two days.
Whales are accumulating $ETH!
0x8B94 withdrew 14,632 $ETH($45.5M) from #Binance and staked it in the past 6 days.https://t.co/bywnrZ2glt
2 fresh whale wallets withdrew 6K $ETH($18.7M) from #Kraken in the past 2 days.https://t.co/0kEvOmiv3hhttps://t.co/90fqjJXsSu pic.twitter.com/J0ewl8S3OX
— Lookonchain (@lookonchain) February 26, 2024
This trend suggests an increase in major investors to secure substantial amounts of Ethereum away from exchange platforms, potentially as a means of positioning for long-term asset appreciation.
Further echoing this is a recent analysis from CryptoQuant’s Quicktake, which underscores a notable trend regarding Ethereum withdrawals from exchanges over the past few weeks. This observation relies on the “Exchange Reserve” metric, which monitors the quantity of ETH tokens held in the wallets of all centralized exchanges.
When the value of this metric increases, it signifies that investors are depositing more assets than withdrawing them from centralized exchanges, indicating a buildup of Ethereum reserves. Conversely, a decline in the metric suggests a net outflow of assets from these platforms.
According to data from CryptoQuant, over 800,000 ETH, equivalent to roughly $2.4 billion, has exited cryptocurrency exchanges since the beginning of the year. Such substantial outflows from these platforms typically indicate a surge in investor confidence in the Ethereum network and its native token.
Ethereum’s Price Momentum And Potential For A Significant Breakout
Meanwhile, Ethereum’s price has displayed bullish momentum, witnessing a 5.5% increase in the past week and reclaiming the crucial $3,000 mark.
Financial guru Raoul Pal has drawn attention to Ethereum’s potential for a major breakout, pointing to a “dual-chart pattern” observed on the ETH/BTC chart.
The ETH/BTC chart is an absolute stunner…and ready for the next big move the break of the mega wedge…lets see how is pans out… pic.twitter.com/5x4tJLjtJy
— Raoul Pal (@RaoulGMI) February 25, 2024
Pal highlights a “mega wedge” pattern alongside an inner descending channel, indicating a consolidation phase with bullish potential.
Featured image from Unsplash, Chart from TradingView
Ethereum Leaves Bitcoin Behind, But Is This Rally Sustainable?
Ethereum has left Bitcoin in the dust with its latest rally towards $3,100. Here’s whether this run is sustainable based on futures market data.
Ethereum Has Separated From Bitcoin With Over 7% Jump In Past Week
While Bitcoin has been in consolidation lately, Ethereum appears to have been putting together bullish momentum entirely of its own, as the asset has jumped more than 7% in the past week.
The chart below shows how ETH has performed during the last month.
In the last 24 hours, Ethereum reached a peak of $3,130 level, a mark it only reached for the first time since the first half of April 2022. Since then, the coin has come down a bit, as it now floats around $3,100.
Nonetheless, despite this small retrace, ETH has still performed notably better than the original cryptocurrency. Now, the asset’s investors might be wondering if the coin could continue this run. Perhaps data related to the futures market might shed some light.
ETH Funding Rates Have Been At Positive Levels Recently
As pointed out by an analyst in a CryptoQuant Quicktake post, the ETH funding rate has had positive values recently. The “funding rate” is an indicator that keeps track of the periodic fees that traders on the futures market are exchanging between each other right now.
When the value of this metric is positive, it means that the long holders are currently paying a premium to the short investors to hold onto their holdings. Such a trend implies the majority sentiment in the futures market is bullish.
On the other hand, the indicator being negative implies a bearish sentiment is dominant in the sector right now as the short holders outweigh the long traders.
Now, here is a chart that shows the trend in the 30-day simple moving average (SMA) of the Ethereum funding rate over the past couple of years:

As the above graph shows, the 30-day SMA Ethereum funding rate had shot up to extremely high levels in the first half of January. Interestingly, this is when the market top due to the Bitcoin spot ETFs occurred.
After the price drawdown following the event, the funding rate calmed as the longs that had piled up saw liquidation. As the recent rally in the coin has occurred, the funding rate has once again gone up.
However, This time, the 30-day SMA Ethereum funding rate isn’t quite at the extreme levels it was last month. This could mean that the futures market isn’t yet too overheated.
Naturally, this could potentially allow for the current Ethereum rally to go on for a while still. It should be noted, though, that as the funding rates go higher, the chances of a long squeeze taking place go up.
Thus, while ETH may not be quite at the same risk as last month, a long squeeze could still be on the horizon, becoming more probable to happen as the speculators continue to open up more positions.
Crypto Analyst Sounds Warning Alarm: Last Chance To Buy Bitcoin And Ethereum Before Bull Run
Crypto analyst Rager recently provided valuable insights to Bitcoin and Ethereum investors ahead of the imminent bull run. As part of his statements, he revealed the best time to go all in on the two largest crypto tokens by market cap, Bitcoin and Ethereum.
“Last Great Opportunity For This Cycle”
Rager opined in an X (formerly Twitter) post that the “last great opportunity for this cycle” will come around the Bitcoin Halving. In line with this, he also stated that he was still holding spot in positions and waiting for the “BTC and ETH pullback”, which he explicitly predicts will happen between now and May.
Going by Rager’s opinion, this “nice dip” presents the perfect time for crypto investors to position themselves ahead of this cycle’s bull run. His statement also suggests that Bitcoin and Ethereum (and possibly other crypto tokens) will run massively after that pullback occurs. Interestingly, analysts have continued to identify this event as what will kickstart the next bull run.
Bitcoin Run To $60,000 Might Be Close
In a subsequent X post, Rager gave an idea of what price level Bitcoin could drop to when the crash occurred as he hinted that he wouldn’t invest until Bitcoin dropped to $48,000. He also provided an analysis of Bitcoin’s current price action, noting that it has been “composed of a few days of strong price action followed by a lot of chop and pullbacks.”
He added that Bitcoin and the broader crypto market “has a lot of upside opportunity.” However, he warned that there could likely be a short-term pullback, which he predicts could be the last great opportunity to invest. Rager also claimed that Bitcoin would break the $60,000 resistance for the first time since 2021 once this pullback is done.
ETH To $3,500 Is The Next Target
In another X post, Rager mentioned that the $3,500 price level is the target for the current bullish momentum in the market. He also believes this will likely happen “sooner rather than later” with the help of the Ethereum Spot ETF rumours. Industry experts have expressed confidence that these funds will be approved.
$3,500 is just Rager’s first target for Ethereum in this cycle’s bull run, noting that it isn’t the “peak high by any means.” Meanwhile, the analyst stated that the peak of this bull run is still far off. Using the crypto fundraising data as an indicator to determine when the market top is almost in, he noted that fundraising was still at lower levels compared to peak bull market activity.
OG Ethereum ERC-404 Token PANDORA Is Rallying Again, What’s Behind It?
PANDORA, the first token to use the Ethereum ERC-404 token standard, is on the move after slowing down for a few weeks. The token’s price saw a significant surge over the weekend, rising around 50% to clear $24,000 once more. This recovery was triggered by a number of factors, so here they are.
Whales Set Their Sights On PANDORA
The most obvious reason behind the price push recorded for PANDORA over the weekend can be traced back to significant whale activity. On-chain data tracking website Lookonchain, flagged a number of whale transactions that took place in the days leading up to the price surge.
The first whale accumulation was seen on February 20, when Lookonchain reported that a single whale had spent $4.89 million to purchase 244.24 PANDORA tokens. The buying spree took place over a number of days, and by the time the whale was done, they had an average entry price of $20,044.
A giant whale spent 4.89M $USDC to buy 244.24 #PANDORA at an average price of $20,044 on Feb 13, Feb 14 and today.https://t.co/DR58pEXN5j pic.twitter.com/c7Q3sM6ksO
— Lookonchain (@lookonchain) February 20, 2024
A couple of days later on February 23, the on-chain tracking platform reported that another whale was making their PANDORA play. This time around, the new whale spent $1.37 million buying 71.45 PANDORA tokens at an average price of $19,268.
Another whale is buying #PANDORA, having spent 1.37M $USDC to buy 71.45 #PANDORA at an average price of $19,268 so far.https://t.co/o1z3c6EfLrhttps://t.co/NMzLjtdMqm pic.twitter.com/j0mGVsMik5
— Lookonchain (@lookonchain) February 23, 2024
Together, these whales scooped up a little over $6 million worth of tokens. When the price eventually hit $24,000, the first whale saw profit margins of almost $1 million, while the second whale was sitting on a profit of over $330,000.
First Set Of Incentives Land For Holders
Another factor that has helped push the price of PANDORA over the week is incentives in the form of airdrops being announced for PANDORA holders. Monarch, a project also built on the Ethereum ERC-404 token standard, announced earlier in February that it would be awarding tokens to PANDORA investors.
A total of 5% of the token supply was announced to be allocated as an airdrop for PANDORA holders. This incentive, coupled with the fact that PANDORA announced that it is gearing up to release the latest iteration of the ERC-404 token standard, created demand for the token.
PANDORA Token Performance
During the weekend, the PANDORA price went from trending around $16,000 to rising 50% in one day to clear the $24,000 level. However, this high price level could not be sustained for long as a sharp dump would follow on February 23, apparently triggered by whales dumping their holdings.
In the last day, the price of the token has continued to fluctuate between $16,000 and $17,000. As of the time of writing, the altcoin is trading at $17,139, with 5% losses in the last day, according to data from Dexscreener.
Who’s Behind The Latest $41 Million Ethereum Buying Spree? Justin Sun Again?
The cryptocurrency community is abuzz with speculation after a series of large Ethereum (ETH) purchases attributed to a wallet potentially linked to Justin Sun, founder of the TRON blockchain and CEO of BitTorrent.
Justin Sun On An Alleged Massive Buying Spree
According to a tweet by blockchain analytics firm Lookonchain, the suspected wallet recently acquired another 13,780 ETH, valued at approximately $41.24 million. This latest purchase adds to a total of 168,369 ETH, worth roughly $487 million, accumulated in just two weeks from both centralized exchanges like Binance and decentralized exchanges (DEXs).
The buying spree began accelerating this week, with significant purchases almost daily. The largest single transaction, recorded on February 19th, saw the suspected Sun wallet acquire a staggering 54,721 ETH, amounting to $154.4 million.
The suspected #JustinSun wallet bought 13,780 $ETH($41.24M) from #Binance again 12 hours ago.
He bought 168,369 $ETH($487M) at $2,894 from #Binance and #DEX in less than 13 days!
https://t.co/HOLrbULDJB pic.twitter.com/zhJMQJGgq9
— Lookonchain (@lookonchain) February 25, 2024
Motives And Market Impact Remain Unclear
While Justin Sun has not confirmed ownership of the wallet, the size and frequency of the transactions point towards a high-profile investor. However, Sun’s intentions and the potential impact on the market remain open to interpretation.
The suspected #JustinSun wallet bought 13,780 $ETH($41.24M) from #Binance again 12 hours ago.
He bought 168,369 $ETH($487M) at $2,894 from #Binance and #DEX in less than 13 days!
— Lookonchain (@lookonchain) February 25, 2024
Analysts Offer Speculative Explanations For Sun’s Actions
Some analysts suggest these large-scale purchases could be a bullish signal for Ethereum, indicating a strong belief in the platform’s long-term potential. This interpretation aligns with Ethereum’s recent price surge – reaching a high of $3,000 before dipping slightly on the day the news broke.
Others speculate that Sun’s actions may be part of a broader strategy, potentially linked to the ongoing discussions surrounding an Ethereum ETF (exchange-traded fund). The possibility of an ETF approval has already been seen to positively influence the price of Bitcoin, and similar effects could be anticipated for Ethereum.
Maintaining A Critical Perspective Essential in Volatile Market
It is crucial to remember that the cryptocurrency market is inherently volatile. While Sun’s buying spree has undoubtedly generated significant interest, it is important to maintain a critical perspective and consider the limitations of the available information.
Reports emphasize that the wallet is only suspected to belong to Sun. The connection between these alleged purchases and Ethereum’s recent price movements remains unconfirmed. Additionally, motivations behind such large-scale acquisitions are often unclear, leaving room for various interpretations and speculations.
Featured image from Pixabay, chart from TradingView
Ethereum Price Tops $3,100: Mega Wedge Breakout Imminent
After a prolonged period of weakness for a year and a half against the Bitcoin price, the Ethereum price is currently showing strength again and could be set for an explosive move, according to several renowned analysts.
Ethereum/BTC Chart Is A ‘Stunner’
In an analysis of the ETH/BTC trading pair, renowned financial expert Raoul Pal has brought to light a compelling dual-chart pattern. The formation of both a “mega wedge” and an inner descending channel is setting the stage for what might be a significant breakout for Ethereum when priced in Bitcoin. Pal stated:
The ETH/BTC chart is an absolute stunner…and ready for the next big move, the break of the mega wedge…let’s see how it pans out….
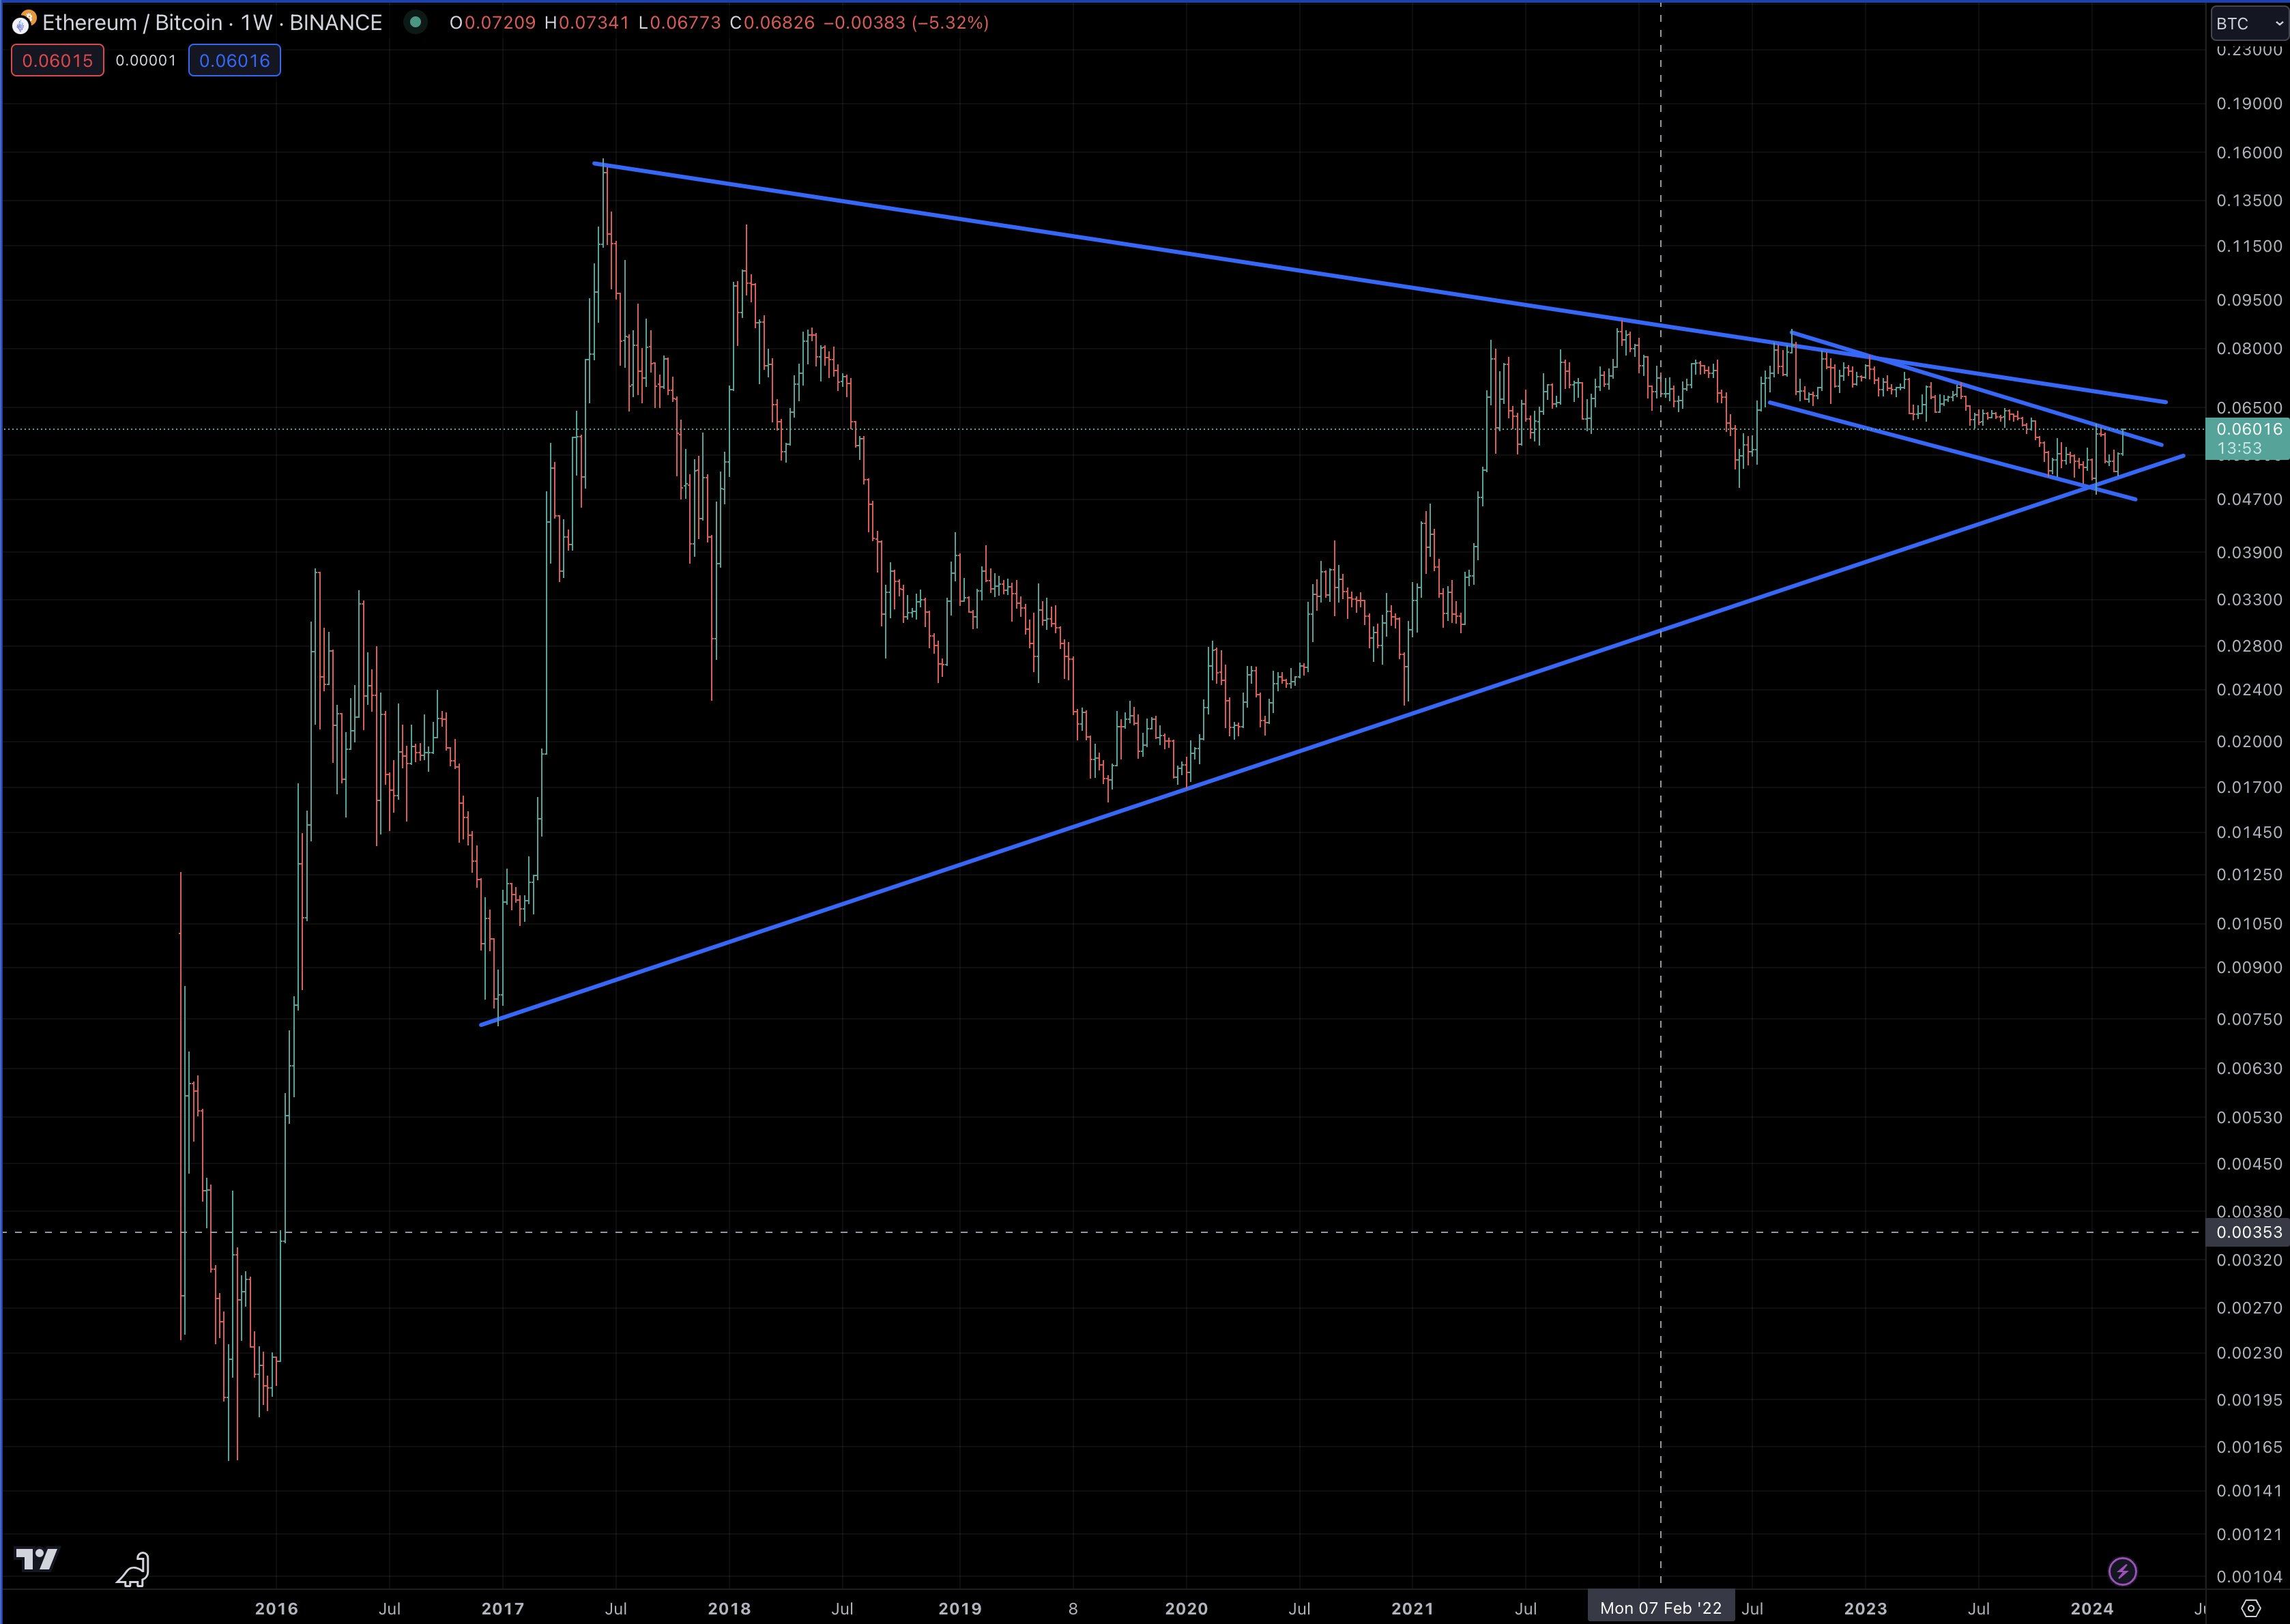
The “mega wedge” pattern, discernible on the weekly ETH/BTC chart, showcases a contraction of price movement between two converging trend lines over an extended time frame. The upper trend line, acting as a dynamic resistance, has repeatedly pushed back ascending price attempts. Conversely, the lower trend line has provided a sturdy support base.
Within the boundaries of this one and a half year wedge, a more immediate descending channel has taken shape. This channel, characterized by a downward trajectory with price action making lower highs and lower lows, indicates a bearish sentiment within the overarching consolidation phase of the mega wedge.
However, Ethereum’s current positioning, slightly above the upper boundary of this descending channel, implies that a breakout could be on the cards (if confirmed). As of press time, Ethereum was trading at an equivalent value of over $3,059, which translates to roughly 0.06037 BTC.
The intersection of these two patterns, particularly if the breakout from the descending channel is confirmed, could be a harbinger of increased volatility and a potential trend reversal for ETH against BTC. A potential retest of the channel could catalyze a rally towards the mega wedge’s upper trend line, challenging the longer-term resistance. A successful breakout from the mega wedge could then ensue, signaling a massive bullish phase for Ethereum against Bitcoin.
More Bullish Voices On ETH
Remarkably, Raoul Pal is not the only seasoned analyst observing this major trend. Christopher Inks, founder of Texas West Capital stated via X:
The monthly ETH/ BTC chart looks crazy bullish off the lows. Bullish SFP, volume expansion at the lows, rally into descending resistance. An impulsive break out above that descending resistance will have me looking for price to target the top of the range and, likely, new ATHs.
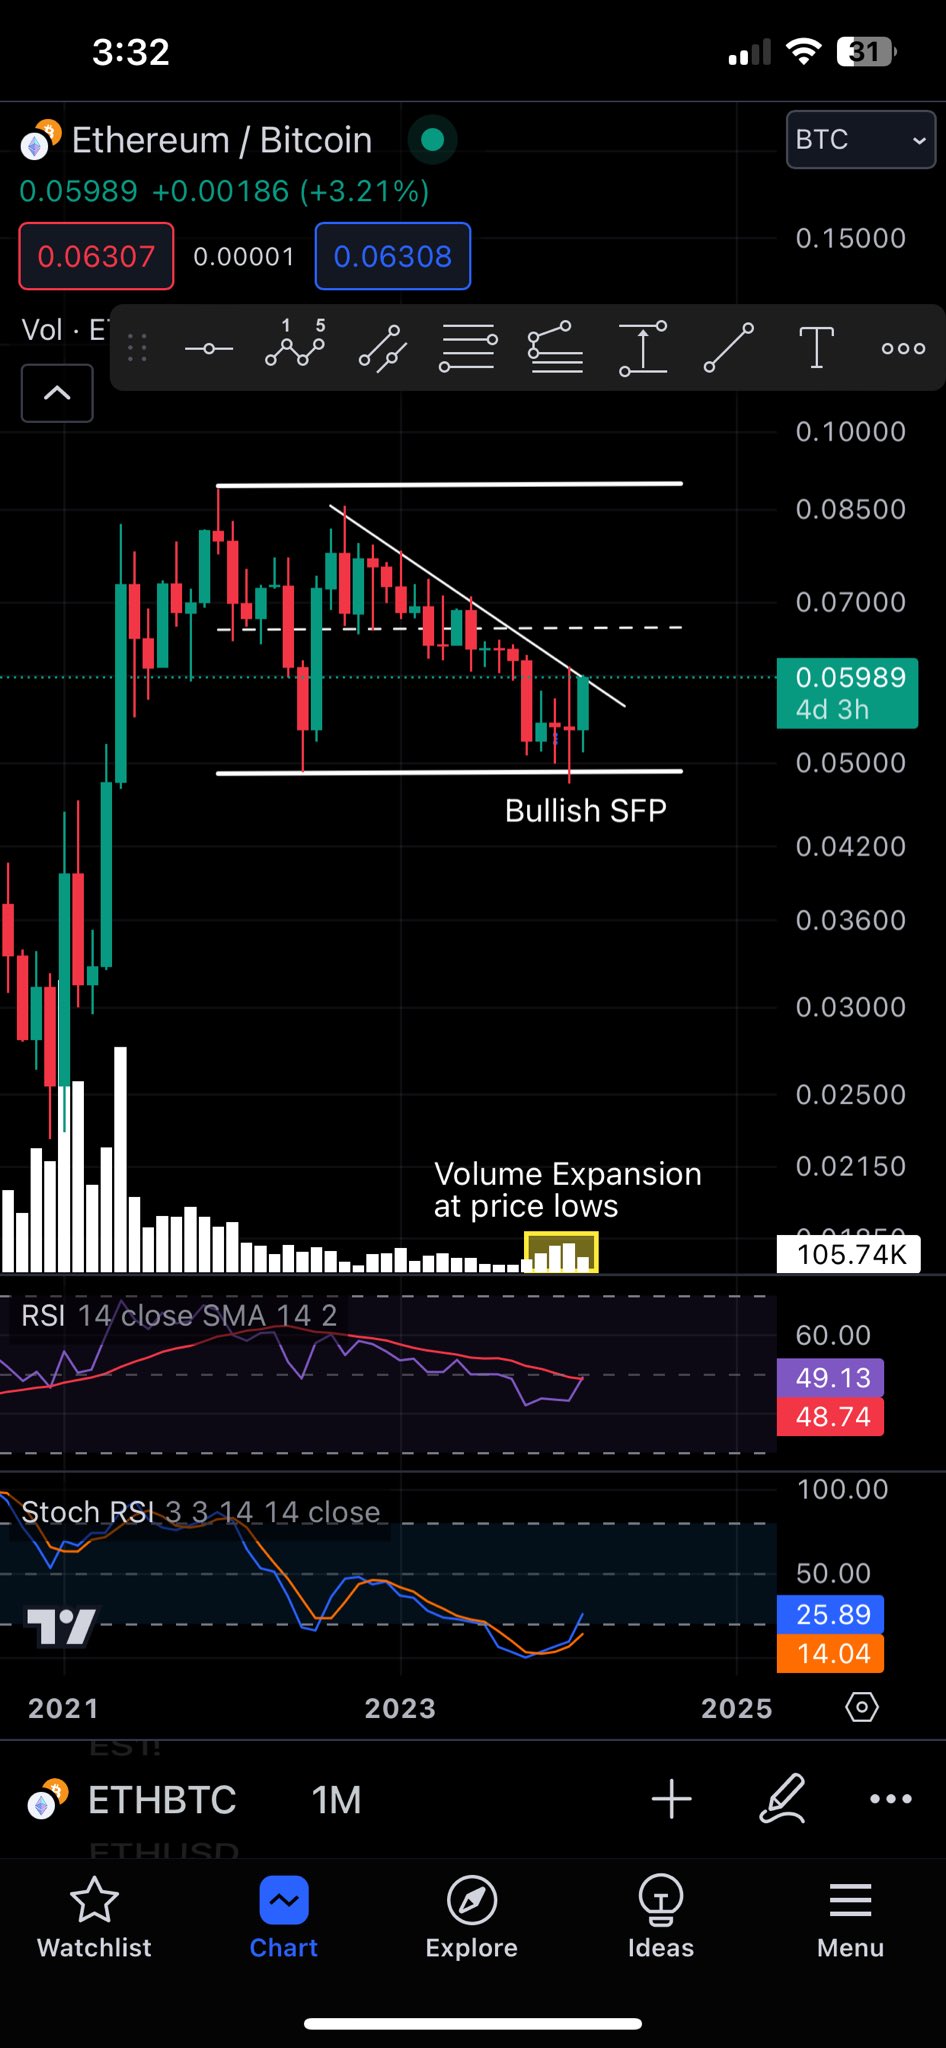
Renowned analyst Will Clemente has also weighed in on the unfolding situation with his expert commentary, echoing the significance of the patterns observed by Raoul Pal. Clemente accentuates the breaking of a multi-year downtrend on the weekly chart, a technical milestone that carries substantial weight for market sentiment.
Clemente’s analysis further deepens the plot by highlighting several key factors currently at play in the Ethereum ecosystem. First, Ethereum’s price action has revisited and swept the lows of May 2022, a move often associated with shaking out weak hands before a potential trend reversal.
Second, the recent talk of “Ethereum obituaries” on social media timelines suggests a sentiment extreme, often seen at major turning points. Moreover, there is currently a new narrative for ETH shaping, the emergence of “restaking”.
Probably the strongest catalyst for the ETH price in the coming months could be the potential approval of an spot Ethereum ETF in the United States. Similar to the Bitcoin ETF euphoria, Clemente speculates that the approval has not yet been priced in.
Lastly, Uniswap’s governance proposal to switch on fees could redirect significant value to token holders, potentially adding further bullish momentum to ETH’s valuation. Clemente caps his commentary with a forecast that resonates with the sentiments of many observers: “ETH & ETH shitcoin rotation is probably upon us.”
At press time, ETH traded at $3,059.
Blast Ecosystem Sees First Apparent Scam as ‘RiskOnBlast’ Rug Pulls $1.3M Ether
Blast, in an X post, termed the project’s potential as “undeniable,” which may have created a sense of security among investors.
Ethereum Price Climbs Toward $3,200 And Bulls Are Just Getting Started
Ethereum price is outperforming Bitcoin with a move above $3,000. ETH is showing bullish signs and might soon climb above the $3,200 resistance.
- Ethereum started a fresh increase above the $3,000 resistance zone.
- The price is trading above $3,050 and the 100-hourly Simple Moving Average.
- There is a key bullish trend line forming with support at $3,080 on the hourly chart of ETH/USD (data feed via Kraken).
- The pair could extend its increase toward $3,200 or even $3,250 in the near term.
Ethereum Price Outperforms Bitcoin
Ethereum price remained stable above the $2,880 support zone. ETH formed a base and started a fresh increase above the $3,000 resistance. It gained nearly 5% and outperformed Bitcoin.
A new multi-week high is formed near $3,121 and the price is now consolidating gains. It is trading above the 23.6% Fib retracement level of the upward wave from the $2,907 swing low to the $3,121 high. There is also a key bullish trend line forming with support at $3,080 on the hourly chart of ETH/USD.
Ethereum is now trading above $3,085 and the 100-hourly Simple Moving Average. Immediate resistance on the upside is near the $3,120 level. The first major resistance is near the $3,150 level.
Source: ETHUSD on TradingView.com
The next major resistance is near $3,200, above which the price might gain bullish momentum. If there is a move above the $3,200 resistance, Ether could even rally toward the $3,280 resistance. Any more gains might call for a test of $3,320.
Are Dips Supported In ETH?
If Ethereum fails to clear the $3,120 resistance, it could start a downside correction. Initial support on the downside is near the $3,080 level and the trend line.
The first major support is near the $3,000 zone. It is close to the 50% Fib retracement level of the upward wave from the $2,907 swing low to the $3,121 high, below which Ether might test the 100-hourly Simple Moving Average. The next key support could be the $2,960 zone. A clear move below the $2,960 support might send the price toward $2,920. Any more losses might send the price toward the $2,860 level.
Technical Indicators
Hourly MACD – The MACD for ETH/USD is losing momentum in the bullish zone.
Hourly RSI – The RSI for ETH/USD is now above the 50 level.
Major Support Level – $3,000
Major Resistance Level – $3,120
800,000 ETH Flow Out Of Centralized Exchanges In 2024 – Bullish Sign For Ethereum Price?
The price of Ethereum has been a joy to watch since the start of 2024, climbing by more than 30% in less than two months. The latest on-chain revelation suggests that ETH investors are approaching the market with more confidence, as the cryptocurrency’s price rally seems to be far from over.
$2.4 Billion Worth Of ETH Leaves Exchanges: CryptoQuant
A pseudonymous analyst on CryptoQuant’s Quicktake revealed that significant amounts of the Ethereum token have been making their way out of exchanges in the last few weeks. This observation is based on the “Exchange Reserve” metric, which tracks the amount of ETH tokens in the wallets of all centralized exchanges.
When the value of this metric increases, it implies that investors are making more deposits than withdrawals of an asset (Ether, in this case) into centralized exchanges. Meanwhile, the metric’s decline means that more assets are flowing out than entering these platforms.
According to data from CryptoQuant, more than 800,000 ETH (equivalent to approximately $2.4 billion) has flowed out of cryptocurrency exchanges since the turn of the year. Typically, the movement of significant amounts of cryptocurrencies out of these platforms suggests a rise in investor confidence.
As the CryptoQuant Quicktake author noted, this reduction in Ether’s exchange reserve balance could be a bullish catalyst for the altcoin’s price. A sustained decline in the ETH’s supply on exchanges could trigger a supply crunch, potentially driving the Ethereum price higher.
As of this writing, the Ethereum price stands at around $2,920, reflecting a 1.8% decline in the past day. Nevertheless, the “king of altcoins” is still in the green on the weekly timeframe, with an almost 5% price jump over the last week.
Ethereum Price Rise Due To Anticipation Of Dencun Upgrade: Grayscale
In a recent report, Grayscale has offered commentary on Ethereum’s positive price performance so far in 2024. The asset management firm tied ETH’s bullish trajectory to the upcoming Dencun upgrade of the Ethereum network.
William Ogden Moore, Grayscale’s research analyst, wrote in the report:
We believe that recent price performance reflects the market’s anticipation of this upgrade, as Ethereum (up 26% YTD) has outperformed the broader Smart Contract Platforms Sector (up 3% YTD) since January 1st, 2024.
The Dencun upgrade, which is less than a month away, will aim to enhance Ethereum in terms of scalability and cost-effectiveness. It is also expected to help the network compete with “faster chains in the Smart Contract Platforms Crypto Sector, such as Solana.”
Another narrative that may be propelling the price of ETH is the approval of Ethereum spot exchange-traded funds (ETFs) in the United States. Interestingly, Grayscale is amongst the asset managers looking to debut an Ether spot ETF.
Layer 1 Injective Introduces ‘CW-404’ to Capitalize on the ERC-404 Hype
Injective has partenred with DEX DojoSwap to introduce the CW-404 standard.
Ethereum Price At Make-or-Break Levels, Can ETH Surge To $3,200?
Ethereum price is struggling below the $3,030 resistance. ETH is consolidating and might start a downside correction below the $2,930 support.
- Ethereum struggled to stay above the $3,000 level and corrected lower.
- The price is trading above $2,930 and the 100-hourly Simple Moving Average.
- There is a key bullish trend line forming with support at $2,930 on the hourly chart of ETH/USD (data feed via Kraken).
- The pair could start a fresh increase unless there is a clear move below $2,930.
Ethereum Price Hits Support
Ethereum price made another attempt to gain pace above the $3,000 resistance zone. However, the bears were active above the $3,000 resistance. A new multi-week high is formed near $3,036 and the price started a downside correction, like Bitcoin.
There was a move below the $3,000 and $2,980 levels. The price spiked below the 50% Fib retracement level of the upward move from the $2,865 swing low to the $3,036 high. However, the bulls are now active near the $2,940 level.
Ethereum is now trading above $2,930 and the 100-hourly Simple Moving Average. There is also a key bullish trend line forming with support at $2,930 on the hourly chart of ETH/USD. The trend line is close to the 100-hourly Simple Moving Average and the 61.8% Fib retracement level of the upward move from the $2,865 swing low to the $3,036 high.
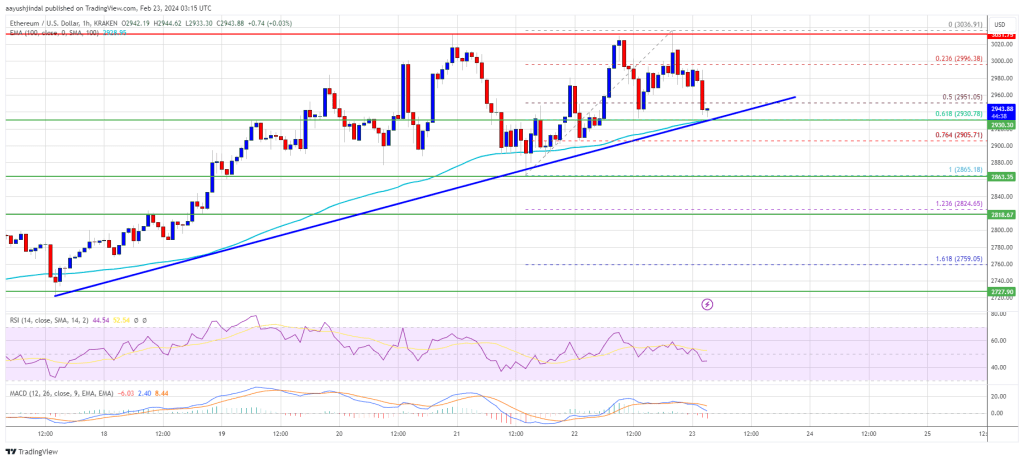
Source: ETHUSD on TradingView.com
Immediate resistance on the upside is near the $2,980 level. The first major resistance is near the $3,000 level. The next major resistance is near $3,035, above which the price might rise and test the $3,080 resistance zone. If there is a move above the $3,080 resistance, Ether could even rally toward the $3,200 resistance. Any more gains might call for a test of $3,250.
More Losses In ETH?
If Ethereum fails to clear the $3,000 resistance, it could continue to move down. Initial support on the downside is near the $2,930 level and the 100-hourly Simple Moving Average.
The first major support is near the $2,865 level. The next key support could be the $2,820 zone. A clear move below the $2,820 support might send the price toward $2,720. Any more losses might send the price toward the $2,550 level in the coming days.
Technical Indicators
Hourly MACD – The MACD for ETH/USD is losing momentum in the bullish zone.
Hourly RSI – The RSI for ETH/USD is now below the 50 level.
Major Support Level – $2,865
Major Resistance Level – $3,000
S&P Global Just Made Ethereum’s Centralization Risk a TradFi Concern
Institutional interest in digital assets means that crypto terms such as ‘Nakamoto Coefficient’ are now mainstream issues.
Bitcoin Long-Term Call: Analyst Predicts Price To Soar To $500,000
As Bitcoin makes its way through the erratic waves of the cryptocurrency market, crypto analysts are still bullish about the asset, predicting BTC to reach unprecedented heights in the long run.
Bitcoin To Reach $500,000 In The Long-Term
Bitcoin is currently in the spotlight as crypto expert Michael Van De Poppe has shared a bold prediction regarding BTC’s future with the community on the social media platform X (formerly Twitter).
According to Poppe, Bitcoin is presently experiencing an “overly bullish sentiment” from market participants within the cryptocurrency space. Due to this, he claims that there is “a likelihood” for the crypto asset to reach $500,000 in the long term.
Poppe also warned investors about upcoming severe corrections prior to the surge. However, he has urged them to take the dip as a “giant buying opportunity” to position themselves for future gains.
The post read:
The overly bullish sentiment is great for Bitcoin. Long-term, the likelihood of Bitcoin reaching $500,000 is definitely there. However, corrections will happen and they will be rough. If Bitcoin corrects by 20% or more, use those as a giant buying opportunity. That’s it.
The analyst’s prediction has sent quite a frenzy in the crypto community, with several enthusiasts expressing their belief in the forecast. A pseudonymous X user stated that he agrees with the projections while noting that “BTC has the potential to grow in the long-term.”
Poppe has also shed light on his “game plan” for the upcoming period for the digital asset. He pointed out two distinct aspects of the plan in light of Bitcoin’s corrections.
“Survive a potential Bitcoin correction, as Bitcoin is at the end of this run and probably consolidating,” he stated. In addition, he has encouraged investors to navigate their investment toward Ethereum during the time of the retracement. He added that investors should hold their ETH for about “1 to 2 months and wait in cash until the correction is over.”
BTC Is The Ultimate Safe Haven
Michael Van De Poppe is not the only analyst who believes Bitcoin has the potential to achieve the $500,000 mark. Max Keiser, a financial journalist, has also predicted that BTC will reach the aforementioned price target.
Keiser appears to be anticipating a significant crash in the stock market drawing a similar scenario to the 1987 crash. Consequently, he believes Bitcoin to be a safe haven during this period, as he expects the token to “soar past $500,000.”
The expert also noted that BTC ETFs and domestic miners will be confiscated by the US government within this period. However, despite this action, Keiser reckoned that BTC would still see more inflows than Gold in the market.
Eigen Labs, Developer Behind Restaking Protocol EigenLayer, Raises $100M From A16z Crypto
The pioneering restaking project EigenLayer, led by Sreeram Kannan, isn’t even live but investors are piling in. A16z Crypto is affiliated with the venture capital firm Andreessen Horowitz.
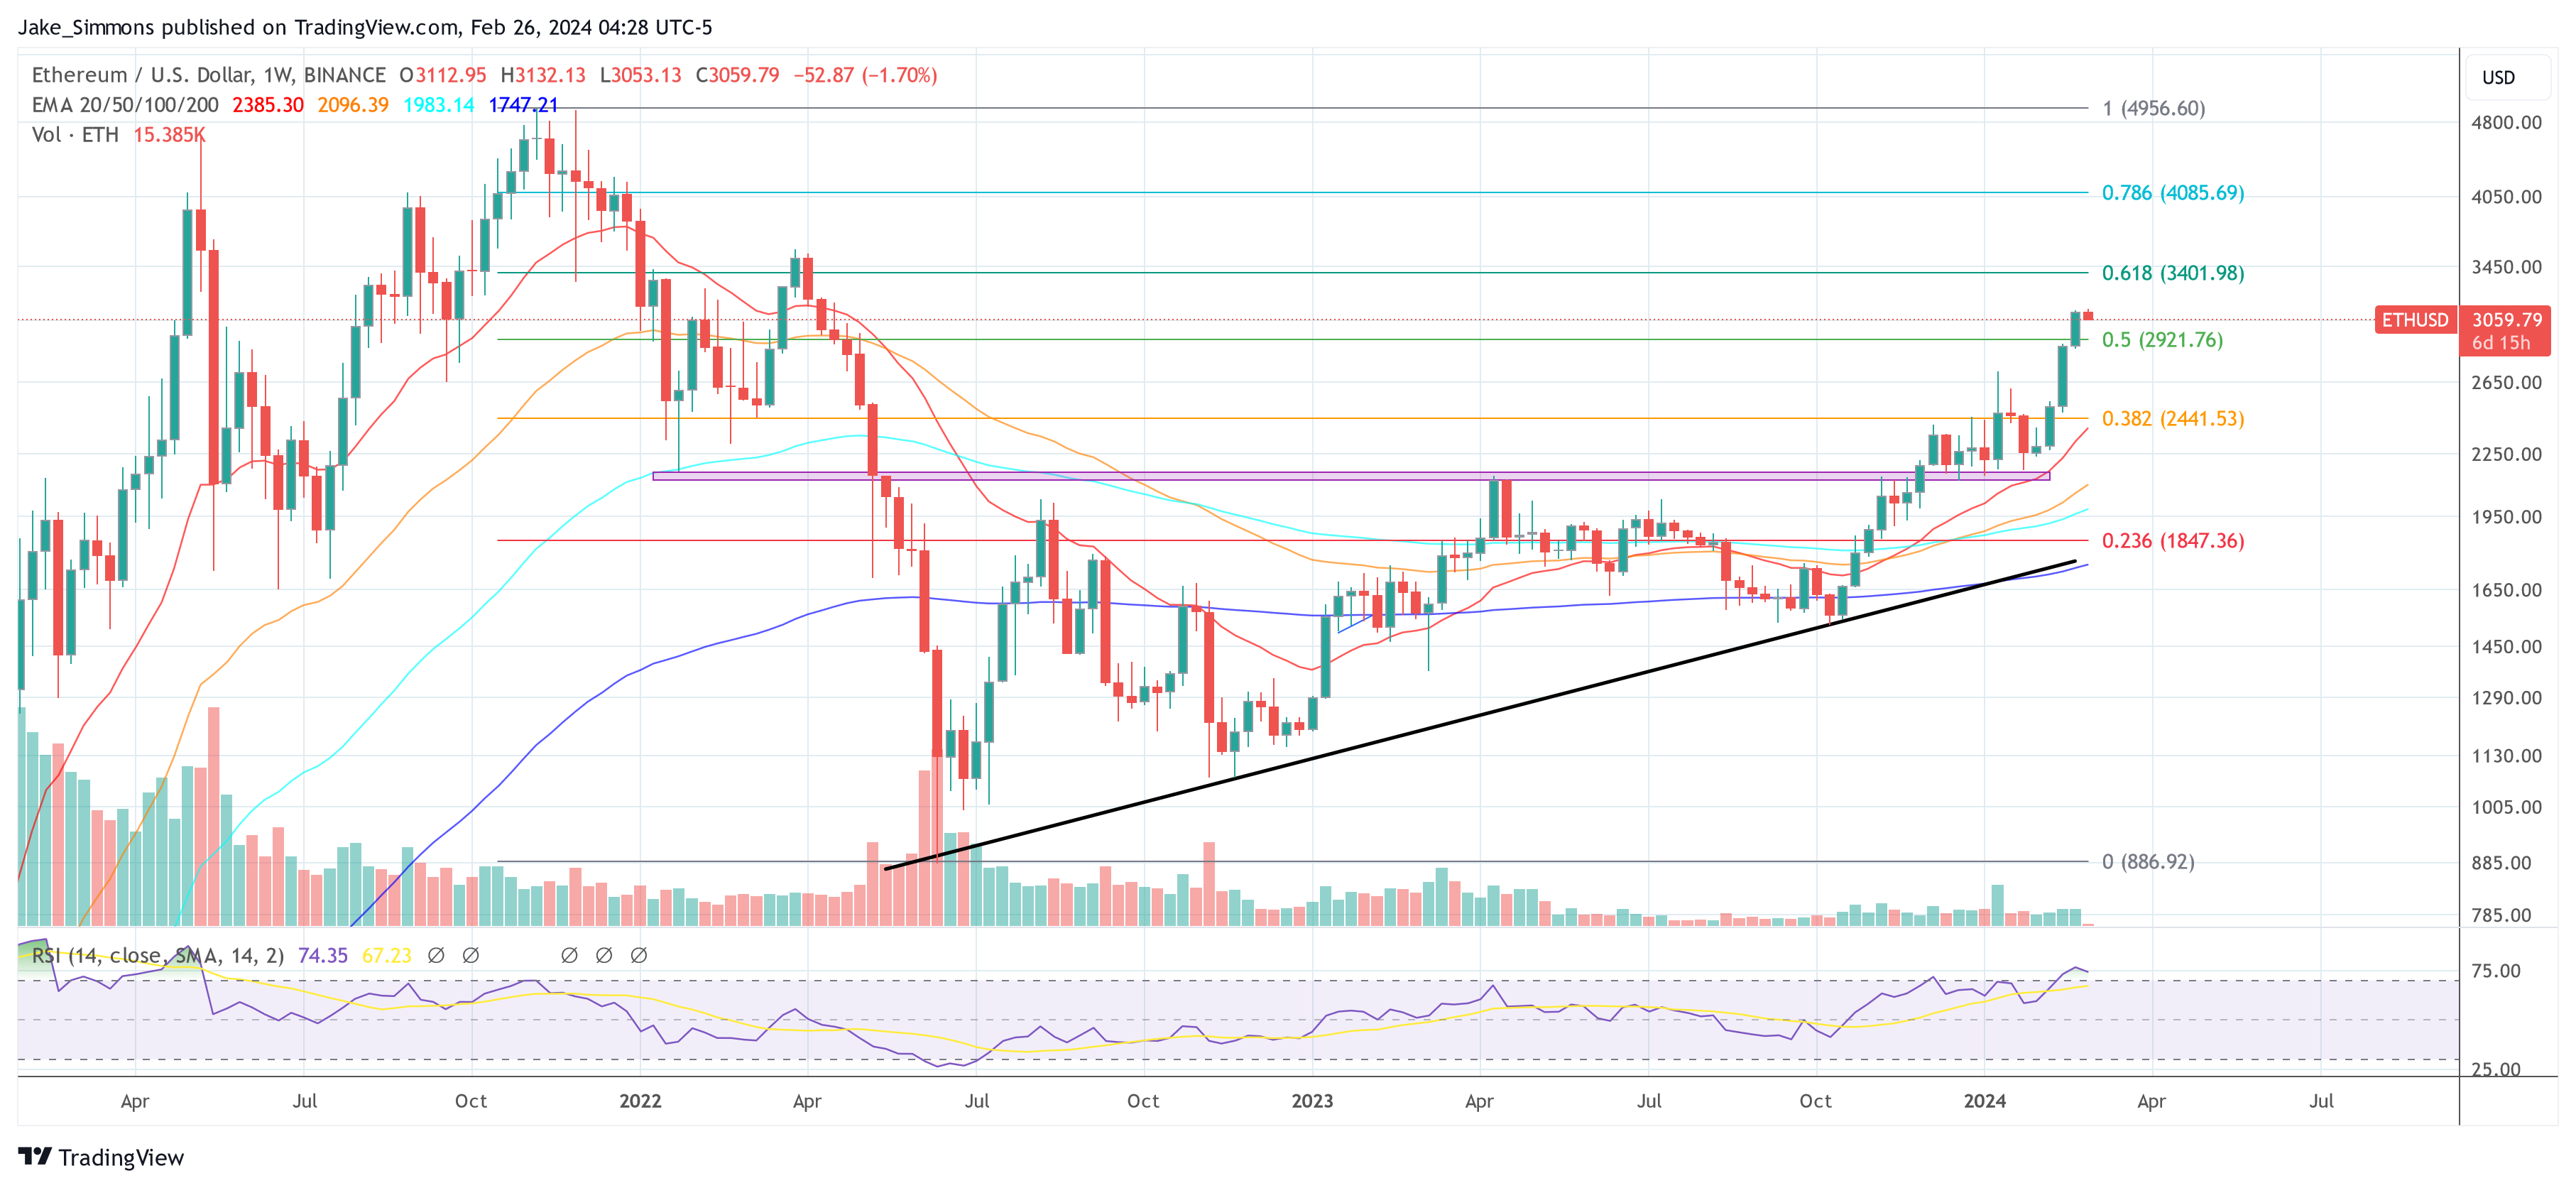
Ethereum Breaks Back Above $3,000, Will FOMO Lead To Top Again?
Ethereum has once again broken above the $3,000 level after previous attempts ended in failure as FOMO took over the investors.
Ethereum Has Rallied 3% In Past Day To Break Back Above $3,000
Earlier, Ethereum had made two attempts at the $3,000 level, but both of them had turned out to be brief as the asset quickly retraced back to lower levels. In the past day, ETH has once again made a push towards the mark, as the chart below shows.
In this latest surge, ETH has seen a sharp recovery of more than 3% from around the $2,900 mark to the current levels. The coin is now up 8% in the past week, making it the second-best performer among the top 10 cryptocurrencies, just behind BNB’s 10% profits.
From the graph, it’s visible that Ethereum is now within touching distance of setting a new high for the year. But ETH investors would be wondering if this rally would sustain or if it would end up losing steam, just like the previous ones. If data is anything to go by, market sentiment may have been the reason behind the demise of the last surges.
ETH’s Previous Surges Topped Out As FOMO Took Over Traders
According to data from the analytics firm Santiment, the latest top above $3,000 occurred as the crowd euphoria spiked. The indicator of interest here is the “Social Volume,” which keeps track of the total amount of discussion that social media users are participating in around a given term or topic.
The metric calculates this value by counting up the number of posts/threads/messages across the major social media platforms that are making at least one mention of the topic.
The below chart shows the data of the Social Volume related to two Ethereum topics:
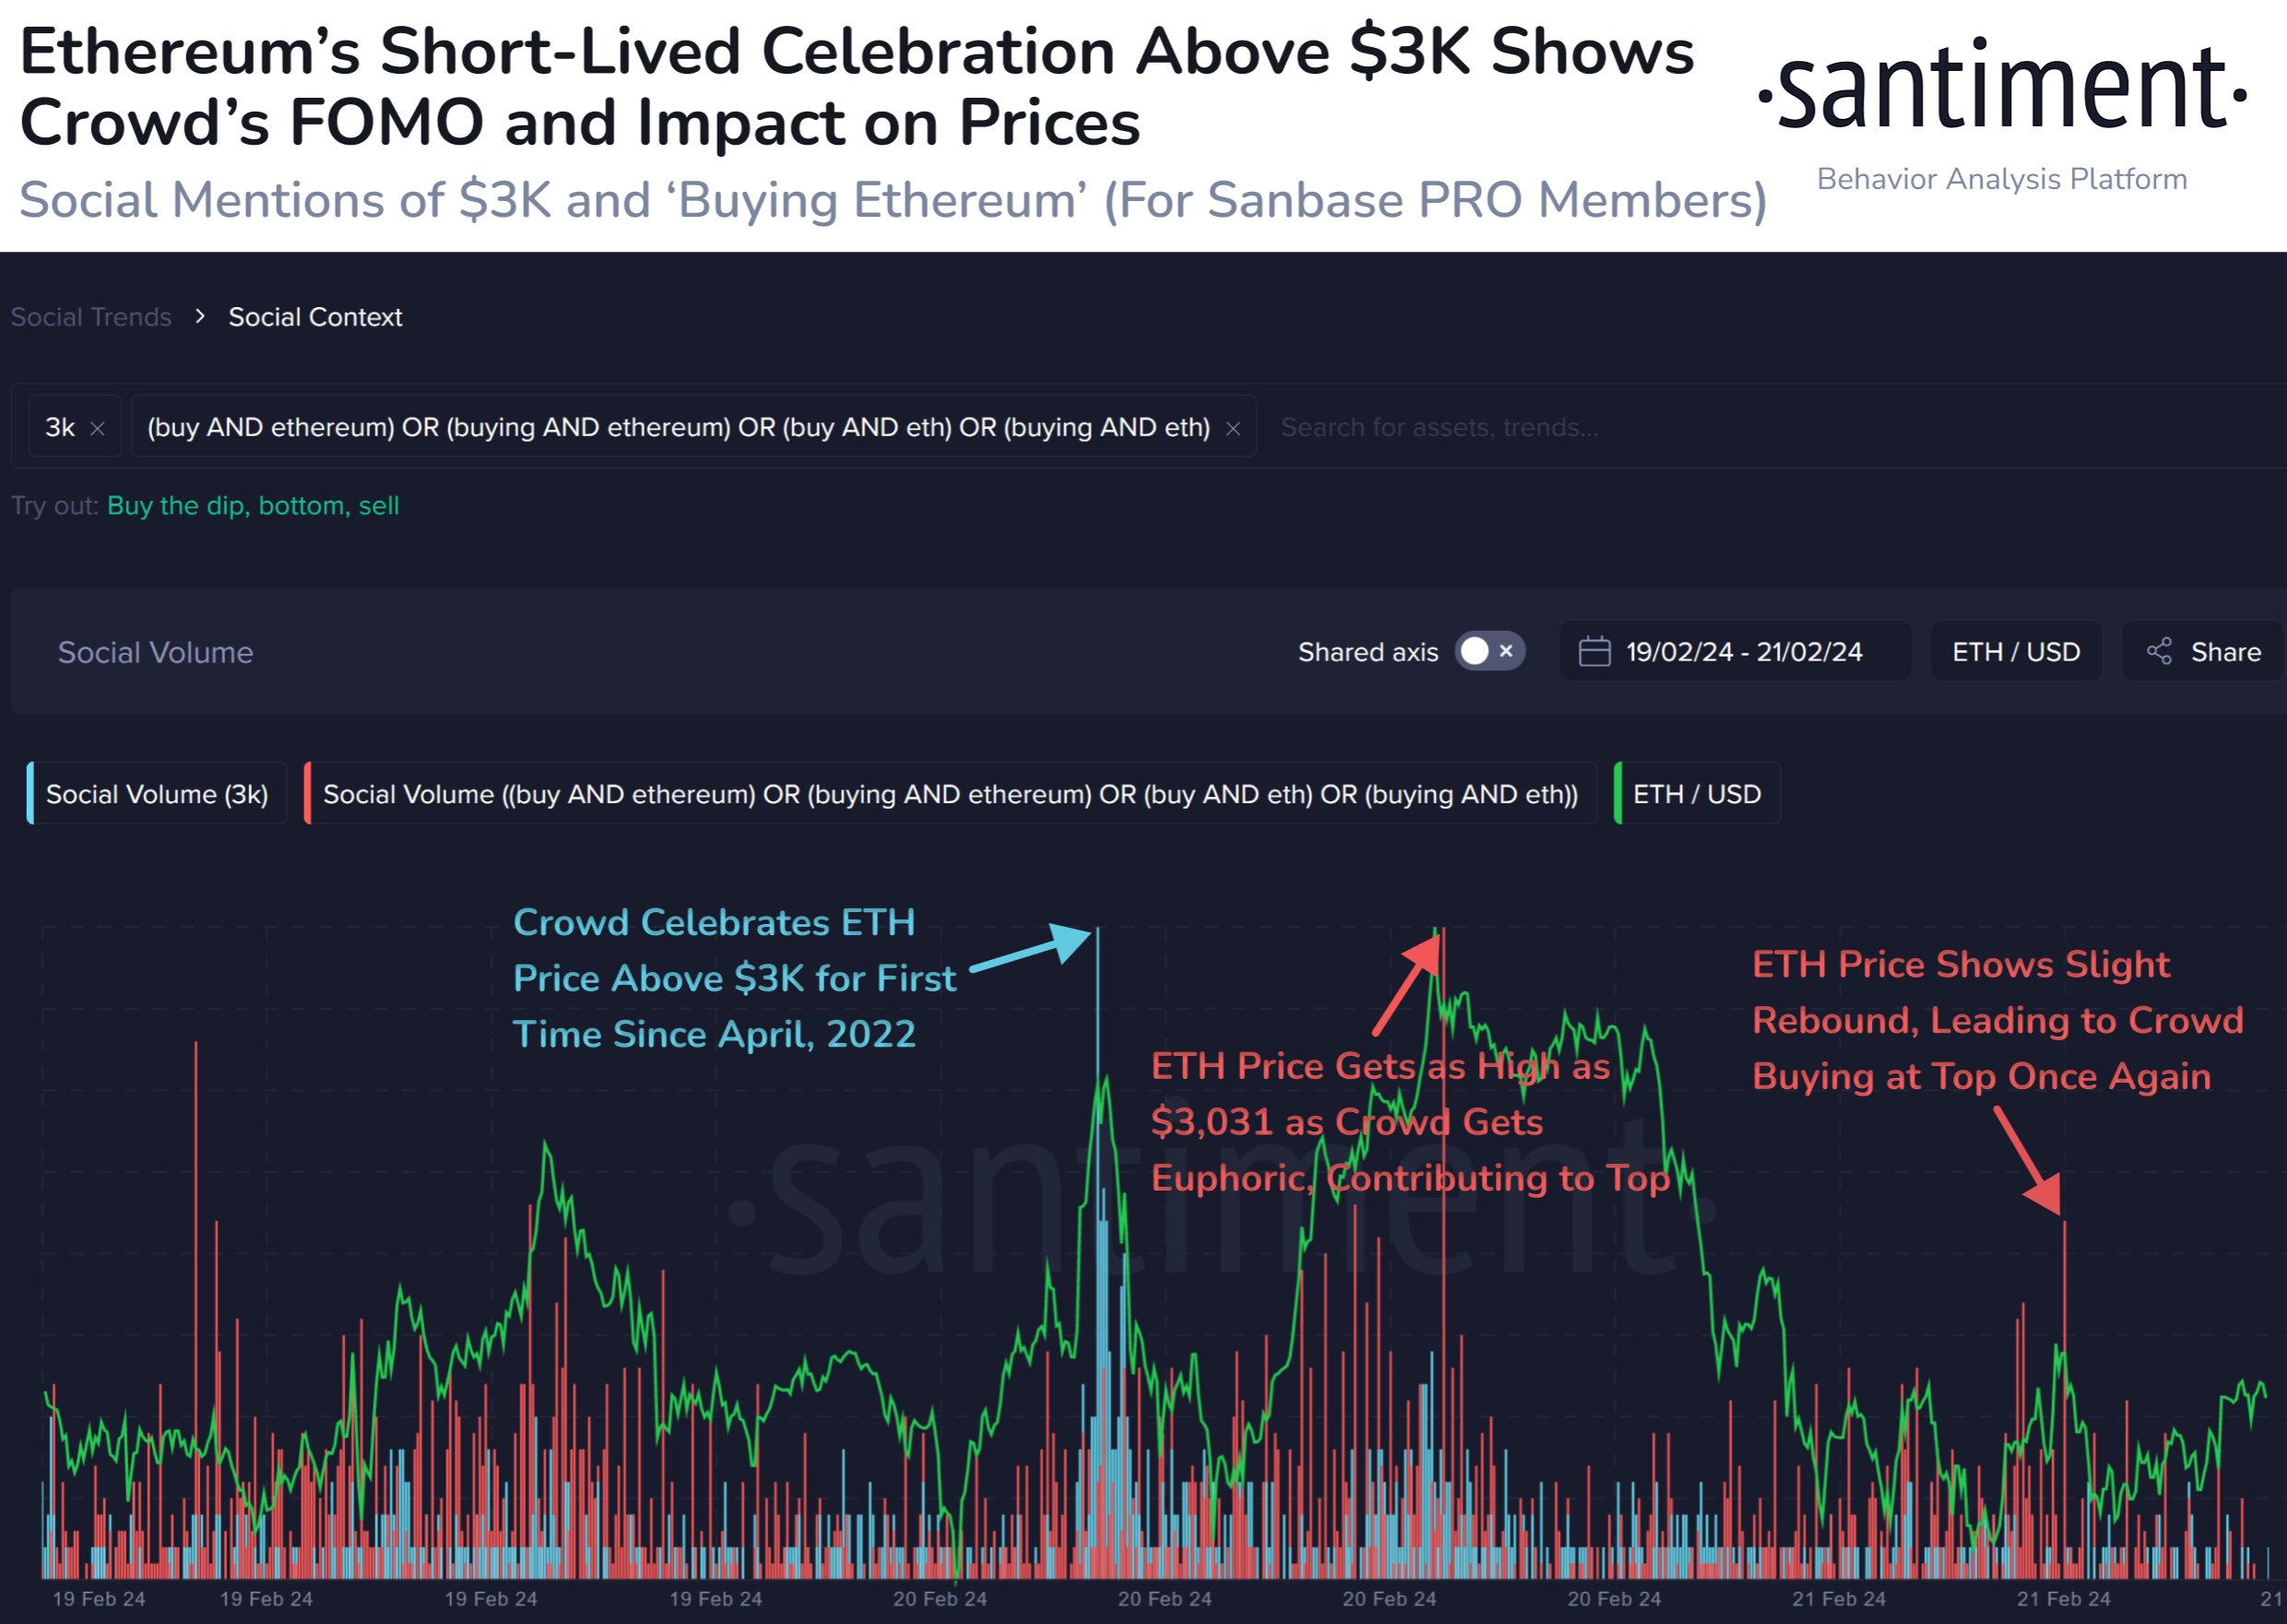
The first Social Volume here has been filtered for $3,000. As is visible in the graph, this metric spiked as ETH broke above $3,000 for the first time since April 2022 a couple of days back.
This would suggest that discussions around the topic had spiked high as traders had celebrated the break. As it had turned out, though, the surge was pretty short-lived.
In the second attempt, the Social Volume related to terms like “buy Ethereum” had registered a large spike, implying that FOMO had developed among the traders.
Historically, FOMO has been something that has made tops likely, as ETH’s price has tended to go contrary to the expectations of the crowd. This is likely the reason why the top coincided with this spike.
A similar phenomenon occurred with the small recovery surge observed yesterday, as Santiment has highlighted in the chart. It would seem that greed had once again led to the coin topping out.
It now remains to be seen how the market reacts to the latest rally above $3,000. If FOMO around Ethereum once again spikes on social media, then it may very well be a sign that this surge, too, may only be temporary.


