Aave V3 Ready For Solana After This Crucial Vote Passed

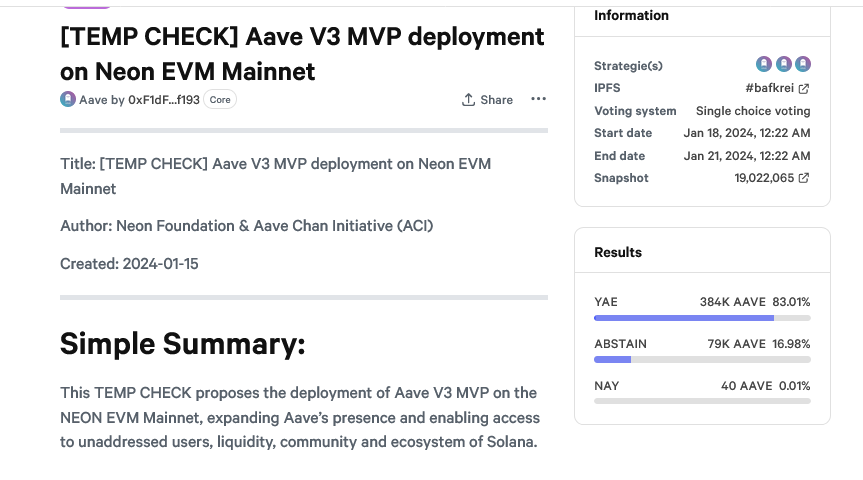
The Aave community has overwhelmingly approved a proposal that will set the ball rolling for deploying Aave V3 on Solana, a smart contracts platform. The motion, put forward by the Neon Foundation and the Aave Chan Initiative (ACI), passed with a majority vote of 83% based on results posted on January 21.

Aave TEMP CHECK voting | Source: Snapshot.org

Solana Fast Rising, DeFi Ecosystem Active

Solana has been rapidly expanding, with its native currency, SOL, emerging as one of the top performers in 2023. To put it in perspective, SOL prices exploded from about $10 in 2023 to around $125 by the end of the year. 

Solana price trending downward on the daily chart | Source: SOLUSDT on Binance, TradingView

This surge saw SOL reverse losses of November 2022 while concurrently catalyzing events on the blockchain, spurring various activities, including the expansion of decentralized finance (DeFi), non-fungible token (NFT), and meme coin activities. 

Related Reading: Bitcoin Price Turns Red, Why BTC Could Tumble Below $40K

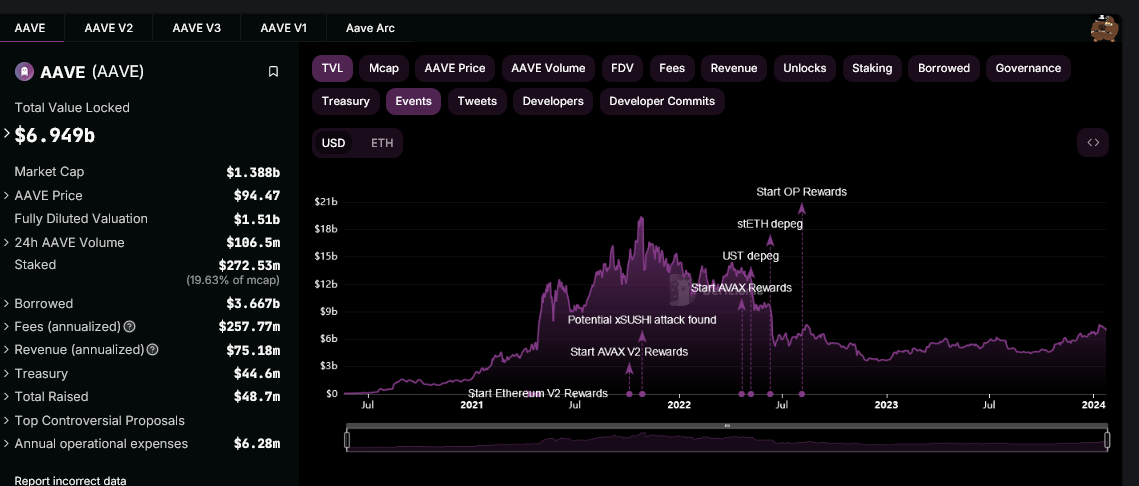
On the other hand, Aave has been expanding to multiple Ethereum Virtual Machine (EVM) compatible networks, emerging as one of the leading decentralized finance (DeFi) protocols. According to on-chain data from DeFiLlama on January 22, Aave manages over $6.9 billion worth of assets across ten chains. A big chunk, over 90%, comprises assets on Ethereum. Aave v3 has a total value locked (TVL) of $4.9 billion.

<yoastmark class=

Aave V3 On Solana, What It Means

The TEMP CHECK proposers are keen on Aave v3 deploying on Solana, considering the blockchain’s rapid growth in the past year. They observe that the blockchain’s DeFi TVL and broad user base would likely benefit the lending and borrowing protocol, cementing its position as a market leader. 

If Aave is deployed on Solana, the protocol will access the deep liquidity on the blockchain. At the same time, users will access Aave services more conveniently. Subsequently, the proposers reiterated this move will cement Aave’s position as the leading liquidity market on-chain. Moreover, it will likely open up new opportunities for collaboration between the Aave, Solana, and other Neon EVM communities. 

Neon EVM is a cross-chain bridge for users to transfer assets between Ethereum and other blockchains. Through this bridge, Aave v3 will go live on Solana without any major reconfiguration of the protocol’s codebase. Among the tokens that will be initially supported is SOL. Users will be free to borrow USDC, a stablecoin.

The passing of the TEMP CHECK also reflects Aave’s ambition to expand across multiple blockchains beyond EVM networks. So far, Aave has been deployed on various platforms, including layer-2s like Arbitrum and Base, Avalanche, and Ethereum’s sidechain, Polygon.

Solana Stablecoin Volume Reaches Record High Of $300 Billion In January

According to the latest on-chain data, the Layer-1 network Solana has hit a significant milestone in terms of the transfer volume of stablecoins this month.

Solana Overtakes Tron In Stablecoin Transfer Volume

Data from the blockchain analytics platform Artemis shows that the stablecoin transfer volume on Solana has already surpassed $300 billion in January. This is the largest transfer volume recorded by stablecoins on the Layer-1 blockchain in a single month.

To put this figure into context, the Solana network registered $297 billion in stablecoin volume in the entire December. Meanwhile, the blockchain’s stablecoin transfer volume was about $11.56 billion in January 2023, reflecting an over 2,500% growth in the past year.

Solana

From the chart above, it is clear that Solana’s stablecoin activity has been on a steady rise since October, increasing by more than 650% in the past few months.  This growth has also impacted the network’s share in the stablecoin market, with Solana now boasting about 32% market share.

Unsurprisingly, Ethereum leads the market for stablecoins, with its transfer volume already reaching almost $317 billion in January. Meanwhile, the Tron network trails Solana in third place, with a stablecoin volume of roughly $240 billion.

On Thursday, January 18, Paxos revealed the launch of its regulated stablecoin, USDP, on the Solana network. According to DefiLlama data, USDC remains the dominant stablecoin on the Layer-1 network, with a market cap of over $1 billion.

SOL Price Overview

Despite Solana’s burgeoning network activity, the price performance of its native token SOL has somewhat dampened in the past few weeks. As of this writing, the Solana token is valued at $92, reflecting a 0.6% decline in the last 24 hours.

This sluggish performance in the past day underscores the altcoin’s challenges since the turn of the year. After reaching a multi-month high of $124 at the end of 2023, the SOL price has largely struggled to hold above the $100 mark.

According to data from CoinGecko, the Solana token is down by more than 5% in the past week. Meanwhile, the coin has declined by about double that figure since the beginning of 2024.

Nevertheless, SOL maintains its position as the fifth-largest cryptocurrency in the sector, with a market capitalization of more than $40 billion.

Solana

Market Dips, Whales Play: Bitcoin And Ethereum Snagged By Savvy Investors

Recently, cryptocurrency analytics platform Lookonchain reported activities of Bitcoin (BTC) and Ethereum (ETH) whales amid the ongoing market downturn. These whales appear to have been capitalizing on the recent decline in the crypto prices to bolster their holdings.

According to Lookonchain, amid the market dip, a newly established wallet withdrew 700 BTC, valued at roughly $29.36 million, from the Binance exchange.

These BTCs were purchased at an average price of $41,948 each.It is worth noting that, according to the analyst, such a move during a market downturn demonstrates a bullish sentiment on the future of BTC.

Ethereum Whales Joining The Fray

The narrative of strategic accumulation isn’t limited to Bitcoin. Lookonchain’s subsequent tweet highlighted similar activities in the Ethereum market.

A whale took advantage of the decreased Ethereum prices, buying 3,600 ETH, worth around $8.9 million. Lookonchain highlighted that this investor’s history of buying ETH at lower prices and selling at higher valuations has resulted in substantial profits, estimated at around $25.8 million.

These whale movements are worth noting, especially considering the increasing bearish sentiment in the cryptocurrency markets. Ethereum, for instance, has seen a 1.9% decline in the past 24 hours and a 7.8% drop over the past week.

The asset is currently trading at around $2,475. Bitcoin is experiencing a similar trend, with a nearly 3% decrease in the past 24 hours and a 10% fall over the past week, bringing its price to $40,819 at the time of writing.

BTC price chart on TradingView.com

This market downturn is also reflected in the asset’s trading volume. Bitcoin’s daily trading volume fell from over $40 billion last Friday to about $26 billion.

Bitcoin Market Analysis And Future Predictions

In light of these developments, renowned crypto analyst Jacob Canfield has cautioned that Bitcoin might face further corrections in the short term.

Canfield notes that the upcoming Bitcoin halving could play a crucial role in rebalancing the market dynamics, potentially tipping the scale towards demand over supply. However, his analysis of Bitcoin’s 4-hour chart indicates the formation of a trend that has historically been an indicator of negative short to mid-term price movements.

For Bitcoin, critical levels include $48,700, marked by the 61.8% Fibonacci retracement, weekly resistance, and a significant support level to watch at $38,700. Earlier this month, Bitcoin traded at the $48,700 zone before retracing.

Canfield warns that following a tap of the 61.8% level, Bitcoin often experiences an 18-22% sell-off, potentially bringing it back to the $38,700 support level.

Featured image from Unsplash, Chart from TradingView

Ethereum Price Dips Alongside Bitcoin, Decoding Key Hurdles To Fresh Increase

Ethereum price struggled to rise above $2,550 and $2,580. ETH started a fresh decline like Bitcoin and traded below the $2,500 support zone.

  • Ethereum attempted a fresh increase but failed to surpass $2,550.
  • The price is trading below $2,500 and the 100-hourly Simple Moving Average.
  • There is a connecting bearish trend line forming with resistance near $2,480 on the hourly chart of ETH/USD (data feed via Kraken).
  • The pair continue to move down if there is a move below the $2,425 support.

Ethereum Price Extends Decline

Ethereum price struggled to gain pace for a move above the $2,550 and $2,580 resistance levels. ETH formed a short-term top and started a fresh decline below $2,500 like Bitcoin.

There was a move below the $2,450 level. A new weekly low was formed near $2,424 and the price is now consolidating losses. There was a minor increase above the $2,450 level, but the bears were active near the 23.6% Fib retracement level of the downward move from the $2,614 swing high to the $2,424 low.

Ethereum is now trading below $2,500 and the 100-hourly Simple Moving Average. On the upside, the price is facing resistance near the $2,465 level. The next hurdle could be $2,480. There is also a connecting bearish trend line forming with resistance near $2,480 on the hourly chart of ETH/USD.

The next major resistance is now near $2,520. A clear move above the $2,520 level might start a decent increase. In the stated case, the price could rise toward the $2,580 level.

Ethereum Price

Source: ETHUSD on TradingView.com

The next key hurdle sits near the $2,620 zone. A close above the $2,620 resistance could start another steady increase. The next key resistance is near $2,680. Any more gains might send the price toward the $2,720 zone.

More Losses in ETH?

If Ethereum fails to clear the $2,520 resistance, it could start another decline. Initial support on the downside is near the $2,440 level.

The next key support could be the $2,425 zone. A downside break below the $2,425 support might send the price further lower. In the stated case, Ether could test the $2,350 support. Any more losses might send the price toward the $2,320 level.

Technical Indicators

Hourly MACDThe MACD for ETH/USD is gaining momentum in the bearish zone.

Hourly RSIThe RSI for ETH/USD is now below the 50 level.

Major Support Level – $2,425

Major Resistance Level – $2,520

Ethereum Price Rejects $2,600, Can Bulls Save This Key Support?

Ethereum price struggled to extend gains above $2,600 and $2,620. ETH trimmed gains and might struggle to stay above the $2,500 support zone.

  • Ethereum attempted a fresh increase but failed to surpass $2,620.
  • The price is trading below $2,550 and the 100-hourly Simple Moving Average.
  • There is a key bearish trend line forming with resistance near $2,540 on the hourly chart of ETH/USD (data feed via Kraken).
  • The pair start another increase if the bulls protect the $2,500 and $2,470 support levels.

Ethereum Price Revisits Support

Ethereum price started a fresh increase above the $2,520 resistance zone. ETH even climbed above the $2,550 level, but the bears were active near $2,600, like Bitcoin.

The price traded as high as $2,614 and recently started a fresh decline. There was a move below the $2,550 support zone. The price traded below the 61.8% Fib retracement level of the upward wave from the $2,471 swing low to the $2,614 high.

Ethereum is now trading below $2,550 and the 100-hourly Simple Moving Average. The bulls seem to be currently active above the 76.4% Fib retracement level of the upward wave from the $2,471 swing low to the $2,614 high.

On the upside, the price is facing resistance near the $2,540 level. There is also a key bearish trend line forming with resistance near $2,540 on the hourly chart of ETH/USD. The next major resistance is now near $2,580. A clear move above the $2,580 level might start a decent increase. In the stated case, the price could rise toward the $2,620 level.

Ethereum Price

Source: ETHUSD on TradingView.com

The next key hurdle sits near the $2,650 zone. A close above the $2,650 resistance could start another steady increase. The next key resistance is near $2,720. Any more gains might send the price toward the $2,800 zone.

Downside Break in ETH?

If Ethereum fails to clear the $2,540 resistance, it could start another decline. Initial support on the downside is near the $2,500 level.

The next key support could be the $2,470 zone. A downside break below the $2,470 support might send the price further lower. In the stated case, Ether could test the $2,400 support. Any more losses might send the price toward the $2,350 level.

Technical Indicators

Hourly MACDThe MACD for ETH/USD is gaining momentum in the bearish zone.

Hourly RSIThe RSI for ETH/USD is now below the 50 level.

Major Support Level – $2,500

Major Resistance Level – $2,540

Crypto Exchanges Trading Volume Hit $10.3T in 2023, New Data Shows

CoinGecko’s 2023 Annual Crypto Industry Report has been released. It covers crypto exchanges and their current state, Bitcoin’s +155.2% and Ethereum’s +90.5% growth, analyzing NFT trading volume throughout the year, and more.

Among the report’s highlights is the comprehensive review of the crypto trading volume in 2023 through the performance of centralized crypto exchanges (CEX) and decentralized exchanges (DEX).

Centralized Crypto Exchanges Dominated

Crypto saw a $36.6 trillion trading volume in 2023, with a volume increase of +53.1% from Q3 ($6.7 trillion) to Q4 ($10.3 T). The Q4 increase marked the first quarter-on-quarter (QoQ) growth of 2023 and could be attributed to the “growing bullish sentiment” in the crypto market due to the anticipation of spot Bitcoin ETFs’ approval by the SEC.

Despite the market’s challenges, such as the aftermath of FTX’s collapse, the worldwide banking crisis, or Binance’s regulatory difficulties in 2023, the data presented in the report shows an overall market recovery.

In December 2023, the trading volume increased sharply to $4.3 trillion, a volume not seen since March 2023. Overall 2023, centralized exchanges dominated the year despite the challenges, especially when compared to decentralized exchanges (DEX). The report details:

  • CEXto DEX spot trading volume ratio hovered around 91.5% in Q4.
  • CEX to DEX derivatives trading volume ratio dropped to 97.3% from 98.5%.
  • CEX to DEX spot ratio stood at 91.4% in 2023.
  • CEX to DEX derivatives ratio was 98.1% in 2023.

Binance, Upbit, OKX, Bybit, and Coinbase are among the Top 10 centralized exchanges by trading volume. Binance managed to dominate the list despite dropping to a yearly low market share of 41% in November, following a continued loss throughout 2023.

There was a +98.1% increase QoQ, after the top 10 CEXes recorded $2.20 trillion in spot trading volume in 2023 Q4. Previously, the trading volume had failed to reach above $2 trillion for two consecutive quarters.

Altogether, the top 10 CEXes recorded $7.2 trillion in spot trading volume in 2023 compared to $9.4 trillion in 2022, representing a -23.4% year-on-year (YoY) decline.

Deep Dive Into The Spot Decentralized Exchanges (DEX) Trading Volume In 2023

The Top 10 DEXes recorded $205.3 billion in spot trading volume in 2023 Q4, indicating a +87.1% Total Trading Volume Increase QoQ. Uniswap, Pancakeswap, Orca, Curve, and THORSwap dominate the DEXes in 2023’s Top 10 spot DEX trading volume.

Notably, the report names Orca and THORSwap as the biggest gainers amongst the DEXes in 2023 Q4, with Orca increasing 1,079% ($12.2 billion), while THORSwap saw a surge of 422.4% ($10.1 billion)

When breaking down the 2023 spot DEX trading volume breakdown by chain, the report details that Ethereum had $99.3 billion of DEX trading volume in 2023 Q4, displaying an increase of +38.3% from 2023 Q3. However, it ended with a low 41% dominance, dropping below 50% for the first time in 2023 in November and December.

It’s worth noting that Solana was the biggest gainer, with a 985.5% increase in QoQ, while THORChain took second place with a 422.4% trading volume increase in Q4. The data shows that the two chains ranked #3 and #5 in December 2023.

The Protocol: MetaMask’s Secret Weapon and Ethereum’s Dencun Debacle

In this issue of CoinDesk’s weekly newsletter on blockchain technology, we bring you Sam Kessler’s scoop on MetaMask’s in-development “intents” feature that could revolutionize how users interact with blockchains. Also: a post-mortem on Ethereum’s unexpectedly ugly Dencun testnet upgrade – and a glimpse of one of the new data blobs.

Developer Hails ETH Burning, Will Ethereum Break $3,000?

Péter Szilágyi, an Ethereum (ETH) developer, has lauded EIP-1559 and its ETH burning mechanism as “the great equalizer.” Taking to X on January 16, Szilágyi admired EIP-1559’s ability to “level the playing field between validators and regular users.”

Developer: EIP-1559 Is A “Great Equalizer”

Since the implementation of EIP-1559, Ethereum adjusted how users bid gas fees, introducing the “base fee,” which was burned or sent to an irretrievable wallet. So far, data from Ultrasound Money shows that over 3.9 million ETH have been destroyed.

In the last week alone, the Ethereum network automatically sent more than 21,100 ETH out of circulation, “burning” ETH’s supply. 

ETH burning | Source: Ultrasound Money

Specifically, Szilágyi mentioned the advantage regular users have with EIP-1559. Through this implementation, validators (previously miners before Ethereum shifted to a proof-of-stake blockchain) no longer have the privilege of arbitrarily adjusting gas limits and transaction fees. 

Earlier, that leeway created what the developer described as an “imbalance,” which made it tough for “regular users to compete.” However, following this implementation, everyone must adhere regardless of status as a validator, founder, or user. 

With EIP-1559, the “base fee” adjustment is set at the protocol level. It is this base fee that the network burns, gradually making ETH deflationary, reading from the number of coins taken out of circulation since EIP-1559 went live in early August 2021. Even so, a sender can “tip” the validator, incentivizing them to prioritize validating a transaction.

Stability And Predictability Achieved, Ethereum Upsides Capped At $3,000

Szilágyi’s comments reflect a growing consensus among Ethereum supporters regarding the positive impact of EIP-1559. Though a big percentage of EIP-1559 is fixated on the price impact of the proposal, there is more that it achieves. 

Most importantly, from a user experience perspective, it is now easier for senders to predict how much they will pay for a transaction. This is crucial, especially when the network is congested. Additionally, though the Ethereum gas fee remains relatively high, EIP-1559, though considered a “bad idea” by Szilágyi, has stabilized the network. 

Ethereum price trending upward on the daily chart | Source: ETHUSDT on Binance, TradingView

ETH burning is attributed to reducing inflation in Ethereum, a network whose total supply is not capped like Bitcoin. Over the long term, prices might benefit from this proposal. However, prices are bullish in the short to medium term. Still, upsides are limited to around the $3,000 psychological round number.

Here Are The Most Bullish Predictions For ETH Price As Ethereum Dominance Rises Against Bitcoin

The sentiments around Ethereum look to be very bullish at the moment as the second-largest crypto token by market cap has seen its dominance surge against Bitcoin. Ethereum’s rise against the flagship crypto token is also significant, as crypto analyst Jaydee recently suggested that it could usher in the altcoin season. 

Bullish Predictions For Ethereum’s Price

Crypto analyst Ali Martinez recently highlighted the fact that Ethereum broke out from an ascending triangle on the weekly chart. According to him, the crypto token has its eyes on the $3,400 price level despite the short-term volatility. Backing Ali’s analysis, crypto analyst Mayne shared their belief that $3,400 remains a viable target for ETH’s price.

Interestingly, Mayne hinted that “ETH betas” could run alongside ETH when this significant price surge begins to happen. These ETH betas include tokens like the native tokens of Ethereum’s layer-2 networks Optimism and Arbitrum. 

Crypto analyst Ash Crypto also offered a bullish prediction for ETH’s price while commenting on the state of the market. He remarked that money was currently flowing from Bitcoin to Ethereum and that it shouldn’t be long before the latter trades above $3,200. 

ETH trading above the $3,000 price level looks to be the consensus going by these predictions. The CEO and founder of MN Trading, Michaël van de Poppe, had before now suggested that ETH was also going to rise above $3,000 on its way to $3,500. Then, Poppe boldly claimed that this price prediction would materialize in the first quarter of 2024.

Meanwhile, crypto analyst ColdBloodedShill stated in a recent X post that ETH is likely planning for higher prices as long as it remains above $2,400. The $2,400 price range looks to be an important support level as ETH looks to break out. Crypto analyst Bluntz Capital also highlighted that price range ($2,495 specifically) as he noted that there will be an eventual breakout as long as ETH holds above that level. 

Ethereum price chart from Tradingview.com

Conviction On Ethereum Getting Stronger

Market intelligence platform Santiment recently revealed that the number of new ETH addresses is on the rise as Ethereum continues to outperform Bitcoin. 89.4 thousand addresses are said to have been created daily during this stretch. This represents a significant increase from late last year, when 70.4 addresses were created daily in early November.

Santiment also added that ETH’s supply on exchanges had reduced drastically to 8.10%, almost getting close to its all-time low (since the opening week of trading) of 8.05%. Such a development usually suggests that ETH holders are looking to hold for the long term as they move their holdings to self-custody.

QCP Capital Forecasts ETH’s Dominance Over Bitcoin To Persist, Ethereum ETFs In Focus

Over the past 30 days, Ethereum (ETH), the second-largest cryptocurrency, has experienced a notable surge of 17%, outperforming Bitcoin (BTC), which has recorded a surge of 2.5% over the same period. 

This comes as the initial excitement surrounding the approval of the exchange-traded funds (ETFs) by the US Securities and Exchange Commission (SEC) appears to have waned, with BTC witnessing a 5% drop in the past seven days. 

Interestingly, according to crypto trading firm QCP Capital, following the approval of Bitcoin ETFs, the focus has shifted to the potential launch of an ETH spot ETF, which could be one of the factors for Ethereum outperforming BTC.  

Ethereum Gains Ground Against BTC 

According to QCP Capital, the total volumes transacted across all 11 ETFs in the past week have reached $9.8 billion. The Grayscale Bitcoin Trust (GBTC) alone accounted for $4.6 billion. 

Since converting from a Trust to an ETF, GBTC has experienced outflows of $1.17 billion. This is “unsurprising” for the firm, considering GBTC had been trading at a discount since 2020, offering investors an opportunity to exit at par value. 

BTC initially surged to a high of $49,100 upon ETF approval but has since seen a decline, consolidating above the $40,000 support level. Volumes have slowed since the initial launch, and market attention is focused on GBTC outflows

Meanwhile, ETHBTC, which traded below 0.05, has seen an upward trend to 0.06. According to QCP Capital, Ethereum is anticipated to continue to outperform Bitcoin in the medium term as the narrative shifts towards potential ETH Spot ETF approvals.

Bitcoin Forward Contract Yields Decrease

Following the launch of the BTC spot ETF, BTC forward contracts have experienced a greater decline compared to ETH forward contracts. BTC 1-month forward fell from 32% annualized to 9% (-23%), while ETH 1-month forward decreased from 28% to 12% (-16%). 

According to QCP Capital, despite declining yields, ETH forwards still appear attractive, offering 11-13% annualized returns. Additionally, selling ETH 1-month 2200 Puts presents a viable option with yields above 21% annually, and it could be a suitable level to buy in the event of a dip upon potential ETH spot ETF approvals.

Ultimately, the crypto firm suggests that the forthcoming BTC halving in mid-April and the potential approval of ETH Spot ETFs from May are anticipated to be significant events for the crypto market. 

In the interim, market movements may also be influenced by macroeconomic events. The January Federal Open Market Committee (FOMC) meeting, as well as the February Non-Farm Payrolls (NFP) and Consumer Price Index (CPI) reports, are being closely monitored for insights. 

The pace of the balance sheet runoff, discussed briefly in December 2023, is expected to provide further clarity during the January FOMC meeting. The market consensus suggests a slowdown in quantitative tightening (QT), but the timing and extent of these changes remain uncertain.

Overall, the potential launch of an Ethereum spot ETF has sparked speculation and could have a transformative impact on the Ethereum ecosystem. As the market grapples with changing dynamics, attention remains on key events, such as the BTC halving and potential ETH Spot ETF approvals.

Ethereum

Featured image from Shutterstock, chart from TradingView.com

Bitcoin Backs Down: Ethereum Steals The Spotlight With Surge In Market Dominance

Amidst the lull in the realm of Bitcoin, Ethereum emerges as a trailblazer, confidently charting its course. While the crypto king takes a breather following its ETF approval, Ethereum, undeterred, is experiencing a surge in both price and dominance, propelled by an influx of new users and the prevailing trend of self-custody.

Recent data from Santiment vividly illustrates Ethereum’s ascendancy. The platform’s price dominance, reflecting its market share in comparison to all other cryptocurrencies, has witnessed a remarkable surge of 22.4% within a mere week.

Ethereum’s Remarkable Surge: Growing Community, Strong On-Chain

This surge is not merely a passive spectacle; Ethereum is actively attracting an astonishing 89,400 new addresses on a daily basis, with an unprecedented 96,300 joining the Ethereum community in a single day.

This momentum is not solely about acquiring new participants; it’s about retention. Ethereum’s exchange supply, representing the quantity readily available for sale, is approaching its historical low of 8.05%. This shift signals a notable move towards self-custody and staking, mitigating the immediate risk of a substantial selloff and fortifying Ethereum’s price floor.

The on-chain strength witnessed translates into tangible market action. Following a brief dip that tested the $2,500 support, Ethereum not only stabilized but turned this once-resilient level into a launchpad.

Analysts are now setting their sights on the $2,700 barrier as the gateway to unlocking a potential price surge, with FOMO (fear of missing out) traders anticipated to join the rally. Beyond this juncture, the horizon appears boundless, with $3,400 emerging as an enticing target.

Caution Amid Excitement: Ethereum’s Unpredictable Trajectory

Yet, amid the excitement, an air of caution permeates the volatile crypto landscape. A breach below the “hammer” formation that materialized on Monday holds the potential to send Ethereum plummeting towards the 20-Day EMA (exponential moving average) at approximately $2,300.

Traders are poised on tenterhooks, meticulously monitoring these crucial levels to decipher the forthcoming trajectory of Ethereum’s journey.

One undeniable truth emerges: Ethereum is casting off the shadow of Bitcoin and carving out its unique path. With an increasing dominance, a fervent user base, and a focus on self-custody, Ethereum is laying the groundwork for future expansion.

Whether it attains the envisioned $3,400 pinnacle or steers towards an alternate destiny, one certainty prevails—Ethereum is an influential force, and its narrative is only in its nascent stages.

Meanwhile, in order to bolster Ethereum’s increasing dominance over Bitcoin, Michaël van de Poppe, the founder and CEO of trading company MNTrading, observed that Bitcoin was falling behind Ethereum in terms of the total market capitalization of cryptocurrencies.

In a post on X dated January 12, he included the following graphic with the caption, “#Bitcoin dominance peaking before the halving and maybe signifying a cycle top.” It’s conceivable that altcoins will perform better in the near future.

Featured image from Shutterstock

Ethereum Price Grinds Higher, Is This The Start Bulls Were Waiting For?

Ethereum price is attempting a fresh increase above the $2,550 level. ETH could continue to move up unless there is a drop below the $2,525 support.

  • Ethereum is attempting a fresh increase above the $2,520 level.
  • The price is trading above $2,520 and the 100-hourly Simple Moving Average.
  • There is a connecting bullish trend line forming with support at $2,540 on the hourly chart of ETH/USD (data feed via Kraken).
  • The pair could continue to move up if it clears the $2,600 and $2,620 resistance levels.

Ethereum Price Holds Support

Ethereum price remained well-supported above the $2,450 level. ETH outperformed Bitcoin and started a fresh increase above the $2,500 resistance zone.

There was a move above the $2,550 resistance and the 100-hourly Simple Moving Average. The price even broke the $2,600 level before the bears appeared. A high is formed near $2,614 and the price is now correcting gains. There was a minor move below the 23.6% Fib retracement level of the upward move from the $2,471 swing low to the $2,614 high.

Ethereum is still trading above $2,520 and the 100-hourly Simple Moving Average. There is also a connecting bullish trend line forming with support at $2,540 on the hourly chart of ETH/USD. It is close to the 50% Fib retracement level of the upward move from the $2,471 swing low to the $2,614 high.

On the upside, the price is facing resistance near the $2,600 level. The next major resistance is now near $2,620. A clear move above the $2,620 level might start a decent increase. In the stated case, the price could rise toward the $2,665 level.

Ethereum Price

Source: ETHUSD on TradingView.com

The main breakout zone is now forming near the $2,710 zone. A close above the $2,710 resistance could start another major increase. The next key resistance is near $2,780. Any more gains might send the price toward the $2,880 zone.

Fresh Decline in ETH?

If Ethereum fails to clear the $2,620 resistance, it could start another decline. Initial support on the downside is near the $2,550 level and the trend line.

The next key support could be the $2,500 zone. A downside break below the $2,500 support might send the price further lower. In the stated case, Ether could test the $2,450 support. Any more losses might send the price toward the $2,350 level.

Technical Indicators

Hourly MACDThe MACD for ETH/USD is losing momentum in the bullish zone.

Hourly RSIThe RSI for ETH/USD is now above the 50 level.

Major Support Level – $2,540

Major Resistance Level – $2,620

Ethereum Trouncing Bitcoin, ETH/BTC Ratio Bouncing Higher: Will This Trend Continue?

Amidst a volatile crypto market, Ethereum (ETH) is gaining momentum, outperforming its long-time rival Bitcoin (BTC). According to Kaiko data, the ETH/BTC ratio has steadily risen, rebounding from multi-year lows. 

ETHBTC ratio trend | Source: Kaiko on X

ETH/BTC Ratio Rising, ETH Momentum Building

The ETH/BTC ratio technically gauges market sentiment towards these two leading crypto. The recent rebound indicates investors are increasingly bullish on Ethereum’s potential relative to Bitcoin. 

This upward trajectory is fueled by growing optimism surrounding the potential approval of spot Ethereum ETFs and the general confidence that markets will trend higher in 2024. The prospect of this product entering the market has also injected fresh energy into the ETH ecosystem, lifting the second most valuable coin by market cap.

Related Reading: Institutional Inflows Into XRP Surges 244% Amid ETF Speculation

After protracted lower lows, the ETH/BTC ratio began rising immediately after the United States Securities and Exchange Commission (SEC) approved 11 spot Bitcoin ETFs last week. This unexpected shift, analysts observe, is primarily because of increasing confidence in the SEC approving a similar product for ETH.

Spot Ethereum ETFs, which would provide direct exposure to the Ethereum market, would make it easier for institutional investors to benefit from the volatility of ETH. So far, the SEC has approved an Ethereum Futures ETF, which, unlike the spot ETF, tracks an index, not the direct price of this asset.

Blackrock is among the leading Wall Street giants interested in issuing a spot Ethereum ETF. Considering its history of success, the decision by one of the world’s leading asset managers to apply for this product is an endorsement of its prospects. Earlier, Larry Fink, the CEO of BlackRock, said Ethereum, despite its scaling challenge, might spearhead the tokenization drive in the years ahead.

US SEC Yet To Clarify Whether Ethereum Is A Commodity Or Security

Even so, the SEC has yet to clarify whether ETH, a coin pre-mined with some assets distributed to the Ethereum Foundation, is a commodity like Bitcoin. Earlier, Gary Gensler, the chairperson of the SEC, was cornered by the United States policymakers to give the agency’s stand on the coin but didn’t.

Ethereum rising versus Bitcoin on the daily chart | Source: ETHBTC on Binance, TradingView

Nonetheless, with the prospect of spotting Ethereum ETFs and the dominance of Ethereum in decentralized finance (DeFi) and non-fungible tokens (NFTs), ETH will likely continue outperforming BTC in the coming months. Price action data shows that ETH is already up 20% versus BTC in the past trading week.